Receptivity to Tobacco Advertising and
Susceptibility to Tobacco Products
John P. Pierce, PhD, a, b James D. Sargent, MD, c Martha M. White, MS, a Nicolette Borek, PhD, d David B. Portnoy, PhD, MPH, d
Victoria R. Green, BA, e, f Annette R. Kaufman, PhD, MPH, g Cassandra A. Stanton, PhD, h, i Maansi Bansal-Travers, PhD, j
David R. Strong, PhD, a, b Jennifer L. Pearson, PhD, MPH, k, l Blair N. Coleman, PhD, MPH, d Eric Leas, MPH, a, b Madison L. Noble, MPH, a, b
Dennis R. Trinidad, PhD, a, b Meghan B. Moran, PhD, k Charles Carusi, PhD, h Andrew Hyland, PhD, j Karen Messer, PhDa, b
abstract
BACKGROUND AND OBJECTIVES: Non–cigarette tobacco marketing is less regulated and maypromote cigarette smoking among adolescents. We quantified receptivity to advertising for multiple tobacco products and hypothesized associations with susceptibility to cigarette smoking.
METHODS: Wave 1 of the nationally representative PATH (Population Assessment of Tobacco
and Health) study interviewed 10751 adolescents who had never used tobacco. A stratified random selection of 5 advertisements for each of cigarettes, e-cigarettes, smokeless
products, and cigars were shown from 959 recent tobacco advertisements. Aided recall was classified as low receptivity, and image-liking or favorite ad as higher receptivity. The main dependent variable was susceptibility to cigarette smoking.
RESULTS: Among US youth, 41% of 12 to 13 year olds and half of older adolescents were
receptive to at least 1 tobacco advertisement. Across each age group, receptivity to advertising was highest for e-cigarettes (28%–33%) followed by cigarettes (22%–25%), smokeless tobacco (15%–21%), and cigars (8%–13%). E-cigarette ads shown on television had the highest recall. Among cigarette-susceptible adolescents, receptivity to e-cigarette advertising (39.7%; 95% confidence interval [CI]: 37.9%–41.6%) was higher than for cigarette advertising (31.7%; 95% CI: 29.9%–33.6%). Receptivity to advertising for each tobacco product was associated with increased susceptibility to cigarette smoking, with no significant difference across products (similar odds for both cigarette and e-cigarette advertising; adjusted odds ratio = 1.22; 95% CI: 1.09–1.37).
CONCLUSIONS: A large proportion of US adolescent never tobacco users are receptive to
tobacco advertising, with television advertising for e-cigarettes having the highest recall. Receptivity to advertising for each non–cigarette tobacco product was associated with susceptibility to smoke cigarettes.
aCancer Prevention Program, Moores Cancer Center, and bDepartment of Family Medicine and Public Health,
University of California, San Diego, La Jolla, California; cC. Everett Koop Institute, Norris Cotton Cancer Center,
Geisel School of Medicine at Dartmouth, Hanover, New Hampshire; dCenter for Tobacco Products, US Food and
Drug Administration, Silver Spring, Maryland; eNational Institute on Drug Abuse, National Institutes of Health,
Bethesda, Maryland; fKelly Government Solutions, Rockville, Maryland; gTobacco Control Research Branch,
Behavioral Research Program, Division of Cancer Control and Population Sciences, National Cancer Institute, National Institutes of Health, Rockville, Maryland; hWestat, Rockville, Maryland; iDepartment of Oncology, Cancer
Prevention and Control Program, Lombardi Comprehensive Cancer Center, Georgetown University Medical Center, Washington, District of Columbia; jDepartment of Health Behavior, Roswell Park Cancer Institute, Buffalo,
New York; kDepartment of Health, Behavior, and Society, Bloomberg School of Public Health, Johns Hopkins
University, Baltimore, Maryland; and lSchroeder Institute for Tobacco Research and Policy Studies at Truth
Initiative, Washington, District of Columbia
Dr Pierce conceptualized and designed the study and drafted the initial manuscript; Dr Sargent conceptualized and designed the study including the study instruments and critically reviewed
NIH
To cite: Pierce JP, Sargent JD, White MM, et al. Receptivity to Tobacco Advertising and Susceptibility to Tobacco Products. Pediatrics. 2017;139(6):e20163353
WhaT’s KnoWn on This subjecT: The consensus that cigarette marketing is 1 cause of adolescent smoking is the basis for marketing constraints imposed on these products in the United States and elsewhere. Little is known about the influence of marketing for non–
cigarette tobacco products.
Cigarette advertising has been causally linked with adolescent smoking initiation, 1 prompting
marketing restrictions to reduce smoking among minors.2 However,
these restrictions are not uniformly applied across tobacco products. For example, e-cigarettes, introduced in the past decade, are currently allowed to be advertised on television.3 E-cigarette marketing
budgets increased rapidly, 4 with
a growing presence on television reaching youth and young adult markets.5 The Centers for Disease
Control and Prevention reports6
that high school students in the United States are increasingly using e-cigarettes (2015 = 16.0%), whereas the decline in cigarette smoking may have stalled (2015 = 9.3%). The 2015 high school use of cigars was 8.6%, use of hookahs was 7.2%, and smokeless tobacco use was 6.0%. In a randomized trial, exposure to select television advertisements (ads) for e-cigarettes increased the susceptibility to use e-cigarettes.7
In 2014, Blu was the dominant e-cigarette brand that
used television advertising.5, 8 Its
ads often modeled vaping, which has many behavioral similarities to cigarette smoking. These similarities have led to suggestions that these ads might promote cigarette smoking as well.9, 10
The effect of advertising on adolescent smoking has been investigated by using the communication-persuasion matrix, 11–13 which states that an
individual’s receptivity to an ad can be ordered hierarchically by items that query exposure, cognitive recall, and affective response (eg, liking, having a favorite ad).14 At the height
of popular cigarette marketing campaigns in the 1990s (Joe Camel, Marlboro Miles), more than half of California adolescents indicated a favorite cigarette advertisement15
and this higher level of receptivity was associated with later cigarette
smoking.16, 17 Lower levels of
receptivity to advertising, such as recall of ads without affective response, have been associated with later initiation of alcohol use.18
Furthermore, researchers who have combined recall and liking measures into an “any receptivity” construct have identified associations with first use of both cigarettes19, 20 and
alcohol21. Visual prompting (aided
recall) is necessary to obtain valid measures.22 We know of no study
that has sampled a substantial proportion of all available tobacco advertising and reported population estimates for aided recall of either individual ads or ads for a product category.
Susceptibility to smoking is a validated measure that predicts the risk of smoking initiation as many as 3 to 4 years before first experimentation.23–25 A series of
questions identifies “committed never users” as those who have never been curious about use, have strong intentions not to use, and who would resist an offer to use from a best friend. All other never users are considered susceptible. Susceptibility and subsequent experimentation vary across sociodemographic variables, receptivity to tobacco marketing, 16, 17 exposure to other
tobacco users, 26 use of another
psychoactive substance, 27 use of
another tobacco product, 28 and
psychosocial variables such as externalizing problem behaviors (eg, rule-breaking, aggression), 29
internalizing problem behaviors (eg, depression, anxiety), 30 and
sensation-seeking.31
This study explores levels of receptivity to the marketing of e-cigarettes, cigarettes, cigars, and smokeless tobacco products among never-using 12 to 17 year olds, with the use of data from the national Population Assessment of Tobacco and Health (PATH) Study. The study design allowed us to assess adolescent receptivity
to advertising for multiple tobacco products and to summarize this in a measure of receptivity to any tobacco advertising. We investigated whether this general receptivity to tobacco advertising was associated with susceptibility to use any tobacco product. Finally, we investigated the associations of advertising receptivity to each product with susceptibility to cigarette smoking.
MeThods
adolescent sample
Data are from wave 1 of the PATH study, which is a nationally representative sample of the civilian, noninstitutionalized US population, aged ≥12 years between September 2013 and December 2014.32, 33
With oversight from the National Institute of Drug Abuse and the Food and Drug Administration, Westat collected data with the use of audio-computer–assisted self-interviews. Westat’s Institutional Review Board approved the study design/protocol, and the Office of Management and Budget approved the data collection. Households were identified by using an address-based, area-probability sampling method, and a screener survey enumerated household members (response rate = 54%). Generally, all youth aged 12 to 17 years (maximum 2 per household) were selected for interview, and parental consent and youth assent were obtained. Interviews were completed for 78.4% of selected youth. The data were weighted to adjust for the complex sample design and nonresponse to allow population estimates. If the respondent did not answer regarding their age, sex, race, or Hispanic ethnicity, these were obtained from the household screener (n = 704 or 6.6%) or, if not available, by using statistical imputation methods (n = 143 or 1.3%).34 In this article, our analyses
reported that they had never used any tobacco product.
dependent Variable: susceptibility To use Tobacco Products and cigarettes
Following previous research, 23, 24
never users who had heard of the product were classified as either susceptible to use or committed never users on the basis of their responses to 3 questions assessing their curiosity about the product, intention to try it in the near future, and likely response if a best friend were to offer them the product (see Supplemental Information). Only those with the strongest rejection to all 3 questions were categorized as committed never users to each of the following 8 products (cigarettes, e-cigarettes, pipes, cigars, hookahs, smokeless tobacco, dissolvable tobacco, and bidis/kreteks). The strongest rejection to all questions for all products classified an individual as a committed never tobacco user; all others were considered to be susceptible to use
≥1 products. For this analysis, those who had never heard of a product were considered to be committed never users.
Key independent Variable: Receptivity to Tobacco Product advertising
Favorite Ad
Respondents were asked “What is the brand of your favorite tobacco advertisement?” A list of brands was provided, with an option to nominate another brand. We assumed that identifying Marlboro or Camel as favorite referred to cigarettes, unless snus was specifically mentioned. Aided Recall and Liking of Contemporary Ads
Respondents were shown, 1 at a time, a stratified random set of 20 tobacco advertisements (5 for each of the following 4 products: cigarettes, e-cigarettes, cigars, and smokeless products) from 959 recently used
print, direct mail, Internet, and television ads. We purchased all available ads (i.e. a near census) from 2 commercial ad-monitoring firms (Competitrack and Mintel). The initial ad pool (period 1 [P1]) was refreshed once in January 2014 (period 2 [P2]). Within each of the 4 product sets, randomization was within substrata levels. The 5 cigarette ads always contained a randomized print ad for Marlboro (P1: n = 43 ads; P2: n = 27 ads), Camel (P1: n = 36; P2: n = 36), and Newport (P1: n = 88; P2: n = 52), which made up 76% of available print ads for cigarettes. The final 2 cigarette ads were randomly selected from other brand ads (P1: n = 59; P2: n = 26). The 5 smokeless tobacco print ads included 2 randomly selected ads for snus products (P1:
n = 56; P2: n = 21), 2 for oral dip products (P1: n = 99; P2: n = 62), and 1 for chew products (P1: n = 2; P2: n = 3). The cigar set included 1 randomly chosen from the large cigars set (P1: n = 200; P2: n = 134) and 4 randomly chosen from the little cigars and cigarillos set (P1:
n = 45; P2: n = 6). The e-cigarette set included 2 ads that were “still shots”
of television ads (P1: n = 11; P2: n = 24). The remaining 3 e-cigarette ads were chosen randomly from print ads (P1: n = 59; P2: n = 68). The frequency with which each brand was presented to respondents was a function of how many ads there were for a given product in the ad pool and the total number of ads in each pool.
For each ad presented, respondents were asked if they had seen the ad in the past 12 months and whether they liked the ad. We categorized receptivity for each product category as follows: (1) no receptivity (no recall or liking of any of the 5 ads and no indication of a favorite ad that was for the category’s product), (2) low receptivity (recall of at least 1 ad but no indication of liking any ad in the category or having a favorite ad that was for the category’s product), (3) moderate receptivity (liking at
least 1 of the ads or naming a favorite ad that was for the category’s product), and (4) high receptivity (liking at least 1 of the ads and a having favorite ad that was for the category’s product).
Recall of advertisements by brand
The above sampling scheme allowed some respondents to see >1 ad for a brand within a category, particularly for the little cigars and cigarillos set in P2. When >1 ad was shown for a brand, aided recall was assessed only on the first ad that was displayed. We computed the estimated recall rate as the weighted proportion of respondents who recalled seeing an ad for the brand out of the total number of respondents who were shown an ad for the brand. Before ranking brands on the frequency of recall, we removed brands with advertisements that were shown to <500 participants. Thus, for the rank order of aided recall, we considered a total of 55 tobacco brands (9 cigarette brands, 9 e-cigarette brands with television ads, 14 e-cigarette brands with print ads, 9 smokeless brands, and 14 cigar brands).
other covariates of Tobacco use in adolescence
Exposure to Tobacco Use
All respondents were asked: “Does anyone who lives with you now use any of the following: [list of tobacco products]” and “During the past 7 days, about how many hours were you around others who were smoking? Include time in your home, in a car, at school or outdoors.”
We report 2 binary variables: 1 for household exposure (no users of tobacco in the household versus any) and 1 for general exposure (no exposure to smoking by others in the past 7 days versus any).
Use of Other Drugs or Alcohol
Adderall, painkillers, sedatives, tranquilizers), cocaine or crack, methamphetamine or speed, heroin, inhalants, solvents, and hallucinogens by a series of questions: “Have you ever used [substance]?” (See Supplemental Information for the full list of questions). Adolescents who reported ever use of any of these were classified as “any use”; all others were classified as “no use.”
Psychosocial Predictors of Tobacco Use We adjusted for mental health and substance use problems by using scales from the Global Appraisal of Individual Needs–Short Screener.35
The internalizing subscale (α = .81) included 4 items of depressive and anxiety symptoms. The externalizing subscale (α = .70) included
experience with 5 conduct and behavioral items. The substance use problems subscale (α = .67) asked 7 questions about problems associated with alcohol or drug use. Adolescents were scored on how many items they had experienced in the past month or past 2 to 12 months (see Supplemental Information for questions). In addition, sensation seeking (α = .74) was assessed by 3 items modified from the Brief Sensation Seeking Scale.36 On all
scales, respondents were scored as having no symptoms (0), low to moderate symptom levels (1–2), or high symptom levels (≥3).
statistical analyses
Analyses were performed by using SAS Software, version 9.3 (SAS Institute, Cary, NC).37 We
used the survey weights supplied with the data, and computed variances and P values by using the recommended Balanced Repeated Replication method with Fay = 0.3.27, 33, 38 Weighted percentages
were calculated with SAS version 9.3 PROC SURVEYFREQ. Modified Wilson confidence limits for proportions were calculated on the weighted estimates by using PROC SURVEYFREQ. Separate
logistic regression models tested the association of receptivity to any tobacco advertising with
susceptibility to any tobacco product, as well as with susceptibility to cigarette smoking. These models controlled for the above-mentioned covariates. χ2 Tests were also
conducted to test for significant differences between percentage recall of pairs of selected ad brands or modes. Odds ratios, confidence limits, and P values are reported from the weighted, adjusted model (calculated via PROC SURVEYLOGISTIC).
ResulTs
demographic characteristics
This sample of adolescent never tobacco users was balanced on sex and had a high proportion of younger adolescents (12–13 years: 39.5%; 14–15 years: 34.1%; 16–17 years: 26.4%) (Table 1). Just over half were non-Hispanic white (53.6%), 22.4% were Hispanic, 14.4% were non-Hispanic African American, 5.2% were Asian, and 4.5% were other races/ethnicities. Most adolescents (82.0%) had parents who completed high school, and 60.7% had parents with at least some college education. Never tobacco users who were not receptive to any tobacco advertising (54%) had the lowest susceptibility to any tobacco use (34.3%; 95% confidence interval [CI]: 32.9%–
35.6%). Among never users with low receptivity (34%), 50.4% (95% CI: 48.5%–52.2%) were susceptible. Among the 10% of never users who had a moderate receptivity, 65.4% (95% CI: 62.2%–68.4%) were susceptible. Among the <2% of never users with high receptivity to tobacco advertising, 87.7% (95% CI: 81.2%–92.2%) were susceptible to any tobacco product.
Receptivity to Tobacco advertising
Overall, 41.0% of 12 to 13 year olds and approximately half of both 14 to
15 year olds and 16 to 17 year olds were classified as being receptive to any tobacco advertising (Table 2). Approximately one-third of each age group had a low level of receptivity. There were significantly fewer 12 to 13 year olds with moderate or high receptivity (8.8%) compared with 16- to 17-year-old adolescents (15.0%) (P < .001).
E-cigarette ads generated the highest proportion of adolescents who were receptive. For 12 to 13 year olds, 27.8% were receptive to ads for e-cigarettes, 21.5% to ads for cigarettes, 14.8% to ads for smokeless tobacco, and 7.9% to ads for cigars. For 16 to 17 year olds (14–15 year olds had similar numbers), 32.7% were receptive to ads for e-cigarettes, 25.0% to ads for cigarettes, 20.5% to ads for smokeless tobacco, and 12.6% to ads for cigars.
In multivariable logistic regression (Table 1) controlling for potential confounding variables, even low receptivity to any tobacco ads was significantly associated with increased concurrent susceptibility to use any tobacco product (adjusted odds ratio [aOR]: 1.38; 95% CI: 1.25–
1.53). Moderate and high receptivity levels had higher and significant odds ratios (moderate: aOR = 2.39, P < .001; high: aOR = 6.73, P < .001).
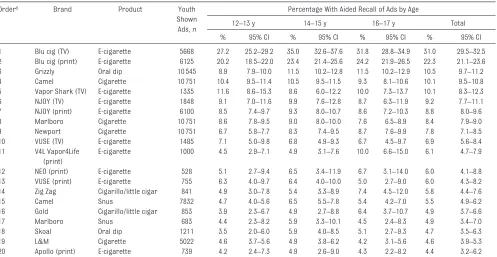
aided Recall for Tobacco advertising by brand
Four of the top 10 recalled ads were television ads for e-cigarettes and half of the top 20 recalled ads were for e-cigarette brands (Table 3). The television ads for Blu e-cigarettes were recalled the most (31.0%; 95% CI: 29.5%–32.5%) followed by Blu print ads (22.3%; 95% CI: 21.1%–
Table 1 Logistic Regression Predicting Susceptibility to Any Tobacco Product Among Never-Using Adolescents
Variable Population Susceptible
n % 95% CI % 95% CI aOR 95% CI P
Age, y
12–13 4312 39.5 38.6–40.5 34.9 33.5–36.4 Ref — —
14–15 3689 34.1 33.2–35.0 47.7 45.9–49.5 1.38 1.25–1.53 <.001
16–17 2750 26.4 25.6–27.2 52.1 50.1–54.1 1.44 1.28–1.61 <.001
Sex
Male 5422 50.4 49.5–51.4 43.5 42.1–44.9 1.12 1.02–1.24 .02
Female 5329 49.6 48.6–50.5 44.1 42.7–45.7 Ref — —
Race/ethnicity
NH white 5107 53.6 52.6–54.5 41.5 39.9–43.2 Ref — —
NH African American 1538 14.4 13.8–15.1 48.3 45.4–51.2 1.46 1.25–1.70 <.001
Hispanic 3132 22.4 21.6–23.2 46.7 44.9–48.5 1.63 1.47–1.81 <.001
Asian 318 5.2 4.8–5.6 36.8 31.5–42.4 1.14 0.87–1.49 .34
Other 656 4.5 4.1–4.9 50.1 45.8–54.5 1.32 1.07–1.63 .009
School performance
Mostly A’s 3003 30.0 29.0–31.0 37.2 35.5–39.0 0.72 0.63–0.82 <.001
A’s and B’s 3796 34.8 33.9–35.7 44.2 42.4–46.3 0.89 0.78–1.01 .08
Other 3952 35.2 34.1–36.3 49.0 47.3–50.7 Ref — —
Parental educationa
Less than HS graduate 2184 17.2 16.1–18.5 43.5 41.5–45.6 Ref — —
HS graduate 2408 21.3 20.2–22.5 42.2 40.2–44.2 0.92 0.81–1.05 .21
Some college 2876 26.9 25.6–28.3 44.4 42.4–46.5 1.00 0.89–1.13 .97
College graduate 3205 33.8 31.6–36.0 44.5 42.5–46.4 1.25 1.09–1.43 .001
No data 78 0.8 0.06–1.0 45.2 34.0–56.9 1.08 0.67–1.74 .77
Tobacco user in HH
No 7427 70.3 68.6–72.0 41.0 39.6–42.4 — — —
Yes 3324 29.7 28.0–31.4 50.5 48.6–52.5 1.19 1.06–1.34 .003
Exposure to smoking
Some exposure 3834 35.0 33.8–36.3 53.5 51.8–55.1 1.39 1.26–1.54 <.001
No exposure 6917 65.0 63.7–66.2 38.6 37.3–39.9 Ref — —
Ad receptivity
None 5762 54.1 53.0–55.3 34.3 32.9–35.6 Ref — —
Low 3741 34.1 33.0–35.3 50.4 48.5–52.2 1.38 1.24–1.53 <.001
Moderate 1070 10.1 9.5–10.7 65.4 62.2–68.4 2.39 2.02–2.84 <.001
High 178 1.7 1.4–2.0 87.7 81.2–92.2 6.73 3.90–11.61 <.001
Internalizing problems
None 3627 33.5 32.4–34.5 28.9 27.3–30.5 Ref — —
Low–moderate 3606 33.8 32.7–34.9 43.4 41.8–45.1 1.34 1.19–1.51 <.001
High 3518 32.8 31.6–34.0 59.4 57.3–61.5 1.62 1.42–1.84 <.001
Externalizing problems
None 3767 35.0 33.8–36.1 26.2 24.6–27.8 Ref — —
Low–moderate 4198 38.9 37.9–39.9 46.9 45.2–48.6 1.55 1.39–1.73 <.001
High 2786 26.1 25.1–27.1 62.8 60.6–65.0 2.07 1.81–2.37 <.001
Sensation seeking
None 6536 61.0 60.0–62.0 34.3 33.1–35.5 Ref — —
Low–moderate 3678 34.0 33.1–34.9 56.3 54.4–58.1 1.58 1.43–1.76 <.001
High 537 5.0 4.6–5.4 75.2 70.5–79.3 2.52 1.92–3.29 <.001
Substance use problems
None 10251 95.5 95.1–95.9 42.3 41.3–43.4 Ref — —
Low–moderate 426 3.9 3.5–4.3 74.5 69.7–78.8 0.99 0.74–1.32 .95
High 74 0.6 0.5–0.8 82.8 72.7–89.8 1.41 0.74–2.69 .30
Used other substances
No 7269 66.8 65.5–68.1 32.0 30.9–33.1 Ref — —
Yes 3482 33.2 31.9–34.5 67.6 66.0–69.2 2.99 2.69–3.33 <.001
Percentages, confidence limits, odds ratios, and P values are all weighted estimates. Other categories presented in the table may include respondents who did not provide data for the question. HH, household; HS, high school; NH, non-Hispanic; Ref, reference.
Table 2 Receptivity to Tobacco Advertising by Product Type Among Never Tobacco Users Product Type and
Age, y
Receptivity
Low Moderate High Anya
% 95% CI % 95% CI % 95% CI % 95% CI
Any product
12–13 32.2 30.8–33.8 7.6 6.7–8.5 1.2 0.9–1.6 41.0 39.5–42.6
14–15 36.0 34.2–37.8 11.2 10.0–12.4 1.6 1.2–2.1 48.7 46.8–50.6
16–17 34.5 32.6–36.5 12.5 11.1–13.9 2.5 1.9–3.3 49.5 47.4–51.6
E-cigarettes
12–13 24.2 22.9–25.6 3.3 2.7–3.9 0.3 0.2–0.6 27.8 26.5–29.2
14–15 28.0 26.4–29.7 4.2 3.5–5.1 0.5 0.3–0.8 32.8 31.0–34.5
16–17 27.2 25.5–28.9 4.9 4.1–6.0 0.6 0.3–1.0 32.7 30.6–34.8
Cigarettes
12–13 18.2 17.0–19.5 3.1 2.5–3.7 0.2 0.1–0.4 21.5 20.2–22.8
14–15 19.5 18.1–21.0 5.2 4.3–6.2 0.3 0.2–0.5 25.0 23.36–26.8
16–17 17.7 16.0–19.4 6.4 5.6–7.4 0.9 0.6–1.4 25.0 23.3–26.8
Smokeless tobacco
12–13 12.2 11.2–13.3 2.4 2.0–3.0 0.1 0.1–0.3 14.8 13.5–16.1
14–15 16.1 14.7–17.6 3.5 2.9–4.2 0.2 0.1–0.4 19.8 18.2–21.5
16–17 15.6 14.1–17.2 4.8 4.0–5.7 0.1 0.1–0.4 20.5 18.9–22.2
Cigarsb
12–13 6.6 5.8–7.4 1.4 1.0–1.8 0.0 0.0–0.2 7.9 7.1–8.9
14–15 8.8 7.9–9.7 1.9 1.4–2.6 0.1 0.0–0.4 10.8 9.8–11.9
16–17 8.8 7.7–10.0 3.7 3.0–4.5 0.1 0.0–0.2 12.6 11.3–14.0
Percentages and confidence limits are weighted estimates. N = 10751.
a Any receptivity is the sum of low, moderate, and high receptivity levels. No receptivity is not shown but is equal to 100 − any. For all products, the age differences are significant (P < .001), as determined by χ2 tests.
b Cigars include traditional cigars, cigarillos, and filtered cigars.
Table 3 Ads for Tobacco Brands With the Highest Aided Recall by Age Group Among US Never Tobacco Users
Ordera Brand Product Youth
Shown Ads, n
Percentage With Aided Recall of Ads by Age
12–13 y 14–15 y 16–17 y Total
% 95% CI % 95% CI % 95% CI % 95% CI
1 Blu cig (TV) E-cigarette 5668 27.2 25.2–29.2 35.0 32.6–37.6 31.8 28.8–34.9 31.0 29.5–32.5
2 Blu cig (print) E-cigarette 6125 20.2 18.5–22.0 23.4 21.4–25.6 24.2 21.9–26.5 22.3 21.1–23.6
3 Grizzly Oral dip 10545 8.9 7.9–10.0 11.5 10.2–12.8 11.5 10.2–12.9 10.5 9.7–11.2
4 Camel Cigarette 10751 10.4 9.5–11.4 10.5 9.5–11.5 9.3 8.1–10.6 10.1 9.5–10.8
5 Vapor Shark (TV) E-cigarette 1335 11.6 8.6–15.3 8.6 6.0–12.2 10.0 7.3–13.7 10.1 8.3–12.3
6 NJOY (TV) E-cigarette 1848 9.1 7.0–11.6 9.9 7.6–12.8 8.7 6.3–11.9 9.2 7.7–11.1
7 NJOY (print) E-cigarette 6100 8.5 7.4–9.7 9.3 8.0–10.7 8.6 7.2–10.3 8.8 8.0–9.6
8 Marlboro Cigarette 10751 8.6 7.8–9.5 9.0 8.0–10.0 7.6 6.5–8.9 8.4 7.9–9.0
9 Newport Cigarette 10751 6.7 5.8–7.7 8.3 7.4–9.5 8.7 7.6–9.9 7.8 7.1–8.5
10 VUSE (TV) E-cigarette 1485 7.1 5.0–9.8 6.8 4.9–9.3 6.7 4.5–9.7 6.9 5.6–8.4
11 V4L Vapor4Life (print)
E-cigarette 1000 4.5 2.9–7.1 4.9 3.1–7.6 10.0 6.6–15.0 6.1 4.7–7.9
12 NEO (print) E-cigarette 528 5.1 2.7–9.4 6.5 3.4–11.9 6.7 3.1–14.0 6.0 4.1–8.8
13 VUSE (print) E-cigarette 755 6.3 4.0–9.7 6.4 4.0–10.0 5.0 2.7–9.0 6.0 4.3–8.2
14 Zig Zag Cigarillo/little cigar 841 4.9 3.0–7.8 5.4 3.3–8.9 7.4 4.5–12.0 5.8 4.4–7.6
15 Camel Snus 7832 4.7 4.0–5.6 6.5 5.5–7.8 5.4 4.2–7.0 5.5 4.9–6.2
16 Gold Cigarillo/little cigar 853 3.9 2.3–6.7 4.9 2.7–8.8 6.4 3.7–10.7 4.9 3.7–6.6
17 Marlboro Snus 683 4.4 2.3–8.2 5.9 3.3–10.1 4.5 2.4–8.3 4.9 3.4–7.0
18 Skoal Oral dip 1211 3.5 2.0–6.0 5.9 4.0–8.5 5.1 2.7–9.3 4.7 3.5–6.3
19 L&M Cigarette 5022 4.6 3.7–5.6 4.9 3.8–6.2 4.2 3.1–5.6 4.6 3.9–5.3
20 Apollo (print) E-cigarette 739 4.2 2.4–7.3 4.9 2.6–9.0 4.3 2.2–8.2 4.4 3.2–6.2
Percentages and confidence limits are weighted estimates. In cases in which a respondent saw >1 ad for a brand, only the response to the first presentation of the ad was tallied. Modified Wilson confidence limits are reported. TV, television.
(the fourth most recalled brand ads) (P < .001 for each age group and overall). Recall of television and print ads for NJOY were ranked as the sixth and seventh most recalled ads. For the majority of these most recalled ads, recall by 12 to 13 year olds was similar to recall for older age groups.
association of advertising Receptivity With susceptibility to cigarette smoking
In our multivariable logistic regression controlling for potential covariates, moderate to high receptivity to cigarettes (aOR: 1.57; 95% CI: 1.25–1.98), e-cigarettes (aOR: 1.53; 95% CI: 1.21–1.94), and smokeless tobacco (aOR: 1.58; CI: 1.23–2.03) was significantly associated with concurrent susceptibility to smoke cigarettes (Table 4), which was not the case for moderate to high receptivity to cigar advertising. A low level of receptivity to any of the 4 forms of tobacco advertising was not associated with concurrent
susceptibility to smoke cigarettes.
discussion
With the use of stratified random sampling, we selected 20 ads to present to each respondent, from a near census of recent cigarette, e-cigarette, smokeless tobacco, and cigar ads to assess population levels of receptivity to tobacco advertising among US adolescents who had never used tobacco. Receptivity was highest for e-cigarettes, followed by cigarettes, smokeless tobacco, and cigars. Aided recall of a tobacco ad (without liking or a favorite) was categorized as a low level of receptivity to tobacco advertising and was present in 34% of adolescents. Those with a low receptivity to a product’s advertising were significantly more likely to be concurrently susceptible to use a tobacco product than those who were not receptive. The 12% of adolescents with a moderate to high receptivity to advertising for each of cigarettes, e-cigarettes, and smokeless products were
significantly more likely to be concurrently susceptible to smoke cigarettes. We hypothesize that low levels of receptivity may be associated with committed never smokers becoming susceptible over the following year and propose to test this hypothesis with wave 2 data from the PATH study. Evidence in this article is consistent with the idea that tobacco industry advertising builds a general interest in tobacco use (cigarette smoking, in particular), in addition to any effect in encouraging the use of a particular product brand. In addition, because youth receptivity to tobacco product marketing may be driven by product, brand, and ad-level factors, research identifying the most critical factors will be important to inform regulatory policy.
Despite marketing restrictions on cigarettes and other products, tobacco advertising continues to reach one-third to one-half of adolescents, depending on age. E-cigarette advertising generated the highest reach. This dominance of e-cigarettes is in stark contrast
Table 4 Variables Associated With Susceptibility to Cigarette Smoking Among Adolescent Never Tobacco Users
Receptivity to Population Susceptible to Cigarette Smoking
n % 95% CI % Susceptible 95% CI aOR 95% CI P
Cigarette ads
No receptivity 8158 76.4 75.38–77.36 26.9 25.88–28.00 Ref — —
Low receptivity 2054 18.5 17.64–19.42 37.3 35.12–39.58 1.08 0.96–1.22 .20
Moderate–high receptivity 539 5.1 4.60–5.67 51.6 46.71–56.41 1.57 1.25–1.98 <.001
Smokeless ads
No receptivity 8822 82.0 81.04–82.92 27.8 26.81–28.80 Ref — —
Low receptivity 1560 14.4 13.61–15.30 38.1 35.38–40.85 1.03 0.88–1.22 .70
Moderate–high receptivity 369 3.6 3.20–3.96 51.2 45.97–56.34 1.58 1.23–2.03 <.001
Cigara ads
No receptivity 9617 89.9 89.28–90.42 28.5 27.51–29.44 Ref — —
Low receptivity 890 7.9 7.37–8.45 41.9 38.32–45.49 1.13 0.94–1.36 .20
Moderate–high receptivity 244 2.2 1.95–2.58 54.6 47.65–61.41 1.15 0.81–1.63 .42
E-cigarette ads
No receptivity 7384 69.2 68.13–70.27 26.2 25.14–27.32 Ref — —
Low receptivity 2890 26.3 25.28–27.35 36.3 34.49–38.11 1.11 0.99–1.25 .06
Moderate–high receptivity 477 4.5 4.07–4.94 54.0 48.79–59.17 1.53 1.21–1.94 <.001
Percentages, odds ratios, confidence limits, and P values are all from weighted estimates. The logistic regression model controlled for the variables listed in Table 1: age, sex, race-ethnicity, parental education, school performance, and tobacco use in the household as well as exposure to smoking, the psychosocial risk factor summary measure (none versus any externalizing, internalizing, sensation seeking, or substance use problems), and use of other substances. An indicator for receptivity to each of the product categories was included in the model; thus, a respondent might be receptive to multiple products. Ref, reference.
to the advertising expenditures for each product over the study period: >$9 billion/year for cigarettes, 39
$415 million/year for smokeless products, 40 and only $60 million/
year for e-cigarettes4 (although
this latter amount appears to be growing substantially each year). One explanation for receptivity being highest for the product with the lowest marketing budget4 is
that the product with minimal marketing restrictions may have a significant advantage. Products with less-restricted marketing can use marketing synergies across multiple media channels, which are likely more cost-effective than campaigns for products with significant marketing restrictions.41
It has been noted that television is still among the most effective advertising platforms in the United States.42 In this study,
4 of the top 10 ads recalled were e-cigarette television ads, which made up only a portion of the e-cigarette marketing expenditures, a budget that was 2 orders of magnitude below the cigarette marketing budget.4, 39 Our
results suggest that, even though cigarettes are not allowed to be
advertised on television, interest in them may be increased through observing ads for other tobacco products. This topic, along with how receptivity may affect harm perceptions, will be explored in separate longitudinal analyses of PATH study data.
Two major study strengths are its large nationally representative sample of adolescents and the use of a stratified random sample from a near census of recent tobacco advertising images to gauge reach and receptivity. A limitation is that our findings are cross-sectional and the directionality of associations cannot be determined. However, susceptibility has been a consistent precursor of risk of smoking initiation2 and, in the
PATH study wave 1, susceptibility to use tobacco among 12 to 17 year olds appears to be equivalent to the prevalence of experimentation for those aged a few years older.43
Moreover, this sample will be followed longitudinally, allowing us to confirm whether both low and moderate/high receptivity to tobacco advertising predicts later tobacco use behavior among these never smokers.
conclusions
In this survey, 41% of US 12 to 13 year olds, as well as half of older adolescents who had never used tobacco, were receptive to tobacco adverting and this receptivity was associated with increased susceptibility to cigarette smoking, regardless of the type of tobacco product advertised. Indeed, there was no difference in the association between receptivity for advertising for the different tobacco products and susceptibility to cigarette smoking. E-cigarette advertising was the most recalled by US adolescents, particularly ads that were shown on television. This high level of recall was achieved despite e-cigarette advertising expenditures being a fraction of those for cigarette marketing.
abbReViaTions
CI: confidence interval aOR: adjusted odds ratio P1: period 1
P2: period 2
PATH: Population Assessment of Tobacco and Health
the manuscript; Ms White carried out the initial analyses and reviewed and revised the manuscript; Dr Messer designed the analyses and reviewed and revised the manuscript; Drs Carusi and Hyland lead the PATH project, including the design of survey instruments, and reviewed and revised the manuscript; and Drs Borek, Portnoy, Kaufman, Stanton, Bansal-Travers, Strong, Pearson, Coleman, Trinidad, and Moran and Ms Green, Ms Noble, and Mr Leas reviewed and approved the initial proposed analyses and reviewed and revised the manuscript; and all authors approved the final manuscript as submitted.
The views and opinions expressed in this presentation are those of the authors only and do not necessarily represent the views, official policy, or position of the US Department of Health and Human Services or any of its affiliated institutions or agencies.
doi: https:// doi. org/ 10. 1542/ peds. 2016- 3353 Accepted for publication Mar 15, 2017
Address correspondence to John P. Pierce, PhD, Department of Family Medicine and Public Health, Moores Cancer Center, 3855 Health Sciences Dr, MC 0901, University of California, San Diego, La Jolla, CA 92093-0901. E-mail: jppierce@ucsd.edu
PEDIATRICS (ISSN Numbers: Print, 0031-4005; Online, 1098-4275). Copyright © 2017 by the American Academy of Pediatrics
Financial disclosuRe: The authors have indicated they have no financial relationships relevant to this article to disclose.
FundinG: This study is supported with federal funds from the National Institute on Drug Abuse, National Institutes of Health, and the Food and Drug
Administration, Department of Health and Human Services, under a contract to Westat (contract HHSN271201100027C). Funded by the National Institutes of Health (NIH).
ReFeRences
1. National Cancer Institute. The Role of the Media in Promoting and Reducing Tobacco Use. Tobacco Control Monograph No. 19. NIH Publication No. 07-6242. Bethesda, MD: US Department of Health and Human Services, National Institutes of Health, National Cancer Institute; 2008
2. US Department of Health and Human Services. Preventing Tobacco Use Among Youth and Young Adults: A Report of the Surgeon General. Atlanta, GA: US Department of Health and Human Services, Centers for Disease Control and Prevention, National Center for Chronic Disease Prevention and Health Promotion, Office of Smoking and Health; 2012 3. Grana R, Benowitz N, Glantz SA.
E-cigarettes: a scientific review. Circulation. 2014;129(19):1972–1986 4. Sebastian M. E-cig marketing budgets
growing by more than 100% year over year. Advertising Age. Available at: http:// adage. com/ article/ media/ e- cig- companies- spent- 60- million- ads- year/ 292641/ . Accessed August 18, 2015 5. Duke JC, Lee YO, Kim AE, et al. Exposure
to electronic cigarette television advertisements among youth and young adults. Pediatrics. 2014;134(1). Available at: www. pediatrics. org/ cgi/ content/ full/ 134/ 1/ e29
6. Singh T, Arrazola RA, Corey CG, et al. Tobacco use among middle and high school students: United States, 2011-2015. MMWR Morb Mortal Wkly Rep. 2016;65(14):361–367
7. Farrelly MC, Duke JC, Crankshaw EC, et al. A randomized trial of the effect of e-cigarette TV advertisements on intentions to use e-cigarettes. Am J Prev Med. 2015;49(5):686–693 8. Healy M. An “explosion” of youth
exposure to e-cigarette TV ads. USA Today. Available at: www. usatoday. com/ story/ news/ nation/ 2014/ 06/ 02/ e- cigarettes- tv- ads- youth/ 9760425/ . Accessed June 2, 2014
9. Barnett TE, Soule EK, Forrest JR, Porter L, Tomar SL. Adolescent electronic cigarette use: associations with conventional cigarette and hookah smoking. Am J Prev Med. 2015;49(2):199–206
10. Wills TA, Knight R, Williams RJ, Pagano I, Sargent JD. Risk factors for exclusive e-cigarette use and dual e-cigarette use and tobacco use in adolescents. Pediatrics. 2015;135(1). Available at: www. pediatrics. org/ cgi/ content/ full/ 135/ 1/ e43
11. McGuire WJ. Personality and attitdue change: an information-processing theory. In: Greenwald AG, Brock TC, Ostrom TM, eds. Psychological Foundations of Attitudes. New York, NY: Academic; 1968:171–196
12. McGuire WJ. Attitudes and attitude change. In: Lindzey G, Aronson E, eds. Handbook of Social Pyschology. Vol 2, 3rd ed. New York, NY: Random House; 1985:233–346
13. Ray ML. Marketing Communication and the Hierarchy-of-Effects. Cambridge, MA: Marketing Science Institute; 1973 14. Evans N, Farkas A, Gilpin E, Berry
C, Pierce JP. Influence of tobacco marketing and exposure to smokers on adolescent susceptibility to smoking. J Natl Cancer Inst. 1995;87(20):1538–1545
15. Pierce JP, Gilpin EA, Emery SL, et al. Tobacco Control in California: Who’s Winning the War? An Evaluation of the Tobacco Control Program, 1989-1996. La Jolla, CA: University of California, San Diego; 1998
16. Pierce JP, Choi WS, Gilpin EA, Farkas AJ, Berry CC. Tobacco industry promotion of cigarettes and adolescent smoking. JAMA. 1998;279(7):511–515
17. Gilpin EA, White MM, Messer K, Pierce JP. Receptivity to tobacco advertising and promotions among young adolescents as a predictor of established smoking in young adulthood. Am J Public Health. 2007;97(8):1489–1495
18. Tanski SE, McClure AC, Li Z, et al. Cued recall of alcohol advertising on television and underage drinking behavior. JAMA Pediatr. 2015;169(3):264–271
19. Strong DR, Messer K, Hartman SJ, et al. Pre-adolescent receptivity to tobacco marketing and its relationship to acquiring friends who smoke and cigarette smoking initiation [published online ahead of print March
2, 2017]. Ann Behav Med. 10.1007/ s12160-017-9896-y
20. Morgenstern M, Isensee B, Hanewinkel R. Seeing and liking cigarette advertisements: is there a “mere exposure” effect? Eur Addict Res. 2013;19(1):42–46
21. Morgenstern M, Isensee B, Sargent JD, Hanewinkel R. Attitudes as mediators of the longitudinal association between alcohol advertising and youth drinking. Arch Pediatr Adolesc Med. 2011;165(7):610–616
22. Aitken PP, Leathar DS, O’Hagan FJ, Squair SI. Children’s awareness of cigarette advertisements and brand imagery. Br J Addict. 1987;82(6):615–622
23. Pierce JP, Choi WS, Gilpin EA, Farkas AJ, Merritt RK. Validation of susceptibility as a predictor of which adolescents take up smoking in the United States. Health Psychol. 1996;15(5):355–361 24. Nodora J, Hartman SJ, Strong DR,
et al. Curiosity predicts smoking experimentation independent of susceptibility in a US national sample. Addict Behav. 2014;39(12):1695–1700 25. Strong DR, Hartman SJ, Nodora J,
et al. Predictive validity of the expanded susceptibility to smoke index. Nicotine Tob Res. 2015;17(7):862–869
26. Barrington-Trimis JL, Berhane K, Unger JB, et al. Psychosocial factors associated with adolescent electronic cigarette and cigarette use. Pediatrics. 2015;136(2):308–317
27. Fielder RL, Carey KB, Carey MP. Hookah, cigarette, and marijuana use: a prospective study of smoking behaviors among first-year college women. Addict Behav. 2013;38(11):2729–2735
28. Minaker LM, Shuh A, Nguyen N, Azagba S, Manske SR. Cigarette smoking susceptibility among youth alternate tobacco product users: implications of flavoured tobacco from a national cross-sectional Canadian sample (YSS 2012/2013). BMJ Open. 2015;5(12):e009549
prediction of early substance use. Addiction. 2004;99(12):1548–1559 30. Colder CR, Scalco M, Trucco EM,
et al. Prospective associations of internalizing and externalizing problems and their co-occurrence with early adolescent substance use. J Abnorm Child Psychol. 2013;41(4):667–677
31. Leeman RF, Hoff RA, Krishnan-Sarin S, Patock-Peckham JA, Potenza MN. Impulsivity, sensation-seeking, and part-time job status in relation to substance use and gambling in adolescents. J Adolesc Health. 2014;54(4):460–466
32. Hyland A, Ambrose BK, Conway KP, et al. Design and methods of the Population Assessment of Tobacco and Health (PATH) Study [published online ahead of print August 8, 2016]. Tob Control. 10.1136/tobaccocontrol-2016-052934 33. United States Department of Health
and Human Services, National Institutes of Health, National Institute on Drug Abuse, and Food and Drug Administration, Center for Tobacco Products. Population Assessment of Tobacco and Health (PATH) Study [United States] Restricted-Use Files. ICPSR36231. Ann Arbor, MI: Inter-university Consortium for Political and Social Research. Available at: http:// www. icpsr. umich. edu/ icpsrweb/
NAHDAP/ studies/ 36231. Accessed May 24, 2016
34. United States Department of Health and Human Services, National Institutes of Health, National Institute on Drug Abuse, and Food and Drug Administration, Center for Tobacco Products. Population Assessment of Tobacco and Health (PATH) Study 2013-2016 [United States] Restricted-Use Files User Guide. ICPSR36231-v2. Ann Arbor, MI: Inter-university Consortium for Political and Social Research. Available at: http:// www. icpsr. umich. edu/ cgi- bin/ file? comp= none& study= 36231& ds= 0& file_ id= 1232695& path= NAHDAP2016. Accessed May 24, 2016 35. McDonell MG, Comtois KA, Voss WD,
Morgan AH, Ries RK. Global Appraisal of Individual Needs Short Screener (GSS): psychometric properties and performance as a screening measure in adolescents. Am J Drug Alcohol Abuse. 2009;35(3):157–160
36. Hoyle RH, Stephenson MT, Palmgreen P, Lorch EP, Donohew RL. Reliability and validity of a brief measure of sensation seeking. Pers Individ Dif. 2002;32(3):401–414
37. SAS 9.3 System Options: Reference [computer program]. Cary, NC: SAS Institute, Inc; 2011. Available at: http:// support. sas. com/ documentation/ onlinedoc/ stat/ index. html#stat93
38. SAS Institute, Inc. Balanced Repeated Replication (BRR) method. Cary, NC: SAS Institute, Inc; 2010. Available at: https:// support. sas. com/ documentation/ cdl/ en/ statug/ 63962/ HTML/ default/ viewer. htm#statug_ surveymeans_ a0000000237. htm 39. Federal Trade Commission. Federal
Trade Commission Cigarette Report for 2012. Washington, DC: Bureau for Consumer Protection; 2015
40. Federal Trade Commission. Federal Trade Commission Smokeless Tobacco Report for 2011. Washington, DC: Bureau for Consumer Protection; 2013 41. Naik PA, Raman K. Understanding
the impact of synergy in multimedia communications. J Mark Res. 2003;40(4):375–388
42. Lynch J. Why TV is still the most effective advertising medium: key findings from MarketShare study. Adweek. Available at: www. adweek. com/ news/ advertising- branding/ why- tv- still- most- effective- advertising- medium- 165247. Accessed August 18, 2015
DOI: 10.1542/peds.2016-3353 originally published online May 22, 2017;
2017;139;
Pediatrics
Hyland and Karen Messer
Madison L. Noble, Dennis R. Trinidad, Meghan B. Moran, Charles Carusi, Andrew
Bansal-Travers, David R. Strong, Jennifer L. Pearson, Blair N. Coleman, Eric Leas,
Portnoy, Victoria R. Green, Annette R. Kaufman, Cassandra A. Stanton, Maansi
John P. Pierce, James D. Sargent, Martha M. White, Nicolette Borek, David B.
Receptivity to Tobacco Advertising and Susceptibility to Tobacco Products
Services
Updated Information &
http://pediatrics.aappublications.org/content/139/6/e20163353
including high resolution figures, can be found at:
References
http://pediatrics.aappublications.org/content/139/6/e20163353#BIBL
This article cites 28 articles, 6 of which you can access for free at:
Subspecialty Collections
http://www.aappublications.org/cgi/collection/smoking_sub
Smoking
http://www.aappublications.org/cgi/collection/substance_abuse_sub
Substance Use
icine_sub
http://www.aappublications.org/cgi/collection/adolescent_health:med
Adolescent Health/Medicine following collection(s):
This article, along with others on similar topics, appears in the
Permissions & Licensing
http://www.aappublications.org/site/misc/Permissions.xhtml
in its entirety can be found online at:
Information about reproducing this article in parts (figures, tables) or
Reprints
http://www.aappublications.org/site/misc/reprints.xhtml
DOI: 10.1542/peds.2016-3353 originally published online May 22, 2017;
2017;139;
Pediatrics
Hyland and Karen Messer
Madison L. Noble, Dennis R. Trinidad, Meghan B. Moran, Charles Carusi, Andrew
Bansal-Travers, David R. Strong, Jennifer L. Pearson, Blair N. Coleman, Eric Leas,
Portnoy, Victoria R. Green, Annette R. Kaufman, Cassandra A. Stanton, Maansi
John P. Pierce, James D. Sargent, Martha M. White, Nicolette Borek, David B.
Receptivity to Tobacco Advertising and Susceptibility to Tobacco Products
http://pediatrics.aappublications.org/content/139/6/e20163353
located on the World Wide Web at:
The online version of this article, along with updated information and services, is
http://pediatrics.aappublications.org/content/suppl/2017/05/17/peds.2016-3353.DCSupplemental
Data Supplement at:
by the American Academy of Pediatrics. All rights reserved. Print ISSN: 1073-0397.