Improvement in Bone Mineral Density and Body Composition in
Survivors of Childhood Acute Lymphoblastic Leukemia:
A 1-Year Prospective Study
Daniela Marinovic, MD*; Sophie Dorgeret, MD‡; Brigitte Lescoeur, MD§; Corinne Alberti, MD㛳; Miche`le Noel, MD¶; Paul Czernichow, MD*; Guy Sebag, MD‡; Etienne Vilmer, MD§; and
Juliane Le´ger, MD*
ABSTRACT. Objectives. Abnormalities in bone min-eral density (BMD), body composition, and bone metab-olism have been reported in children who were treated for acute lymphoblastic leukemia (ALL) during and after completion of therapy. However, these studies are cross-sectional, and no longitudinal data are available in a large group of patients after completion of therapy. In the present study, 1-year longitudinal changes in BMD, body composition, and bone metabolism were evaluated in children with ALL during the first 3 years after comple-tion of therapy without cranial irradiacomple-tion.
Methods. BMD of total body (TB; g/cm2), areal and apparent volumetric lumbar spine (L2–L4), lean body mass, and percentage of body fat were measured by dual-energy x-ray absorptiometry in 37 children (median age: 7.9 years; range: 4.7–20.6 years) who were treated for ALL at a median age of 3.3 years (range: 1.1–16.6 years), after a median time of 2.2 years after the completion of treatment, and after a 1-year follow-up period. Two con-trol subjects (nⴝ74) who were matched for gender, age, and pubertal stage were also longitudinally investigated for body composition for 1 year. Usual serum biochemi-cal markers of biochemi-calcium metabolism and bone turnover were measured in patients during the study period.
Results. A slight decrease in TB BMD was found
after a median time of 2.2 years after the completion of therapy for ALL in childhood. Patients showed a signif-icantly lower median TB BMD when evaluated <1.5 years as compared with those at>1.5 years since comple-tion of therapy. At the time of first evaluacomple-tion, the per-centage of body fat mass was significantly higher and patients were physically less active than their matched control subjects. Although, as expected, during the 1 year of follow-up both groups showed an annual increment in their BMD measurements, a significantly higher increase in TB BMD was observed in patients in comparison with control subjects. During this same period, the increase in the percentage of body fat mass was slightly lower in ALL patients as compared with control subjects. At the end of the follow-up year, BMD, body-composition
pa-rameters, and physical activity of ALL patients were sim-ilar to those observed in matched control subjects. Serum biochemical markers of bone turnover were normal at both evaluations.
Conclusions. A significant increase in TB BMD and a tendency to a lesser increase in percentage of body fat mass were observed during the study period in ALL patients as compared with chronological age-, gender-, and pubertal stage–matched control subjects. These find-ings suggest a positive effect of long-term completion therapy and increase in physical activity on BMD, body composition, and bone metabolism in patients who have been treated for ALL.Pediatrics2005;116:e102–e108. URL: www.pediatrics.org/cgi/doi/10.1542/peds.2004-1838; bone mineral density, body composition, x-ray absorptiometry, ALL survivors, children.
ABBREVIATIONS. ALL, acute lymphoblastic leukemia; BMD, bone mineral density; SDS, SD score; TB, total body; LS, lumbar spine; PTH, parathyroid hormone; IRMA, immunoradiometric assay.
A
cute lymphoblastic leukemia (ALL) is the most common childhood malignancy, and 80% of children with standard-risk disease can now expect to be cured.1,2 Children with ALLhave reduced bone formation3–10 and bone mineral
density (BMD)3,9,10at diagnosis. Several studies have
demonstrated a BMD decrease during therapy.6–12
Cytotoxic agents and steroids have been said to affect normal bone mass accumulation and bone turnover, leading to increased risk for osteoporosis and frac-tures.5,13 Although studies have consistently shown
that BMD is reduced in patients after the cure of ALL using cranial irradiation during childhood,14–22 few
studies have investigated whether these abnormali-ties persist after completion of therapy in patients who are treated for ALL without the use of cranial irradiation. In such studies, decreased23 and
nor-mal24,25 BMD have been reported. Moreover,
con-trary to the studies in which treatment included cra-nial irradiation,26–28no long-term side effects on lean
and fat body mass were found in these studies.23,24
However, these studies were cross-sectional, and ex-cept for 1 study, in which a limited number of pa-tients showed a tendency to improve BMD and body composition during the first year after completion of treatment,10no longitudinal data on BMD, bone
me-tabolism, and body-composition changes are
avail-From the *Pediatric Endocrinology Unit and Institut National de la Sante´ et de la Recherche Me´dicale U 457 and Departments of ‡Radiology, §Hema-tology, 㛳Biostatistics, and ¶Biochemistry, Hoˆpital Robert Debre´, Paris, France.
Accepted for publication Nov 22, 2004. doi:10.1542/peds.2004-1838
No conflict of interest declared.
Reprint requests to (J.L.) Pediatric Endocrinology Unit and INSERM U 457, Hoˆpital Robert Debre´, 48 Bd Se´rurier, 75019 Paris, France. E-mail: juliane.leger@rdb.ap-hop-paris.fr
able for patients after completion of therapy. The aim of this study was to determine BMD, bone metabo-lism, and body composition in children with ALL during the first 3 years after completion of therapy without cranial irradiation and to evaluate their 1-year longitudinal changes.
METHODS Patients
All patients who received a diagnosis of ALL in the Hematol-ogy Unit of the Robert Debre Hospital (Paris, France) between 1995 and 1999 and who met the following criteria, were eligible for the study: (1) 3 to 21 years of age; (2) white origin; (3) 0 to 3 years after cessation of ALL therapy; and (4) no relapse, second neo-plasm, or bone marrow transplant. Exclusion criteria were (1) cranial irradiation, (2) pregnancy, and (3) chronic diseases or any treatment associated with altered bone metabolism. Among the potential study subjects (n⫽56), 19 declined to participate and 37 (17 girls, 20 boys) were enrolled for the study. No difference was found between participating and nonparticipating subjects with respect to age, gender, or length of time since the completion of treatment. Patients were studied at a first evaluation point (n⫽37) and a second evaluation point 1 year later (n⫽34). Three patients were eliminated from the second evaluation because of relapse (n
⫽1) or moving to another country (n⫽2).
Patients were treated according to the Protocols of the Child Leukemia Cooperative group from EORTC 58881,1 which
in-cluded systemic administration of prednisolone, vincristine, and daunorubicin; l-asparaginase; 6-mercaptopurine; cytarabine; cy-clophosphamide; and 10 intrathecal methotrexate injections dur-ing the intensive phase of treatment. Four patients received a supplementary administration of intravenous methotrexate (6⫻5 g/m2). All patients received prednisone 60 mg/m2for 28 days and
9 days of decreasing dose (1785 mg) during the induction therapy. For standard-risk patients (low and intermediate risk:n⫽35), the reinduction period consisted in 10 mg/m2prednisone with 12
days of progressive decrease (246 mg). In the reinduction period, high-risk patients (n⫽2) received 10 mg/m2dexamethasone for
5 days and then three prednisone pulses of 100 mg/m2(1500 mg)
for 5 days, alternating with three dexamethasone pulses for 5 days (350 mg). Treatment was completed in⬃2 years. No patients were submitted to cranial irradiation.
Two control subjects who were matched for gender, age (within
⫾6 months), and pubertal stage were randomly identified for each patient from a large, healthy group of white children (n⫽266) who were longitudinally investigated for BMD and body compo-sition for 1 year at the Robert Debre hospital.
At both evaluations (initial visit and 1-year follow-up visit), in addition to the BMD (total body [TB] and lumbar spine [LS]), all subjects (patients and control subjects) were evaluated for age, weight, height, pubertal status, calcium intake, and physical ac-tivity. Bone age and usual biochemical markers of calcium metab-olism and bone turnover were measured in patients (fasting blood samples obtained in the morning). Biochemical markers of bone turnover were assessed by serum osteocalcin and bone alkaline phosphatase, specific parameters of bone formation, and by serum CrossLaps as a marker of bone resorption. No blood samples were taken in the control population, which was evaluated only for BMD and body composition. Biochemical data were compared with that from normal children with no history of chronic disease or any current disease or drug therapy (unpublished data).
The study protocol was reviewed and approved by the faculty ethics committee. It was explained to each subject and his or her parents who signed a written consent for participation.
Clinical Assessment
Height, weight, and growth velocity (cm/year) were expressed as the SD score (SDS) for gender and chronological age.29Weight
for height was expressed as BMI (kg/m2⫽weight/height2) in
SDS for gender and chronological age.30 Pubertal development
was scored according to Tanner stage.31Bone age was determined
under blind conditions by 1 investigator (J.L.) according to the method of Greulich and Pyle.32
Questionnaires
Questionnaires were administered to determine current dietary calcium intake, physical activity, and history of fractures in the previous 5 years for all subjects. Calcium dietary intake (mg/day) was assessed by a semiquantitative food frequency question-naire.33
Weekly physical activity was determined according to 3 cate-gories: (1) no sports at all, (2) physical educational classes only with an average of 3 hours/week, and (3) physical educational classes and extracurricular organized sports. History of fracture incidence rate was compared with the incidence rate in our healthy control group during the same period, i.e., the 4 years before the first evaluation (which corresponded to the median duration since ALL diagnosis in the patient group).
BMD Measurements
BMD (bone mineral content divided by bone area) measure-ments of LS (L2–L4) and TB were performed using dual-energy x-ray absorptiometry (Lunar DPXL, Madison, WI). To correct for bone size, we calculated apparent volumetric BMD of LS with the model apparent volumetric BMD LS ⫽BMC/A公A (volume⫽ A公A).34Dual-energy x-ray absorptiometry of TB also estimates
body composition as lean tissue mass (g) and percentage of fat mass. The results were compared with those from the matched control subjects. The coefficient of variation (CV) was 1% and 0.64% for L2–L4 BMD and for TB BMD, respectively. For lean tissue mass and percentage fat mass, the CVs were 1% and 4%, respectively.
Biochemical Parameters
Fasting blood samples of all patients were obtained for the assessment of calcium, phosphorus, magnesium, alkaline phos-phatase, 25-hydroxyvitamin D, 1,25-dihydroxyvitamin D, para-thyroid hormone (PTH), osteocalcin, bone alkaline phosphatase, and CrossLaps. Samples were stored at⫺20°C until assayed.
Intact PTH was measured using the immunoradiometric assay (IRMA) with a kit from Nichols Institute Diagnostics (Paris, France). Serum 25-OH vitamin D was measured using a radioim-munologic assay, kit from Nichols Institute Diagnostics. Serum 1,25-OH-D was measured using a radioimmunologic assay com-mercial kit 1–25 (OH)2Vit D RIACT from Brahms (Saint Oven,
France). Osteocalcin was measured using the IRMA Osteo-Riact kit from Schering (Gif-sur-Yvette, France). Bone alkaline phospha-tase was measured by the IRMA kit Tandem-R Osphospha-tase (Beckman Coulter, Paris, France). Serum CrossLaps was measured using an immunoenzymometric technique with the Serum CrossLaps kit from Nordic Biosciences Diagnostics (Herlev, Denmark). The mean intra- and interassay CVs of osteocalcin, bone alkaline phos-phatase, and CrossLaps were⬍3% and⬍7%,⬍7% and⬍9%, and
⬍5% and⬍8%, respectively.
Statistical Analysis
Results are expressed as median (25th–75th percentiles) for quantitative variables and number (percentages) for qualitative variables. Statistical differences between first and second visit within control and patient groups were assessed by nonparamet-ric paired tests (Wilcoxon paired test). Statistical differences be-tween control subjects and patients were assessed by conditional logistic regression. SDS for serum markers of bone turnover were calculated from normative data in 550 healthy children (unpub-lished data). Relationships between BMD (LS and TB) and body composition (lean body mass and percentage of body fat mass), calcium intake, physical activity, age at diagnosis of ALL, time elapsed since the end of treatment, and patients with or without supplement intravenous methotrexate adjusted for age and gen-der were studied by median regression. All tests were 2-tailed. Statistical analyses were performed using the SAS 8.2 (SAS Inc, Cary, NC) and Stata 7.0 (Stata Corp, College Station, TX) software packages, withPⱕ.05 considered as statistically significant.
RESULTS Clinical Characteristics
a diagnosis of ALL at a median age of 3.3 years (range: 1.1–16.6 years) and were enrolled in the study after a median period of 2.2 years (range: 0.1–3.1 years) after completion of treatment. Overall, the patient group was physically less active (P ⫽ .02), and their mean BMI (SDS) was slightly higher (P⫽
.08) than that of healthy control subjects at the first evaluation. These differences were not found at the second evaluation after 1 year of follow-up.
At the end of the study, the fracture rate observed for the previous 5 years was higher (2 times higher) in patients than in healthy control subjects. In the ALL group, 9 fractures occurred in 8 of the 37 pa-tients (male,n ⫽ 2; female,n ⫽ 6; 22% of subjects). Five fractures were discovered at the time of ALL diagnosis (location of fractures in the extremities, n ⫽ 3; compression of the vertebrae, n ⫽ 2), and 4 fractures (extremities) occurred during treatment (n ⫽ 1) or after discontinuation of therapy (n ⫽ 3). In the control group, 9 fractures occurred in 8 of the 74 patients (male,n⫽6; female,n⫽2; 11% of subjects), 6 fractures occurred before the first evaluation, and 3 fractures occurred during the follow-up period. For control subjects, all fractures were located in the extremities.
BMD and Body Composition
As shown in Table 2, the median BMD (g/cm2) of
TB in ALL patients was slightly reduced (P⫽.06) at baseline, but no difference from control subjects was found at the 1-year follow-up evaluation (P ⫽ .23). When the time elapsed since the end of treatment was considered, the median BMD of TB was signif-icantly reduced in patients who were evaluated⬍1.5 years as compared with those at ⱖ1.5 years since
completion of therapy, either at baseline (P⫽.03) or after the 1 year follow-up (P ⫽ .008). Although the median areal BMD (g/cm2) of LS in ALL patients
was significantly lower at baseline (P ⫽ .04) and slightly reduced at the 1-year follow-up evaluation (P ⫽ .06) in comparison with control subjects (who were matched for age, pubertal stage, and gender), the apparent volumetric BMD of LS was also re-duced in patients as compared with control subjects, but this did not reach significance at either evalua-tion. When we corrected BMD for bone age instead of chronological age, similar patterns were seen (data not shown). No correlation was found between LS BMD measurements and time elapsed since the end of treatment. The median lean body mass was similar for both groups in both evaluations. The median percentage of body fat mass was significantly higher in patients than in control subjects at baseline (P ⫽
.05), but the difference was no longer significant at the 1-year follow-up evaluation (P⫽.94). No corre-lation was found between the body-composition measurements and time elapsed since the end of treatment.
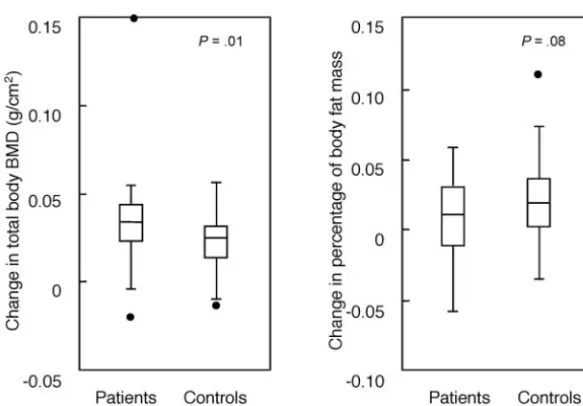
As expected, both groups showed an annual incre-ment in their BMD measureincre-ments. However, at the 1-year follow-up evaluation, TB BMD (but not LS BMD) demonstrated a significantly higher increase (P ⫽.01) in ALL patients as compared with control subjects, and percentage of body fat mass showed a slightly lower increase (P ⫽ .08) in ALL patients as compared with control subjects (Fig 1).
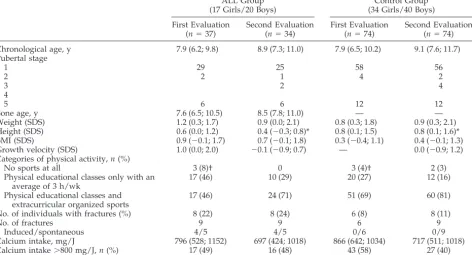
None of the subjects had BMD valuesⱕ⫺2 SDS or TB BMDⱕ⫺1 SDS. As shown in Table 3, no differ-ence was found in either BMD measurements or
TABLE 1. Clinical Characteristics of the Study Population at Baseline and During the 1-Year Follow-up
ALL Group (17 Girls/20 Boys)
Control Group (34 Girls/40 Boys)
First Evaluation (n⫽37)
Second Evaluation (n⫽34)
First Evaluation (n⫽74)
Second Evaluation (n⫽74)
Chronological age, y 7.9 (6.2; 9.8) 8.9 (7.3; 11.0) 7.9 (6.5; 10.2) 9.1 (7.6; 11.7) Pubertal stage
1 29 25 58 56
2 2 1 4 2
3 2 4
4
5 6 6 12 12
Bone age, y 7.6 (6.5; 10.5) 8.5 (7.8; 11.0) — —
Weight (SDS) 1.2 (0.3; 1.7) 0.9 (0.0; 2.1) 0.8 (0.3; 1.8) 0.9 (0.3; 2.1) Height (SDS) 0.6 (0.0; 1.2) 0.4 (⫺0.3; 0.8)* 0.8 (0.1; 1.5) 0.8 (0.1; 1.6)* BMI (SDS) 0.9 (⫺0.1; 1.7) 0.7 (⫺0.1; 1.8) 0.3 (⫺0.4; 1.1) 0.4 (⫺0.1; 1.3) Growth velocity (SDS) 1.0 (0.0; 2.0) ⫺0.1 (⫺0.9; 0.7) — 0.0 (⫺0.9; 1.2) Categories of physical activity,n(%)
No sports at all 3 (8)† 0 3 (4)† 2 (3)
Physical educational classes only with an average of 3 h/wk
17 (46) 10 (29) 20 (27) 12 (16)
Physical educational classes and extracurricular organized sports
17 (46) 24 (71) 51 (69) 60 (81)
No. of individuals with fractures (%) 8 (22) 8 (24) 6 (8) 8 (11)
No. of fractures 9 9 6 9
Induced/spontaneous 4/5 4/5 0/6 0/9
Calcium intake, mg/J 796 (528; 1152) 697 (424; 1018) 866 (642; 1034) 717 (511; 1018) Calcium intake⬎800 mg/J,n(%) 17 (49) 16 (48) 43 (58) 27 (40) Values are expressed as median (25th; 75th percentiles).
biochemical markers of bone turnover in patients with and without a history of fractures.
In patients, no relation was found at baseline be-tween BMD (LS and TB) and body composition (lean
body mass and percentage of body fat mass) and calcium intake, physical activity, age at diagnosis of ALL, or presence or absence of the intravenous meth-otrexate supplement. Male subjects showed lower LS
Fig 1. One-year change in TB BMD value and
percentage of body fat mass in 34 patients who were treated for ALL over the 2.2 to 3.2 years after completion of treatment and in 74 matched control subjects. Data are expressed as median (line), quartiles (box), and range. P values ⫽ patients versus control subjects.
TABLE 2. Absolute BMD and Body-Composition Values in Patients Who Were Treated for ALL During the 2.2 to 3.2 Years After
Completion of Treatment During a 1-Year Follow-up and in Healthy Age-, Gender-, and Pubertal Stage–Matched Control Subjects Baseline At 1-Year
Follow-up
Change Between Second and First Evaluation
Change Between Second and First Evaluation,P
BMD TB, g/cm2
Patients 0.843 (0.803; 0.917) 0.886 (0.827; 0.962) 0.034 (0023; 0044)* .005 Control subjects 0.872 (0.838; 0.956) 0.901 (0.858; 0.983) 0.025 (0014; 0031) .003 BMD LS, g/cm2
Patients 0.682 (0.629; 0.758)† 0.732 (0.671; 0.847) 0.039 (0022; 0074) .0003 Control subjects 0.720 (0.656; 0.817) 0.773 (0.685; 0.876) 0.034 (0006; 0053) ⬍10⫺4
BMAD LS, g/cm2
Patients 0.146 (0.131; 0.166) 0.149 (0.137; 0.169) 0.004 (⫺0002; 0008) .19 Control subjects 0.152 (0.137; 0.164) 0.153 (0.139; 0.168) 0.002 (⫺0004; 0008) .04 Lean body mass, g
Patients 18670 (16214; 26025) 22339 (18365; 28154) 1724 (1150; 2045) .07 Control subjects 21233 (17959; 26114) 23599 (19531; 27389) 1903 (1178; 2530) ⬍10⫺4
Percentage body fat
Patients 18.6 (13.3; 28.1)‡ 20.4 (15.8; 26.0) 0.01 (⫺0,01; 0,03) .2 Control subjects 17.0 (13.6; 21.0) 19.4 (15.8; 24.7) 0.02 (0,01; 0,04) ⬍10⫺4
Values are expressed as median (25th; 75th percentiles) *P⫽.01 patients versus control subjects.
†P⫽.04 patients versus control subjects. ‡P⫽.05 patients versus control subjects.
TABLE 3. BMD and Biochemical Markers of Bone Turnover in Patients With and Without a
History of Fractures
Patients With Fractures (n⫽8)
Patients Without Fractures (n⫽29) BMD TB, g/cm2 0.868 (0.825; 1.024) 0.836 (0.803; 0.91)
BMD LS, g/cm2 0.747 (0.64; 0.78) 0.68 (0.63; 0.75)
BMAD LS, g/cm2 0.156 (0.14; 0.17) 0.144 (0.132; 0.163)
areal BMD than female subjects (this was seen across all ages and pubertal stages;P⫽.001). However, this gender difference was not observed when apparent volumetric BMD of LS or TB BMD was analyzed.
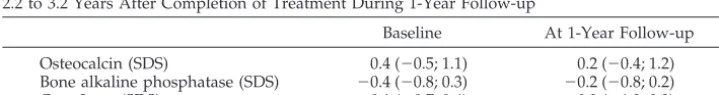
Bone Metabolism
Serum levels of calcium, phosphate, alkaline phos-phatase, 25 OHD, 1-25 OHD, and PTH were within the normal ranges in patients (Table 3). As shown in Table 4, serum osteocalcin, bone alkaline phospha-tase, and CrossLaps levels were normal at both base-line and 1-year follow-up evaluations.
DISCUSSION
In the present study, a slight decrease in TB BMD was found 2.2 years after completion of therapy of ALL in childhood. At that time, percentage of body fat mass was significantly higher and patients were physically less active than their matched control sub-jects. After a 1-year follow-up period, a significantly higher increase in TB BMD was observed in patients than in healthy age-, gender-, and pubertal stage– matched control subjects. Moreover, during this pe-riod, the increase of percentage of body fat mass was slighter lower in ALL patients as compared with control subjects. However, after 1 year of follow-up, BMD and body-composition parameters of ALL pa-tients and their physical activity were similar to those observed in matched control subjects. Serum markers of bone turnover were normal at both eval-uations for patients.
Previous longitudinal studies performed at diag-nosis and during treatment in childhood ALL have found normal7,8 or low9,10,12 LS BMD at diagnosis.
Recently, a reduced bone volume and trabecular thickness, especially in children younger than 10 years, was demonstrated by bone histomorphometry in children with newly diagnosed ALL.35 During
treatment and even without the use of cranial irra-diation as part of their treatment (prophylactic treat-ment of the central nervous system), a significant reduction in BMD was found in these patients in comparison with baseline values.6,7,9,11,12
There are several cross-sectional studies in which BMD status has been assessed in long-term survivors of childhood ALL. Studies on patients who were treated with cranial irradiation have shown signifi-cantly reduced BMD in TB as well as in LS, even⬎8 years after completion of treatment.16,18–22Defects in
the hypothalamic-pituitary axis leading to abnormal-ities in growth hormone and gonadotropin secretion are probable causes, leading to disturbed bone me-tabolism.36 The effect of chemotherapy alone on
BMD is much less clear; normal12,14,24,25 or reduced
BMD8,23 have been reported. After completion of
treatment with chemotherapy alone, no decrease in either areal or volumetric BMD for LS and TB was found 9.6 years (mean) after completion of treatment in 23 patients aged 17 years,24whereas a significant
decrease in volumetric LS BMD was demonstrated 5 years (mean) after completion of treatment in 28 patients aged 10.7 years.23As is the case in our study
(although only for areal BMD), this was associated with male gender and current level of physical ac-tivity.23 Male gender as a risk factor for decreased
BMD after completion of treatment was also shown in 2 other studies in which cranial irradiation was conducted.17,22 A gender difference of sensitivity to
cytotoxic gonadal damage and/or to glucocorticoids was hypothesized to be a probable explanation.23
As is the case for normal children,37–39 physical
activity level was also shown to be an important determinant of BMD and of body fat mass in these patients.23,40 Excessive overweight after childhood
ALL has been reported frequently.26,27 It has been
postulated that the increase in body fat mass was related to multifactorial causes such as cranial irra-diation (thus partly resulting from growth hormone insufficiency), to glucocorticoids (as part of treat-ment protocols), to increased energy intake and to the reduced energy expenditure resulting from de-creased physical activity.19,26,28,40–42 Only 2 studies
have investigated long-term body composition 5 to 9.6 years (mean) after completion of treatment with chemotherapy alone. A significantly higher percent-age of body fat mass was found after 5 years in only a subgroup of patients who received intravenous high-dose methotrexate.23,24 As is the case in our
study, the difference in BMI was not significant. However, our study demonstrated a significantly higher percentage of body fat mass in patients 2.2 years after completion of therapy that was not found later during the follow-up period.
Concern has also been expressed regarding the detrimental effects of methotrexate and glucocorti-coid on bone5,13,43as well as the harmful effects of
the disease process itself. At diagnosis, children with ALL have reduced bone alkaline phosphatase, insu-lin-like growth factor 1 (IGF-1) and IGF binding pro-tein 3 (IGFBP-3), all of which suggest low bone turn-over resulting from the disease.4,5,7,44–46 Bone
alkaline phosphatase remained low throughout the treatment with an increase of bone resorption mark-ers, probably as a result of the effects of methotrexate and corticosteroid treatment. These effects occurred independent of circulating IGF-1 and IGFBP-3, which were restored to normal values during treat-ment.4,5,7,43,44,46However, it has been seen in a small
TABLE 4. Serum Markers of Bone Formation (Osteocalcin and Bone Alkaline Phosphatase) and
Bone Resorption (CrossLaps) Expressed aszScores in Patients Who Were Treated for ALL During the 2.2 to 3.2 Years After Completion of Treatment During 1-Year Follow-up
study on a limited number of patients that bone alkaline phosphatase increased to normal levels dur-ing the first month after cessation of therapy.44In our
study, all serum markers of bone turnover were nor-mal after completion of treatment.
Moreover, no factors such as age at diagnosis of ALL, higher methotrexate dosage, calcium intake, or physical activity were identified as contributing to impairment of body composition and/or bone me-tabolism. Except for TB BMD measurements, no re-lationship was found between body-composition pa-rameters and follow-up time after completion of treatment. The number of patients who were inves-tigated in our study was small; however, this was compensated for by the fact that the study popula-tion was very homogeneous regarding malignancy (only 2 patients in a high-risk group) and treatment schedule.
In conclusion, a significant increase in TB BMD and a tendency to a lesser increase in percentage of body fat mass were seen during the study period in patients as compared with control subjects who were matched for chronological age, gender, and pubertal stage. Moreover, as seen after a 1-year follow-up period, body composition, biochemical markers of bone turnover, and physical activity all recovered to normal levels at 3.2 years (median) after the end of treatment. These findings were seen across ages and independent of gender and pubertal status, suggest-ing a positive effect of long-term completion therapy as well as increase in physical activity on BMD, body composition, and bone metabolism in patients who have been treated for ALL.
ACKNOWLEDGMENTS
We thank Isabelle Legendre and Didier Chevenne for help with statistical analysis and biochemical evaluation, respectively, and the nurses of the Clinical Investigation Center at the Robert Debre hospital for excellent technical assistance.
REFERENCES
1. Vilmer E, Suciu F, Ferster A, et al. Long term results of three random-ized trials (58831, 58832, 58881) in childhood acute lymphoblastic leukemia: a CLCG-EORTC report.Leukaemia.2000;14:2257–2266 2. Pui CH, Cheng C, Leung W Rai, et al. Extended follow-up of long term
survivors of childhood acute lymphoblastic leukaemia.N Engl J Med. 2003;14:640 – 649
3. Halton JM, Atkinson SA, Fraher L, et al. Mineral homeostasis and bone mass at diagnosis in children with acute lymphoblastic leukemia.J Pe-diatr.1995;126:557–564
4. Sorva R, Kivivuori SM, Tufpeinen M, et al. Very low rate of type l collagen synthesis and degradation in newly diagnosed children with acute lymphoblastic leukemia.Bone.1997;20:39 – 43
5. Crofton PM, Ahmed SF, Wade JC, et al. Effects of intensive chemother-apy on bone and collagen turnover and the growth hormone axis in children with acute lymphoblastic leukemia.J Clin Endocrinol Metab. 1998;83:3121–3129
6. Atkinson SA, Halton JM, Bradley C, Wu B, Barr RD. Bone and mineral abnormalities in childhood acute lymphoblastic leukaemia: influence of disease, drugs and nutrition.Int J Cancer.1998;11:35–39
7. Arikoski P, Komulainen J, Riikonen P, Voutilainen R, Knip M, Kroger H. Alterations in bone turnover and impaired development of bone mineral density in newly diagnosed children with cancer: a year pro-spective study.J Clin Endocrinol Metab.1999;84:3174 –3181
8. Arikoski P, Komulainen J, Riikonen P, et al. Impaired development of bone mineral density during chemotherapy: a prospective analysis of 46 children newly diagnosed with cancer. J Bone Miner Res. 1999;14: 2002–2009
9. Boot AM, van den Heuvel-Eibrink MM, Hahlen K, Krenning EP, de Muinck Keizer-Schrama SM. Bone mineral density in children with acute lymphoblastic leukaemia.Eur J Cancer.1999;35:1693–1697 10. Van der Sluis IM, van den Heuvel-Eibrink MM, Hahlen K, Krenning EP,
de Muinck Keizer-Schrama SM. Altered bone mineral density and body composition, and increased fracture risk in childhood acute lympho-blastic leukaemia.J Pediatr.2002;141:204 –210
11. Halton JM, Atkinson SA, Fraher L, et al. Altered mineral metabolism and bone mass in children during treatment for acute lymphoblastic leukaemia.J Bone Miner Res.1996;11:1774 –1783
12. Henderson RC, Madsen CD, Davis C, Gold SH. Longitudinal evaluation of bone mineral density in children receiving chemotherapy.J Pediatr Hematol Oncol.1998;20:322–326
13. Manolagas SC, Weinstein RS. New developments in the pathogenesis and treatment of steroid-induced osteoporosis.J Bone Miner Res.1999; 14:1061–1066
14. Gilsanz V, Carlson ME, Roe TF, Ortega JA. Osteoporosis after cranial irradiation for acute lymphoblastic leukaemia. J Pediatr. 1990;117: 238 –244
15. Henderson RC, Madsen CD, Davis C, Gold SH. Bone density in survi-vors of childhood malignancies.J Pediatr Hematol Oncol.1996;18:367–371 16. Brennan BMD, Rahim A, Adams JA, Eden OB, Shalet SM. Reduced bone mineral density in young adults following cure of acute lymphoblastic leukaemia in childhood.Br J Cancer.1999;79:1859 –1863
17. Arikoski P, Komulainen J, Vouti1ainen R, et al. Reduced bone mineral density in long-term survivors of childhood acute lymphoblastic leuke-mia.J Pediatr Hematol Oncol.1998;20:234 –240
18. Hesseling PB, Hough SF, Nel ED, van Riet FA, Beneke T, Wessels G. Bone mineral density in long-term survivors of childhood cancer.Int J Cancer.1998;11:44 – 47
19. Nysom K, Holm K, Michaelsen KF, Hertz H, Muller J, Molgaard C. Bone mass after treatment for acute lymphoblastic leukaemia in childhood. J Clin Oncol.1998;16:3752–3760
20. Hoorweg-Nijman JJ, Kardos G, Roos JC, et al. Bone mineral density and markers of bone turnover in young adult survivors of childhood lym-phoblastic leukaemia.Clin Endocrinol.1999;50:237–244
21. Warner JT, Evans WD, Webb DKH. Relative osteopenia after treatment for acute lymphoblastic leukemia.Pediatr Res.1999;45:544 –551 22. Kaste SC, Jones-Wallace D, Rose SR, et al. Bone mineral decrements in
survivors of childhood acute lymphoblastic leukemia: frequency of occurrence and risk factors for their development.Leukemia.2001;15: 728 –734
23. Tillmann V, Darlington AS, Eiser C, Bishop NJ, Davies HA. Male sex and low physical activity are associated with reduced spine bone min-eral density in survivors of childhood acute lymphoblastic leukemia. J Bone Miner Res.2002;17:1073–1080
24. Van der Sluis IM, van den Heuvel-Eibrink MM, Hahlen K, Krenning EP, de Muinck Keizer-Schrama SM. Bone mineral density, body composi-tion, and height in long-term survivors of acute lymphoblastic leukemia in childhood.Med Pediatr Oncol.2000;35:415– 420
25. Kadan-Lottick N, Marshall JA, Baron AE. Normal bone mineral density after treatment for childhood acute lymphoblastic leukaemia diagnosed between 1991 and 1998.J Pediatr.2002;138:898 –904
26. Nysom K, Holm K, Michaelsen KF, Hertz H, Muller J, Molgaard C. Degree of fatness after treatment for acute lymphoblastic leukaemia in childhood.J Clin Endocrinol Metab.1999;84:4591– 4596
27. Mayer EIE, Reuter M, Dopfer RE, Ranke MB. Energy expenditure, energy intake and prevalence of obesity after therapy for acute lym-phoblastic leukemia during childhood.Horm Res.2000;53:193–199 28. Van Dongen-Melman JEWM, Hokken-Koelega ACS, Ha¨hlen K, De
Groot A, Tromp CG, Egeler RM. Obesity after successful treatment of acute lymphoblastic leukemia in childhood.Pediatr Res.1995;38:86 –90 29. Sempe´ M, Pedron G, Roy-Pernot MP.Auxologie, Me´thodes et Se´quences.
Paris, France: The´raplix; 1979
30. Rolland-Cachera MF, Cole TJ, Sempe´ M, Tichet J, Rossignol C, Charraud A. Body mass index variations: centiles from birth to 87 years.Eur J Clin Nutr.1991;45:13–21
31. Tanner JM.Growth at Adolescence. Oxford, United Kingdom: Blackwell; 1978:28 –39
32. Greulich WW, Pyle SI.Radiographic Atlas of Skeletal Development of the Hand and the Wrist. 2nd ed. Stanford, CA: Stanford University Press; 1959
33. Tricopoulou A, Vassilakou T. Recommended dietary intakes in the European Community member states: an overview.Eur J Clin Nutr. 1990;44:51–125
35. Leeuw JA, Koudstaal J, Wiersema-Buist J, Kamps WA, Timens W. Bone histomorphometry in children with newly diagnosed acute lympho-blastic leukemia.Pediatr Res.2003;54:814 – 818
36. Arikoski P, Voutilainen R, Kroger H. Bone mineral density in long-term survivors of childhood cancer. J Pediatr Endocrinol Metab. 2003;16: 343–353
37. Ruiz JC, Mandel C, Garabedian M. Influence of spontaneous calcium intake and physical exercise on the vertebral and femoral bone mineral density of children and adolescent.J Bone Miner Res.1995;1:675– 681 38. Cooper C, Cawley M, Bhalla A, et al. Childhood growth, physical
activity, and peak bone mass in women.J Bone Miner Res.1995;10: 940 –947
39. Rubin K, Schirduan V, Gendreau P, Sarfarazi M, Mendola R, Dalsky G. Predictors of axial and peripheral bone mineral density in healthy children and adolescents, with special attention to the role of puberty. J Pediatr.1993;123:863– 870
40. Warner JT, Bell W, Webb DKH. Daily energy expenditure and physical activity in survivors of childhood malignancy.Pediatr Res. 1998;43: 607– 613
41. Warner JT, Bell W, Webb DKH, Gregory JW. Relationship between
cardiopulmonary response to exercise and adiposity in survivors of childhood malignancy.Arch Dis Child.1997;76:298 –303
42. Reilly JJ, Brougham M, Montgomery C, Richardson F, Kelly A, Gibson BES. Effect of glucocorticoid therapy on energy intake in children treated for acute lymphoblastic leukemia.J Clin Endocrinol Metab.2001; 86:3742–3745
43. Wheeler DL, Vander Griend RA, Wronski TJ, Miller GJ, Keith EE, Graves JE. The short and long term effects of methotrexate on the rat skeleton.Bone.1995;16:215–221
44. Crofton PM, Ahmed SF, Wade JC, et al. Bone turnover and growth during and after continuing chemotherapy in children with acute lym-phoblastic leukaemia.Pediatr Res.2000;48:490 – 496
45. Mohnike KL, Kuble U, Mittler U. Serum levels of insulin-like growth factor-I, -II and insulin-like growth factor binding proteins 2 and 3 in children with acute lymphoblastic leukaemia.Eur J Pediatr.1996;155: 81– 86
DOI: 10.1542/peds.2004-1838
2005;116;e102
Pediatrics
Noel, Paul Czernichow, Guy Sebag, Etienne Vilmer and Juliane Léger
Daniela Marinovic, Sophie Dorgeret, Brigitte Lescoeur, Corinne Alberti, Michèle
Childhood Acute Lymphoblastic Leukemia: A 1-Year Prospective Study
Improvement in Bone Mineral Density and Body Composition in Survivors of
Services
Updated Information &
http://pediatrics.aappublications.org/content/116/1/e102
including high resolution figures, can be found at:
References
http://pediatrics.aappublications.org/content/116/1/e102#BIBL
This article cites 43 articles, 2 of which you can access for free at:
Subspecialty Collections
skeletal_disorders_sub
http://www.aappublications.org/cgi/collection/rheumatology:musculo
Rheumatology/Musculoskeletal Disorders following collection(s):
This article, along with others on similar topics, appears in the
Permissions & Licensing
http://www.aappublications.org/site/misc/Permissions.xhtml
in its entirety can be found online at:
Information about reproducing this article in parts (figures, tables) or
Reprints
http://www.aappublications.org/site/misc/reprints.xhtml
DOI: 10.1542/peds.2004-1838
2005;116;e102
Pediatrics
Noel, Paul Czernichow, Guy Sebag, Etienne Vilmer and Juliane Léger
Daniela Marinovic, Sophie Dorgeret, Brigitte Lescoeur, Corinne Alberti, Michèle
Childhood Acute Lymphoblastic Leukemia: A 1-Year Prospective Study
Improvement in Bone Mineral Density and Body Composition in Survivors of
http://pediatrics.aappublications.org/content/116/1/e102
located on the World Wide Web at:
The online version of this article, along with updated information and services, is
by the American Academy of Pediatrics. All rights reserved. Print ISSN: 1073-0397.