Very Preterm Birth: A Validation Study
WHAT’S KNOWN ON THIS SUBJECT: Two UK models predict the risk of mortality in very preterm Western infants (1) alive at onset of labor and (2) admitted for neonatal intensive care. Prognostic models need temporal and geographic validation to evaluate their performance.
WHAT THIS STUDY ADDS: The 2 models showed very good performance in a recent large cohort of very preterm infants born in another Western country. The accurate performance of both models suggests application in clinical practice
abstract
OBJECTIVES:To validate externally 2 prognostic models for stillbirth and neonatal death in very preterm infants who are either known to be alive at the onset of labor or admitted for neonatal intensive care.
PATIENTS AND METHODS: All infants, with gestational age 22 to 32 weeks, of European ethnicity, known to be alive at the onset of labor (n= 17 582) and admitted for neonatal intensive care (n= 11 578), who were born in the Netherlands between January 1, 2000, and December 31, 2007. The main outcome measures were stillbirth or death within 28 days for infants known to be alive at the onset of labor and death before discharge from the NICU for infants admitted for intensive care. Model performance was studied with calibration plots andcstatistic.
RESULTS:Of the infants known to be alive at the onset of labor, 16.7% (n= 2939) died during labor or within 28 days of birth, and 7.8% (n= 908) of the infants admitted for neonatal intensive care died before discharge from intensive care. The prognostic model for infants known to be alive at the onset of labor showed good calibration and excellent discrimination (c statistic 0.92). The prognostic model for infants admitted for neonatal intensive care showed good calibra-tion and good discriminacalibra-tion (cstatistic 0.82).
CONCLUSIONS: The 2 prognostic models for stillbirth and neonatal death in very preterm Dutch infants showed good performance, sug-gesting their use in clinical practice in the Netherlands and possibly other Western countries.Pediatrics2012;129:e120–e127
AUTHORS:Ewoud Schuit, MSc,aChantal W.P.M.
Hukkelhoven, PhD,bBradley N. Manktelow, PhD,c
Dimitri N.M. Papatsonis, PhD,dMartin J.K. de Kleine, PhD,e
Elizabeth S. Draper, PhD,cEwout W. Steyerberg, PhD,aand
Yvonne Vergouwe, PhDa
aCentre for Medical Decision Sciences, Department of Public
Health, Erasmus MC, Rotterdam, The Netherlands;bThe
Netherlands Perinatal Registry, Utrecht, The Netherlands;
cDepartment of Health Sciences, University of Leicester, Leicester,
United Kingdom;dDepartment of Obstetrics and Gynaecology,
Amphia Hospital, Breda, The Netherlands;eDepartment of
Neonatology, Máxima Medical Centre, Eindhoven, The Netherlands
KEY WORDS
neonatal death, stillbirth, external validation, prognostic model, very preterm birth
Drs Hukkelhoven, Vergouwe and Steyerberg initiated and coordinated the study. All validation analyses were performed by Mr Schuit in collaboration with Drs Hukkelhoven and Vergouwe. Details of the former Trent development cohort were provided by Dr Manktelow. Mr Schuit wrote the article under supervision of Drs Hukkelhoven and Vergouwe. Drs Manktelow, Paptsonis, de Kleine, Draper, and Steyerberg made significant contributions to the manuscript at different stages and from different perspectives.
www.pediatrics.org/cgi/doi/10.1542/peds.2011-0803 doi:10.1542/peds.2011-0803
Accepted for publication Sep 14, 2011
Address correspondence to Chantal W.P.M. Hukkelhoven, PhD., The Netherlands Perinatal Registry, Mercatorlaan 1200, PO Box 8588, 3503 RN Utrecht, The Netherlands. E-mail:
chukkelhoven@perinatreg.nl
PEDIATRICS (ISSN Numbers: Print, 0031-4005; Online, 1098-4275). Copyright © 2012 by the American Academy of Pediatrics
In most developed countries, very pre-term birth has an incidence of 1% to 2%1 but accounts for approximately one third to half of all perinatal deaths.2,3 Accurate risk assessment of perinatal death can help caregivers and parents to decide whether and when to intervene in a pregnancy or to adjust postnatal care.
Two easy-to-apply survival graphs are used in clinical practice for discussions with parents for whom premature de-livery is likely.2,4,5 These graphs are derived from prognostic models that predict survival for very preterm infants known to be alive at the onset of labor and very preterm infants admitted for neonatal intensive care. Risk factors in the models include readily available variables such as gestational age, birth weight, gender, ethnicity, and multiplic-ity of pregnancy.4The graphs werefirst published in 1999 comprising births between 1994 and 1997 for the former Trent (United Kingdom) health region. An update of the graphs was published to include births between 1998 and 2001.5Although developed for a UK pop-ulation, the models may also be useful in other Western countries to estimate the effect of new interventions, develop treatment protocols, and counsel in-dividual parents, as they are widely used in the UK.2Because local and timely var-iation in attitudes toward the care of very preterm infants can influence the validity of the models, we studied the external validity in infants born in thefirst decade of the 21st century in the Netherlands.
METHODS
Study Population
We studied the Netherlands, which in 2010 comprised more than 16 million people and about 180 000 births a year. Similar to the study by Draper et al,4 we included all infants alive at the on-set of labor and born between January 1, 2000, and December 31, 2007, with European ethnicity and gestational age
between 22 and 32 weeks to validate the model that predicts fetal death or neonatal death within 28 days. A subgroup of these infants, including only the infants who were admitted to a NICU, was used to validate the model that predicts death before discharge from the NICU. Within the Dutch study population, we made a distinction be-tween congenital malformations that were definitely not lethal, probably lethal, and definitely lethal. Similar to the study by Draper et al,4infants with (probably) lethal congenital malfor-mations were excluded from the study.
Data on births were extracted from the Netherlands Perinatal Registry, which is a linked database of medical registries from 3 professional organizations: the national midwives registry, the national obstetricians registry, and the national pediatricians/neonatologists registry. The database contains 95% of all women who gave birth and 100% of the new-borns who were admitted to an NICU after birth, resulting in high-quality data on all births.6We used data on the ma-ternal age at childbirth, multiplicity of the pregnancy, the infants’gender, ges-tational age as calculated from ultra-sound measures (93%) or from the date of last menstrual period (7%), birth weight as determined by weighing, 5-minute Apgar score as reported by the obstetrician, and whether the infant was admitted for neonatal intensive care.
Outcomes
Death of infants known to be alive at the onset of labor was defined as fetal death or neonatal death within 28 days of birth. Death of infants admitted to an NICU was defined as death before discharge.
Prognostic Models
We evaluated the ability of the updated logistic regression models5(Appendix) developed on infants from the former Trent region (development population)
to predict (1) fetal death or neonatal death within 28 days of birth and (2) neonatal death before discharge from an NICU in European infants in the Dutch population (validation population). The model for infants known to be alive at the onset of labor included multiplicity of pregnancy, gestational age, and birth weight. The model for infants admitted to an NICU included fetal gender as an additional variable. Birth weight was included in both models as the differ-ence between the observed birth weight and the mean birth weight of infants with the same gestational age and eth-nicity (Appendix).
STATISTICAL ANALYSIS
Missing values were imputed once with single imputation,7because only a small percentage of data were missing (0.3%). Baseline characteristics of the valida-tion and development populavalida-tion were analyzed using descriptive statistics and presented as mean with SD for continuous variables and as numbers and percentages of the whole popula-tion for categorical and dichotomous variables.
operating characteristic curve.11
RESULTS
Between January 1, 2000, and Decem-ber 31, 2007, 22 827 infants with a ges-tational age of 22 to 32 weeks were known to be alive at the onset of labor. We excluded 1449 infants with severe or lethal malformations and 3796 in-fants without European ethnicity (ie, Mediterranean, African, Hindu, Asian), resulting in 17 582 infants. Of those, 2939 (16.7%) died during labor or within 28 days after birth. For the model to predict neonatal death before dis-charge from a NICU, we excluded 6004 (34.1%) infants who were not admit-ted to a NICU. The second model was validated using 11 578 very preterm infants with European ethnicity who were admitted to a NICU; 908 (7.8%) died before discharge.
Characteristics of the Infants
The characteristics of the Dutch infants are shown in Tables 1 and 2 next to the infants of the former Trent region. The characteristics of the Dutch infants were generally similar to the charac-teristics of the infants from the former Trent region, in which the models were developed. The number of mothers who gave birth at an age under 20 was, however, lower in the Netherlands com-pared with the former Trent region (2% vs 12%). Furthermore, the proportion of preterm infants who were admitted to an NICU was lower in the Netherlands compared with the former Trent region (66% vs 95%).
No difference was found between the infants who died in both validation groups for the characteristics fetal gen-der, plurality of pregnancy, and mother’s age (Table 3). Differences were found for gestational age and birth weight, with neonatal deaths in an NICU being more frequent in older (2.4 weeks) and heavier
(231 g) infants compared with still-births and neonatal deaths among in-fants known to be alive at the onset of labor. The same differences were found for infants in the former Trent region, although they were less pronounced (gestational age and birth weight dif-fered by 0.7 weeks and 60 g, respec-tively; data not shown).
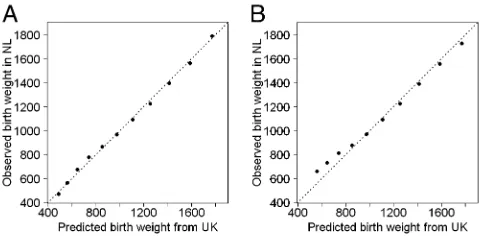
Mean Birth Weight per Gestational Age
As mentioned in the methods section, the birth weight was included in both
models as the difference between the observed birth weight and the mean birth weight of infants with the same gestational age and ethnicity (Appen-dix). Figure 1 shows that the mean birth weight for each gestational age was sim-ilar in the Dutch infants and the infants from the former Trent region. The mean birth weights were much the same for the infants known to be alive at the on-set of labor (Fig 1A). The mean birth weights of the Dutch infants admitted to neonatal intensive care were slightly higher than the mean birth weights
Characteristic Dutch validation cohort Trent development cohorta
2000–2007 (n = 17 582)
1998–2001 (n = 3793)
n % n %
Gender
Female 7716 43.9 1771 46.7 Male 9833 55.9 2014 53.1
Missing 33 0.2 8 0.2
Gestational age, wk
22–23 1222 7.0 172 4.5 24–27 2927 16.6 817 21.5 28–32 13 433 76.4 2804 73.9 Mean, SD 29.3 2.8 29.1 2.7 Birth wt, g
0–499 563 3.2 81 2.1
500–999 4116 23.4 989 26.1 1000–1499 5803 33.0 1272 33.5 1500–1999 5434 30.9 1189 31.3 2000–2499 1561 8.9 237 6.2
2500+ 68 0.4 25 0.7
Mean, SD 1342 489.0 1319 469.0
Missing 37 0.2 0 0.0
NICU admission
Yes 11 578 65.9 3585 94.5
No 6004 34.1 208 5.5
Plurality
Singleton 11 814 67.2 2811 74.1 Multiple 5768 32.8 981 25.9
Missing 0 0.0 1 0.0
Age mother, years
,20 343 2.0 437 11.5
20–25 2410 13.7 697 18.4 26–30 6061 34.5 1077 28.4 31–35 6269 35.7 967 25.5
36+ 2498 14.2 593 15.6
Mean, SD 30.4 4.9 28.0 6.2
Missing 1 0.0 22 0.6
Outcome
Dead 2939 16.7 590 15.6 Alive 14 643 83.3 3203 84.4
of the UK infants for infants with ges-tational age from 23 to 25 weeks (Fig 1B).
Performance of the Prognostic Models
Predicted risks of stillbirth or neonatal death were in agreement with the ob-served proportions of death for infants known to be alive at the onset of labor as indicated by the solid line in relation to the dashed 45-degree line, which
indicates perfect calibration (ie, pre-dicted risk is equal to observed pro-portion) in Fig 2A. Very high predicted death risks were slightly too low (eg, a predicted death risk of 80% corre-sponds to an observed proportion of deaths of 90%). Nevertheless, the mean predicted death risk and overall ob-served proportion of deaths was similar (16% vs 17%, respectively), as also in-dicated by a calibration-in-the-large (a|b= 1) of 0.09. The calibration slope
bwas 1.11. The discriminative ability of the model was excellent, with ac sta-tistic of 0.92 and a difference of 0.85 between the means of the highest (0.85) and lowest (0.0) predicted risk deciles.
For the infants admitted to neonatal intensive care, predicted death risks showed good agreement with the ob-served proportions of neonatal deaths (Fig 2B). The mean predicted death risk and overall observed proportion of neo-natal deaths was equal (8% vs 8%, re-spectively). Thisfinding was confirmed by a value close to 0 fora|b=1 (0.11); the calibration slope was 0.86. The dis-crimination of the model was good (c statistic = 0.82).
DISCUSSION
Principal Findings
In this external validation study, we assessed the performance of 2 prog-nostic models predicting stillbirth and neonatal death for very preterm infants (1) known to be alive at the onset of labor or (2) admitted for neonatal intensive care. The models that were developed in the UK at the end of the 1990s were found to be valid in a large cohort of 17 000 Dutch infants born between 2000 and 2007.
The model for very preterm infants known to be alive at the onset of labor showed remarkably good external val-idity with good calibration and excellent ability to discriminate between infants who died and infants who survived. The cstatistic was similar as found by in-ternal validation (0.92 vs 0.91).
The model for very preterm infants admitted to an NICU was well calibrated, and the discriminative ability of the model was good. Discrimination of this model was lower than that seen for the internal validation (cstatistic 0.82 vs 0.89). The lower discrimination for the NICU model is reflected in the calibra-tion plots with the highest decile of predicted risk around 40% (Fig 2B)
TABLE 2 Characteristics of Very Preterm Infants Admitted to an NICU in the Dutch and Trent Cohorts
Characteristic Dutch validation cohort Trent development cohorta
2000–2007 (n = 11 578) 1998–2001 (n = 3585)
n % n %
Gender
Female 5027 43.5 1673 46.8 Male 6541 56.5 1905 53.2
Missing 10 0.0 7 0.2
Gestational age, wk
22–23 9 0.1 53 1.5
24–27 2008 17.3 748 20.9 28–32 9561 82.6 2784 77.7 Mean, SD 29.6 2.0 29.4 2.4 Birth wt, g
0–499 40 0.3 26 0.7
500–999 2503 21.6 858 23.9 1000–1499 4850 41.9 1256 35.0 1500–1999 3450 29.8 1186 33.1 2000–2499 707 6.1 235 6.6
2500+ 22 0.2 24 0.7
Mean, SD 1347 407.0 1357 448.0
Missing 6 0.0 0 0.0
Apgar score after 5 min
0–3 313 2.7 83 2.3
4–6 1225 10.6 284 7.9 7–10 9744 84.2 3021 84.3 Missing 296 2.6 197 5.5 Plurality
Singleton 7889 68.1 2647 73.9 Multiple 3689 31.9 937 26.1
Missing 0 0.0 1 0.0
Mother’s age, y
,20 225 1.9 409 11.5
20–25 1616 14.0 646 18.1 26–30 3998 34.5 1013 28.4 31–35 4089 35.3 931 26.1
36+ 1650 14.3 564 15.8
Mean, SD 30.4 4.9 28 6.2
Missing 0 0.0 22 0.6
Outcome
Dead 908 7.8 382 10.7
Alive 10 670 92.2 3203 89.3
aInfants of European ethnicity only.
compared with 80% for those alive at the onset of labor (Fig 2A). Very high predicted risks were rare for the NICU model. However, the overall observed proportions of deaths were similar to the mean predicted risks for both mod-els, indicating that the models estimate the risk of death for Dutch infants ac-curately.
The relatively low proportion of Dutch infants who were admitted for neonatal care (66% in the Netherlands vs 95% in the Trent region) results from a differ-ence in policy for admitting extremely preterm infants (28 weeks’ gestation or less) to an NICU. The Dutch policy is conservative compared with other countries,3,12–14 and the former Trent policy is more liberal.15–17During the
years 2000 to 2007, Dutch infants were admitted to an NICU if their gestational age was at least 25 weeks or if they were thought to have a reasonable chance of survival. In the United King-dom, almost all infants are admitted for neonatal intensive care. As a con-sequence, the extremely preterm infants admitted to an NICU in the Netherlands had a higher weight for their gestational age (Fig 1) and were in a better condition. This may explain the lower unadjusted mortality in ad-mitted infants in the Netherlands compared with Trent (8 vs 11%). Therefore, the influence on the model performance of the higher weight for infants with low gestational age in the Netherlands compared with Trent was
of the Trent infants was substituted with the mean birth weight of the Dutch infants. The results showed similar cal-ibration and discrimination, indicating that the difference in birth weight did not influence the performance of the models.
Implications of the Study
Information on the risk of perinatal death of very preterm infants can be of great value for translating the effect of new interventions, develop-ing of treatment protocols, counsel-ing parents, and adjustcounsel-ing individual treatment.
The prognostic models may be useful in clinical research to identify infants at high or low risk for an intervention under study.18Furthermore, risk mod-els can be used for risk adjustment in studies of hospitals comparisons;2,18 one such example is the Clinical Risk Index for Babies—II score, which was based on the Trent model for infants admitted for neonatal care.19
All the characteristics used in both models are familiar to caregivers and are known to influence the outcome of the newborn. The advantage of using the prognostic models is that the char-acteristics are combined in a more for-mal way, allowing for more accurate mortality risk estimation.
In the United Kingdom, the models are widely used for counseling parents when a very preterm birth is antici-pated.2 If the models are used for counseling or guiding individual infant management (eg, the obstetricians’ decision of whether to perform a cae-sarean delivery, to transfer a patient to a tertiary center with neonatal in-tensive care facilities, or to postpone birth; the neonatologists’judgment to withdraw or intensify care), it is im-portant to emphasize that the prog-nostic models may only complement
onset of labor intensive care (n = 2939) (n = 908)
n % n %
Gender
Female 1237 42.1 337 37.1 Male 1685 57.3 570 62.8
Missing 17 0.6 1 0.1
Gestational age, wk
22–23 1216 41.4 9 1.0 24–27 1189 40.5 516 56.8 28–32 534 18.2 383 42.2 Mean, SD 24.9 2.7 27.3 2.1 Birth wt, g
0–499 534 18.2 19 2.1 500–999 1881 64.0 543 59.8 1000–1499 359 12.2 265 29.2 1500–1999 113 3.8 64 7.0 2000–2499 29 1.0 15 1.7
2500+ 4 0.1 2 0.2
Mean, SD 746 349.0 977 346.0
Missing 19 0.6 0 0.0
NICU admission
Yes 782 26.6 908 100.0
No 2157 73.4 0 0.0
Plurality
Singleton 2159 73.5 649 71.5 Multiple 780 26.5 259 28.5 Age mother, years
,20 72 2.4 21 2.3
20–25 399 13.6 126 13.9 26–30 947 32.2 303 33.4 31–35 1041 35.4 322 35.5
36+ 480 16.3 136 15.0
clinical decision making rather than replace clinical judgment.
Strengths and Weaknesses
We used a well-described, large, na-tionwide and heterogeneous cohort of infants from the Netherlands to validate the prognostic models. Data collection was standardized to ensure high quality. The Dutch cohort includes both con-temporaneous data (2000–2001) and more recent data (2002–2007) than the development cohort, allowing for tem-poral and geographic validation.20
The prognostic models include a small number of readily available characteris-tics, which makes them easily applicable in daily clinical practice. Previously de-veloped scoring systems for neonates,
such as the Clinical Risk Index for Babies,21 Score for Neonatal Acute Physiology,22 Neonatal Therapeutic In-tervention Scoring System,23and varia-tions on these scores,19,24incorporate characteristics that are not consis-tently available (eg, base excess) or variables, which can themselves be influenced by the caregiver (eg, Apgar score) or actual care provision (eg, fraction of inspired oxygen).18,19
Our study has some limitations. The primary outcome for all infants alive at the onset of labor was defined as stillbirth and death within 28 days of birth as opposed to death before dis-charge as in the Trent data. In the Netherlands perinatal registry, death before discharge was only available for
those infants who were admitted to an NICU. From these infants, it was calcu-lated that within the children admitted to an NICU, 15% died after 28 days of life. Because infants not admitted to an NICU are generally in a better condition than infants admitted for neonatal care and are therefore unlikely to die after 28 days of life, we expect little influence of the difference in definition.
The risk factors in the model were as-sessed at birth. However, the model for infants known to be alive at the onset of labor was developed for the prediction of our primary outcome before labor. Because ultrasound is reliable in as-sessing multiplicity of the pregnancy be-fore labor, any bias in the estimated model performance is expected to be low.
The ultrasound-to-delivery interval25 and the large intra- and interobserver variability26 can compromise the ac-curacy of estimated fetal weight used in the model for infants known to be alive at the onset of labor. In low birth weight infants, the actual birth weight is progressively overestimated with decreasing birth weight, although the difference is not statistically signifi -cant.25,26Because the interval between ultrasound measurement and delivery can vary widely and the actual birth weight is underestimated more with in-creasing interval length,25thereby over-estimating the probability of stillbirth or neonatal death, we expect that model performance could be influenced.
The 2 models were originally developed for infants from both European and Asian origin. Asian origin was defined as mothers originating from the Indian subcontinent.4 Because only a small part of our potential validation pop-ulation had an Asian ethnicity and there was no subclassification of the Asian origin in the medical registries of the 3 professional organizations, we vali-dated the models on infants of European origin only.
FIGURE 1
Calibration plot of the observed mean birth weight per gestational age by the predicted mean birth weight for the infants known to be alive at the onset of labor (A) and infants admitted to neonatal intensive care (B). The line of identity indicates perfect agreement between predicted and observed means. The gestational age increases from left to right from 22 to 32 weeks. Note that infants with a gestational age of 22 weeks were not admitted to neonatal intensive care in the Netherlands.
FIGURE 2
Observed risk of stillbirth and neonatal death by predicted risk for infants known to be alive at the onset of labor (A) and infants admitted to neonatal intensive care (B), respectively. The dots indicate deciles with confidence intervals of infants with similar predicted risk.
We found that 2 prognostic models predicting stillbirth and neonatal death in very preterm infants alive at the onset of labor and very preterm infants admitted to neonatal intensive care showed good temporal and geographic
labor as well as at the admittance to an NICU was accurate, implying that the models and the accompanying graphs can be used for clinical practice in the Netherlands and probably in other Western countries as well.
pediatricians, nurses, and residents who routinely collect perinatal data for the Netherlands Perinatal Register. We also thank Professor Ben Willem Mol and Dr Anneke Kwee for their useful com-ments on earlier drafts of this article.
REFERENCES
1. Tucker J, McGuire W. Epidemiology of pre-term birth.BMJ. 2004;329(7467):675–678
2. Dorling JS, Field DJ. Value and validity of neonatal disease severity scoring systems. Arch Dis Child Fetal Neonatal Ed. 2008;93 (2):F80–F82
3. Zeitlin J, Draper ES, Kollée L, et al; MOSAIC research group. Differences in rates and short-term outcome of live births before 32 weeks of gestation in Europe in 2003: results from the MOSAIC cohort.Pediatrics. 2008;121(4):e936–e944
4. Draper ES, Manktelow B, Field DJ, James D. Prediction of survival for preterm births by weight and gestational age: retrospective population based study. BMJ. 1999;319 (7217):1093–1097
5. Draper ES, Manktelow B, Field DJ, James D. Tables for predicting survival for preterm births are updated. BMJ. 2003;327(7419): 872
6. Stichting Perinatale Registratie Nederland. Perinatale Zorg in Nederland 2008. Utrecht: Stichting Perinatale Registratie Nederland; 2011
7. Donders AR, van der Heijden GJ, Stijnen T, Moons KG. Review: a gentle introduction to imputation of missing values. J Clin Epi-demiol. 2006;59(10):1087–1091
8. Cox DR. Two further applications of a model for binary regression.Biometrika. 1958;45(3–4):562–565
9. Harrell FE.Regression Modeling Strategies: With applications to Linear Models, Logistic Regression, and Survival Analysis. New York: Springer; 2001
10. Steyerberg EW.Clinical Prediction Models: A practical approach to development, vali-dation, and updating. New York: Springer; 2009
11. Harrell FE, Jr,Lee KL, Califf RM, Pryor DB, Rosati RA. Regression modelling strategies for improved prognostic prediction. Stat Med. 1984;3(2):143–152
12. Draper ES, Zeitlin J, Fenton AC, et al; MO-SAIC research group. Investigating the variations in survival rates for very pre-term infants in 10 European regions: the MOSAIC birth cohort.Arch Dis Child Fetal Neonatal Ed. 2009;94(3):F158–F163
13. Gerrits-Kuiper JA, de HR, Bouwers HA, Visser GH, den Ouden AL, Kollee LA. At the limits of viability: Dutch referral policy for premature birth too reserved[in Dutch]. Ned Tijdschr Geneeskd. 2008;152(7):383–388
14. Kollée LA, Cuttini M, Delmas D, et al; MOSAIC Research group. Obstetric interventions for babies born before 28 weeks of gestation in Europe: results of the MOSAIC study. BJOG. 2009;116(11):1481–1491
15. Draper ES, Zeitlin J, Field DJ, Manktelow BN, Truffert P. Mortality patterns among very preterm babies: a comparative analysis of two European regions in France and Eng-land.Arch Dis Child Fetal Neonatal Ed. 2007; 92(5):F356–F360
16. Field D, Petersen S, Clarke M, Draper ES. Extreme prematurity in the UK and Den-mark: population differences in viability. Arch Dis Child Fetal Neonatal Ed. 2002;87 (3):F172–F175
17. Field D, Bajuk B, Manktelow BN, et al. Geo-graphically based investigation of the in-fluence of very-preterm births on routine mortality statistics from the UK and Aus-tralia. Arch Dis Child Fetal Neonatal Ed. 2008;93(3):F212–F216
18. Manktelow BN, Draper ES, Field DJ. Pre-dicting neonatal mortality among very preterm infants: a comparison of three
versions of the CRIB score.Arch Dis Child Fetal Neonatal Ed. 2010;95(1):F9–F13
19. Parry G, Tucker J, Tarnow-Mordi W; UK Neonatal Staffing Study Collaborative Group. CRIB II: an update of the clinical risk index for babies score.Lancet. 2003;361(9371): 1789–1791
20. Justice AC, Covinsky KE, Berlin JA. Assess-ing the generalizability of prognostic in-formation. Ann Intern Med. 1999;130(6): 515–524
21. The CRIB; The International Neonatal Net-work. The CRIB (clinical risk index for babies) score: a tool for assessing initial neonatal risk and comparing performance of neonatal intensive care units. Lancet. 1993;342(8865):193–198
22. Richardson DK, Gray JE, McCormick MC, Workman K, Goldmann DA. Score for Neo-natal Acute Physiology: a physiologic se-verity index for neonatal intensive care. Pediatrics. 1993;91(3):617–623
23. Richardson DK, Phibbs CS, Gray JE, McCormick MC, Workman-Daniels K, Gold-mann DA. Birth weight and illness severity: independent predictors of neonatal mor-tality.Pediatrics. 1993;91(5):969–975
24. Richardson DK, Corcoran JD, Escobar GJ, Lee SK. SNAP-II and SNAPPE-II: Simplified newborn illness severity and mortality risk scores.J Pediatr. 2001;138(1):92–100
25. Cohen JM, Hutcheon JA, Kramer MS, Joseph KS, Abenhaim H, Platt RW. In-fluence of ultrasound-to-delivery interval and maternal-fetal characteristics on val-idity of estimated fetal weight.Ultrasound Obstet Gynecol. 2010;35(4):434–441
APPENDIX
This appendix contains the parameter estimates for the models used to construct the updated tables of Draper et al.5
The variables referred to below are as follows:
eth equal to 1 for European ethnicity of the infant
gest gestational age at birth in completed weeks
mult2 equal to 1 for multiplicity of pregnancy, single equal to 0
sex equal to 1 for female gender, male gender equal to 0
wtgeth difference between observed birth weight and mean birth weight for gestational age for ethnic group (model parameter estimates given below)
Linear Regression Model to Calculate Mean Birth Weight by Ethnic Group
mean birth weight = 25122451 * eth2228 * gest + 19 * gest * eth + 6.2 * gest^2
Labor Model: Known to Be Alive at the Onset of Labor
Logistic regression model to estimate logit of death to discharge
logit of death =21 * (logit of being alive)
=21 * (245.7 + 0.037 * mult2 + 2.8 * gest20.038 * gest^2 + 0.019 * wtgeth 26.2 * 1024* gest * wtgeth24.0 * 1025* wtgeth^2
+ 1.3 * 1026* gest * wtgeth^2 + 1.6 * 1029* wtgeth^3)
NICU Model: Admitted to Neonatal Care
Logistic regression model to estimate logit of death to discharge for European babies
logit of death =21 * (logit of being alive)
=21 * (217.0 + 0.036 * mult2 + 0.43 * gender + 0.68 * gest + 0.020 * wtgeth
26.4 * 1024* gest * wtgeth23.3 * 1025* wtgeth^2 + 1.0 * 1026* gest * wtgeth^2 + 1.9 * 1029* wtgeth^3)
DOI: 10.1542/peds.2011-0803 originally published online December 12, 2011;
2012;129;e120
Pediatrics
Yvonne Vergouwe
Papatsonis, Martin J.K. de Kleine, Elizabeth S. Draper, Ewout W. Steyerberg and
Ewoud Schuit, Chantal W.P.M. Hukkelhoven, Bradley N. Manktelow, Dimitri N.M.
Services
Updated Information &
http://pediatrics.aappublications.org/content/129/1/e120 including high resolution figures, can be found at:
References
http://pediatrics.aappublications.org/content/129/1/e120#BIBL This article cites 23 articles, 11 of which you can access for free at:
Subspecialty Collections
sub
http://www.aappublications.org/cgi/collection/fetus:newborn_infant_ Fetus/Newborn Infant
following collection(s):
This article, along with others on similar topics, appears in the
Permissions & Licensing
http://www.aappublications.org/site/misc/Permissions.xhtml in its entirety can be found online at:
Information about reproducing this article in parts (figures, tables) or
Reprints
DOI: 10.1542/peds.2011-0803 originally published online December 12, 2011;
2012;129;e120
Pediatrics
Yvonne Vergouwe
Papatsonis, Martin J.K. de Kleine, Elizabeth S. Draper, Ewout W. Steyerberg and
Ewoud Schuit, Chantal W.P.M. Hukkelhoven, Bradley N. Manktelow, Dimitri N.M.
Validation Study
Prognostic Models for Stillbirth and Neonatal Death in Very Preterm Birth: A
http://pediatrics.aappublications.org/content/129/1/e120
located on the World Wide Web at:
The online version of this article, along with updated information and services, is
by the American Academy of Pediatrics. All rights reserved. Print ISSN: 1073-0397.