
EFFECT OF KONDAGOGU ON THE RELEASE BEHAVIOUR OF AMBROXOL HYDROCHLORIDE MATRIX TABLETS
5
0
0
Full text
(2) Y.Indira Muzib et al. IRJP 2012, 3 (11) were then passed through sieve no16#. Talc and magnesium stearate were finally added as glidant and lubricant and were compressed to tablets using Cadmach 16 station tablet punching machine. The total weight of tablets varies from 205 to 280mg. Prior to compression the granules were evaluated for various tests. Standard physical tests for matrix tablets For all the formulations of matrix tablets physical tests were performed and average values were calculated. The weight variation was evaluated on 20 tablets by weighing individually, the average weight was determined and percent variation of each tablet from the average weight of tablet was calculated. Tablet hardness was determined for 5 tablets of each formulation using a Monsanto tablet hardness tester and the average of applied pressure (Kg/cm2) for crushing the tablet was determined. Friability was determined by first weighing 10 tablets and then subjected for100 rotations for 4 minutes at 25rpm in a Roche friabilator and then reweighed after dusting. The remaining weight of tablets was recorded and percent friability was calculated. The physicochemical properties of designed tablets are shown in table 3. Drug content uniformity 14 For determining the drug content, three tablets from each formulation were finely powdered and amount equivalent to 75 mg of Ambroxol hydrochloride was dissolved in 75 ml of phosphate buffer pH 6.8. From this 10 µg/ml, equivalent solutions were prepared and drug content of Ambroxol hydrochloride was determined by measuring the absorbance of samples at 248nm using UV/Visible spectrophotometer. Generally, the drug content in any formulation should fall within the limit of 90 – 110%. In vitro drug release studies 15 Dissolution studies were carried out using USP apparatus type II (paddle) dissolution rate test apparatus. Stirring rate. Batch No F1 F2 F3 F4 F5 F6. Batch No F1 F2 F3 F4 F5 F6. Drug (mg) 75 75 75 75 75 75. was maintained at 100 rpm. 900 ml 0.1N HCl and the phosphate buffer pH 6.8 was used as dissolution medium for the first 2 hours and from 3 to 12 hours respectively, which was maintained at 37± 0.2°C. Aliquots of 5 ml were withdrawn at predetermined time intervals and were filtered through 0.45µ membrane filter; fresh dissolution medium was replaced after each withdrawal. The study was performed in triplicate and the mean values are taken. The commercial Ambroxol SR capsules were used as the reference formulation, and were also subjected to in vitro drug release studies. Calculation of similarity factor (f2) 16 Similarity factor was calculated for all the formulations with the marketed sample using the formula f2 = 50 + log {[1+ (1/n) ∑t=1 * n (Rt-Tt)2]-0.5 *100} where n is the number of dissolution sampling times, and Rt and Tt are the individual or mean percent dissolved at each time point for the reference and test dissolution profiles respectively. Measurement of swelling index 17 The swelling behaviour of the optimized formulation (F6) was studied and the % increase in weight due to absorbed liquid or water uptake was estimated at each time point from the following equation: % Weight change = W1- W0 / W0 x 100 Stability studies 18 Physical stability and effect of ageing on the drug release was studied for the optimized matrix formulation F4. 20 tablets were packed in amber-colored screw capped bottles and kept in oven maintained at 450C with 75% RH to conduct short term stability study over a period of 45 days. At the end of 45 days period, tablets were examined for appearance and dissolution test was performed to determine the drug release profiles and for drug content.. Table 1. Composition of Ambroxol hydrochloride matrix tablets Guar Talc Gum Kondagogu Avicel pH Starch Gum 101 75 38.75 10.25 4 112.5 35 12.5 5 150 32.6 14 5.6 37.5 37.5 38.75 10.25 4 56.25 56.25 35 12.5 5 75 75 32.6 14 5.6 *Quantity (mg) present per each Matrix tablet. Mg stearate 2 2.5 2.8 2 2.5 2.8. Total weight (mg) 205 242.5 280 205 242.5 280. Table 2. Physical properties of granules formulated with Gum Kondagogu (F1-F3) and gum kondagogu with guar gum (F4-F6) * Angle of LBD (g/ml) TBD (g/ml) CI (%) HR DC (%) Moisture Loss on Repose Content (%) Drying (%) 0.34±0.02 0.42±0.02 19.04±0.04 1.23±0.03 98.16±0.04 5.2±0.3 4.8±0.2 31.31±0.04 0.37±0.03 0.46±0.04 19.56±0.01 1.24±0.02 100.89±0.03 5.4±0.3 5.1±0.4 28.87±0.03 25.55±0.03 0.42±0.08 0.51±0.04 17.64±0.02 1.21±0.02 97.61±0.04 5.8±0.2 5.3±0.4 27.17±0.02 0.44±0.04 0.49±0.05 10.20±0.02 1.11±0.06 99.54±0.06 5.9±0.5 5.7±0.5 25.90±0.06 0.49±0.03 0.55±0.02 10.90±0.04 1.12±0.04 99.07±0.04 6.4±0.4 5.9±0.3 0.54±0.04 0.62±0.07 12.90±0.05 1.14±0.01 98.42±0.02 6.8±0.3 6.3±0.5 25.24±0.09 * All the values are expressed as mean± SE, n=5 Table 3. Physical properties of tablets formulated with Gum Kondagogu and gum kondagogu with guar gum * Batch No Wt in mg Hardness Thickness (mm) Friability (%) DC (%) (Kg/cm2) 202.7±0.06 7.0±0.4 3.22±0.05 0.56±0.03 96.54±0.02 F1 240.3±0.05 6.2±0.1 3.65±0.02 0.60±0.06 97.65±0.08 F2 278.9±0.02 6.5±0.5 3.93±0.09 0.66±0.08 100.03±0.04 F3 200.4±0.03 6.4±0.9 3.28±0.06 0.60±0.07 98.68±0.06 F4 6.9±0.7 3.71±0.08 0.57±0.06 99.12±0.09 243.2±0.05 F5 6.1±0.5 4.02±0.07 0.74±0.04 97.27±0.03 279.5±0.09 F6 * All the values are expressed as mean±SE, n=5. Page 159.
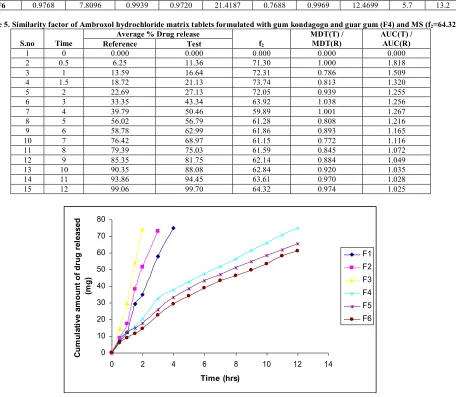
(3) Y.Indira Muzib et al. IRJP 2012, 3 (11) Table 4. Release kinetics of Ambroxol hydrochloride matrix tablets formulated with gum kondagogu and gum kondagogu with guar gum Release Model Batch No Zero order First Higuchi Koresmeyer-Peppas T90 order T50 (hrs) (hrs) r2 k r2 r2 k n r2 k 24.6581 0.8139 0.8983 39.0633 1.1818 0.9888 20.3172 2.1 3.6 0.9935 F1 0.9910 32.3928 0.8738 0.9005 44.9104 1.2438 0.9913 26.9075 1.4 2.7 F2 0.9926 47.3256 0.8264 0.9120 56.2642 1.1853 0.9972 42.9525 1.2 1.8 F3 0.9634 9.2518 0.8345 0.9811 26.5400 0.7069 0.9965 17.5632 3.9 10.4 F4 0.9614 8.2274 0.9919 0.9826 23.6211 0.6933 0.9980 16.0444 4.8 12.3 F5 0.9768 7.8096 0.9939 0.9720 21.4187 0.7688 0.9969 12.4699 5.7 13.2 F6. Cumulative amount of drug released (mg). Table 5. Similarity factor of Ambroxol hydrochloride matrix tablets formulated with gum kondagogu and guar gum (F4) and MS (f2=64.32) Average % Drug release MDT(T) / AUC(T) / S.no Time f2 MDT(R) AUC(R) Reference Test 1 0 0.000 0.000 0.000 0.000 0.000 2 0.5 6.25 11.36 71.30 1.000 1.818 1 13.59 16.64 72.31 0.786 1.509 3 4 1.5 18.72 21.13 73.74 0.813 1.320 5 2 22.69 27.13 72.05 0.939 1.255 3 33.35 43.34 63.92 1.038 1.256 6 7 4 39.79 50.46 59.89 1.001 1.267 5 56.02 56.79 61.28 0.808 1.216 8 9 6 58.78 62.99 61.86 0.893 1.165 10 7 76.42 68.97 61.15 0.772 1.116 8 79.39 75.03 61.59 0.845 1.072 11 12 9 85.35 81.75 62.14 0.884 1.049 10 90.35 88.08 62.84 0.920 1.035 13 14 11 93.86 94.45 63.61 0.970 1.028 15 12 99.06 99.70 64.32 0.974 1.025. 80 70 60. F1. 50. F2 F3. 40. F4. 30. F5. 20. F6. 10 0 0. 2. 4. 6. 8. 10. 12. 14. Time (hrs). Figure 1. Dissolution profiles of Ambroxol hydrochloride matrix tablets formulated with gum kondagogu (F1-F3) and gum kondagogu with guar gum (F4-F6)( Zero order plot). Log cumulative % drug remained. 4 2 F1. 0 0. 2. 4. 6. 8. -2. 10. 12. 14. F2 F3 F4. -4. F5 -6. F6. -8 -10 Time (hrs). Figure 2. First order plot of Ambroxol hydrochloride matrix tablets formulated with gum kondagogu and gum kondagogu with guar gum. Page 160.
(4) Y.Indira Muzib et al. IRJP 2012, 3 (11). Cumulative % drug release. 250 200 F1. 150. F2 F3. 100. F4 F5. 50. F6. 0 0. 0.5. 1. 1.5. 2. 2.5. 3. 3.5. 4. -50 Square root of tim e. Figure 3. Higuchi plot of Ambroxol hydrochloride matrix tablets formulated with gum kondagogu and gum kondagogu with guar gum. Log cumulative % drug release. 3.5 3 F1. 2.5. F2 2. F3. 1.5. F4 F5. 1. F6. 0.5 0 -0.4. -0.2. 0. 0.2. 0.4. 0.6. 0.8. 1. 1.2. Log time. Figure 4 Koresmeyer-Peppas plot of Ambroxol hydrochloride matrix tablets formulated with gum kondagogu and gum kondagogu with guar gum. Figure 5 Similarity factor of Ambroxol hydrochloride matrix tablets formulated with gum kondagogu and guar gum (F4) and MS (f2=64.32). RESULTS AND DISCUSSION Physical properties of granules The prepared granules of all the formulations were evaluated for angle of repose, loose bulk density (LBD), tapped bulk density (TBD) and compressibility index (CI), Hauser ratio. All the formulations have shown (table 2) excellent flow properties. Physical properties of tablets Various physical parameters of tablets like weight variation, hardness, friability, content of active ingredient were determined all were within the limits. The results are tabulated in the table 3. In vitro release studies By employing gum kondagogu different formulations F1 (drug: polymer) (1:1), F2 (1:1.5), F3 (1:2) were developed. and the drug release kinetics were studied. These formulations failed to retard the drug release till 12hrs hence, gum kondagogu was combined with guar gum and the polymer combination ratio was optimized as 1:1 which was employed for further formulations F4, F5 and F6. From the results F4 was optimized among F4, F5 and F6 as F4 gave 99.70% drug release and gave the release profile close to the commercially available marketed sample of Ambroxol HCl (MS). And here it was observed that the cumulative percentage of drug release was decreased with increase in polymer concentration. The release data of matrix tablets were fitted into various kinetic models (Fig 1,2,3,4,5) to analyze the kinetics and mechanism of drug release from the tablets. These results showed that the drug release from the formulations F1, F2 Page 161.
(5) Y.Indira Muzib et al. IRJP 2012, 3 (11) and F3 followed Zero order kinetics and the formulations F5 and F6 followed first order kinetics whereas, the formulations F4 followed Higuchi kinetics. The drug release from a matrix tablet containing hydrophilic polymer generally involves factors of diffusion. To evaluate drug release mechanism from the tablets, plots of percent released versus square root of time as per Higuchi’s equation were constructed. The formulations F6 show better linearity for Higuchi release kinetics with (r2>0.97). It indicates that the drug release is by diffusion mechanism. When the dissolution data was fitted to Korsmeyer equation where plots of log cumulative percent drug release versus log time gives r2 values which is used to describe the drug release behaviour from polymeric systems. The formulations F4, F5 and F6 showed diffusion co-efficient value (n) greater than 0.45 but less than 0.89 shown in the tables 4. So, it indicates Non-Fickian (anomalous) transport mechanism indicating that the drug release is by a combination of both diffusion and erosion of polymer. And the formulations F1, F2 and F3 showed n value >0.89 indicates super case II type of release indicating that the drug release from these formulations is by erosion of polymer. Swelling index The swelling index of the optimized formulation F6 was found to be 77.28%. Plastic viscosity was found to be 3.32. Stability studies The short term stability studies were carried out for optimized (F4) formulation at 45°C with 75% RH for 45 days revealed that no considerable differences in drug content, dissolution, T50, and T90 were observed. CONCLUSION Among all the formulations F4 containing natural polymers gum kondagogu in combination with guar gum with drug: polymer 1:1 showed in vitro drug release 98.53% and offered comparative release profile with that of marketed sample and hence considered as the most promising formulation.. ACKNOWLEDGEMENT Authors thank to Sri Padmavathi Mahila University and Bapatla college of pharmacy for providing facilities to carry this project work. REFERENCES 1. Nellore RV et al. Development of metoprolol tartarate extended release matrix tablet formulations for regulatory policy consideration. J Con Rel. 1998: 50: 247-56. 2. Sweetman C. Eds., In; Martindale, The Complete Drug Reference, 33rd Edn., The Pharmaceutical Press, London, 2002, 1084. 3. Vergin H et al Arzneim. Forsch-Drug Res. 1985, 35, 1591. 4. Alighieri T et al, Arzneim. Forsch-Drug Res. 1988, 38, 92. 5. Ramanaiah G. KVRNS Ramesh and A Subrahmanyam. Design and evaluation of Controlled release oral formulations of Ambroxol hydrochloride. The Indian Pharmacist. 2005: 71-74. 6. Morkhade DM, Gulzele SV, Sattur watr PM and Joshi SB, Gum global and gumdhar novel matrix forming materials for sustained drug delivery, Indian Journal of Pharmaceutical Sciences, 2006, 68, 53-58. 7. Vinod VTP et al. Morphological, physicochemical and structural characterization of gum kondagogu: a tree gums from in India, Food hydrocolloids, 2007, 1062. 8. Janaki B and Sashidhar RB , Physico-chemical analysis ofgum kondagogu (c.g): a potential food additive, Food chem., 61(1/2), 1998, 231-236. 9. Tyler VE, Brady LR and Robers, J.E., Pharmacognosy, 8th Edn., Lea and Febiger, Philadelphia, 1981, 52. 10. Goldstein AM, Alter EN and Seaman JK, In; Whistler, R.L. Eds., Industrial Gums, Polysaccharides and their derivatives, Academic Press, New York, 1973, 303. 11. Raymond C Rowe, Hand book of pharmaceutical excipients, Fifth Edn., 315, 2006. 12. Mulye NV, Turco SJ. A simple model based on first order kinetics to explain release of highly water soluble drugs from porous dicalcium phosphate dihydrate matrices, Drug Devin Ind Pharm 1995; 221: 943 – 953. 13. Indian Pharmacopoeia (1985) 3rd Ed, Controller of publication, (II) A142 – A 143. 14. United States Pharmacopoeia 24, National Formulary, USP Convention, Rockville, 2000; 19(II): 1941-1944. 15. Robinson JR, Eriksen SP. Theoretical formulation of sustained release dosage forms, Journal Pharmaceutical Sciences 1966; 53: 1254-1263. 16. Costa P and Jose MSL, Modeling and comparison of dissolution profiles, Eur J Pharm Sci, 2001, 13,123-133. 17. Talukdar M and Kinget, Swelling and drug release behaviour of xanthan gum matrix tablets, Int J of Pharmaceutics, 1995, 120: 63-72. 18. Efentakis M and Vlachou M, Evaluation of high molecular weight poly(oxy ethylene) (polyoxyl) polymer: studies of flow properties and release rates of furosemide and captopril from CR hard gelatin capsules, Pharm.Dev. Technol. 2000; 5,339-346.. Source of support: Nil, Conflict of interest: None Declared. IRJP is an official publication of Moksha Publishing House. Website: www.mokshaph.com. All rights reserved.. Page 162.
(6)
Figure


Related documents
A bit surprisingly, the present study did not show an association between distress and age, whereas earlier studies have shown that in newly diagnosed men with localized
10 The analysis of the clinical data from our study showed that CASC9 expression level in TSCC tissues was positively associated with tumor diameter, TNM stage, and lymph node Figure
In dieser Untersuchung ergab sich, dass die meisten Unverträglichkeitsreaktionen im Zusammenhang mit zahnärztlichen Maßnahmen und dort wiederum vor allem durch Injektionen
ALIF: Anterior lumbar interbody fusion; ASD: Adjacent segment disease; BMD: Bone mineral density; CT: Computed tomography; DBM: Demineralized bone matrix; DDD: Degenerative
We further defined a generalized value function for buyers with regards to the criticality of their demand in the face of uncertain delivery (see “ Critical & tolerant buyers
to buy. There are difficulties for many logistics companies to outfit those facilities. That’s why there is few 3 rd party logistics company in cold chain in China. There are
Aim: This study was conducted to identify plasma methionine, S-adenosyl methionine (SAM), S-adenosyl homocysteine (SAH), folate, vitamin B12, cysteine levels on
Due to the amino acid chains in its content, the aminoacid artificial fertilizer at hand contains three main nutrients, nitrogen, phosphorus and potassium.. The three
