Health Care Use During Transfer
to Adult Care Among Youth
With Chronic Conditions
Eyal Cohen, MD, MSc,a,b,c,d Sima Gandhi, MSc,c Alene Toulany, MD,b,e,f Charlotte Moore, MD,a,b Longdi Fu, MSc,c Julia Orkin, MD, MSc,a,b,g Deborah Levy, MD, MS,b,h Anne L. Stephenson, MD, PhD,f,i Astrid Guttmann, MDCM, MSca,b,c,f
abstract
OBJECTIVE: To compare health care use and costs for youth with chronic health conditionsbefore and after transfer from pediatric to adult health care services.
METHODS: Youth born in Ontario, Canada, between April 1, 1989, and April 1, 1993, were assigned to 11 mutually exclusive, hierarchically arranged clinical groupings, including “complex” chronic conditions (CCCs), non-complex chronic conditions (N-CCCs), and chronic mental health conditions (CMHCs). Outcomes were compared between 2-year periods before and after transfer of pediatric services, the subjects’ 18th birthday.
RESULTS: Among 104 497 youth, mortality was highest in those with CCCs, but did not
increase after transfer (1.3% vs 1.5%, P = .55). Costs were highest among youth with CCCs
and decreased after transfer (before and after median [interquartile range]: $4626 [1253– 21 435] vs $3733 [950–16 841], P < .001);Costs increased slightly for N-CCCs ($569 [263–
1246] vs $589 [262–1333], P < .001), and decreased for CMHCs ($1774 [659–5977] vs $1545
[529–5128], P < .001). Emergency department visits increased only among youth with
N-CCCs (P < .001). High-acuity emergency department visits increased CCCs (P = .04) and N-CCCs (P < .001), but not for CMHC (P = .59), who had the highest visit rate. Among the 11 individual conditions, costs only increased in youth with asthma (P < .001), and decreased (P < .05) in those with neurologic impairment, lupus, inflammatory bowel disease, and mood/affective disorders.
CONCLUSIONS: Pediatric transfer to adult care is characterized by relatively stable short-term patterns of health service use and costs among youth with chronic conditions.
Divisions of aPediatric Medicine and Child Health Evaluative Sciences, eAdolescent Medicine, and hRheumatology,
The Hospital for Sick Children, Toronto, Ontario, Canada; bDepartment of Pediatrics, and fInstitute for Health
Policy, Management, and Evaluation, University of Toronto, Toronto, Ontario, Canada; cInstitute for Clinical
Evaluative Sciences, Sunnybrook Health Sciences Centre, Toronto, Ontario, Canada; dCommonwealth Fund/CFHI
Harkness Fellow in Health Care Policy and Practice, New York, New York; gCentre for Research on Inner City
Health, Li Ka Shing, Keenan Research Center, and iDivision of Respirology, Department of Medicine, St Michael’s
Hospital, Toronto, Ontario, Canada
Dr Cohen conceptualized and designed the study, interpreted the data, drafted and revised the manuscript; Ms Gandhi and Drs Toulany, Moore, Orkin, Levy, and Stephenson drafted and revised the manuscript and interpreted the data; Mr Fu performed data analysis and interpretation, and reviewed the fi nal manuscript; Dr Guttmann conceptualized and designed the study, obtained funding, interpreted the data, and provided critical revisions to the study; and all authors provided critical revisions of the manuscript and approved the fi nal version.
DOI: 10.1542/peds.2015-2734 Accepted for publication Nov 30, 2015
To cite: Cohen E, Gandhi S, Toulany A, et al. Health Care Use
During Transfer to Adult Care Among Youth With Chronic Conditions. Pediatrics. 2016;137(3):e20152734
WHAT’S KNOWN ON THIS SUBJECT: Growing numbers of youth with chronic conditions are surviving into adulthood. Studies have shown that transfer to adult care is often suboptimally executed with adverse outcomes reported; however, these evaluations are based primarily on small samples and single-disease populations.
A growing number of youth with chronic health conditions are surviving into adulthood (∼750 000 annually in the United States) who require transfer from a child- to adult-focused health care system.1–3
Transfer of youth with chronic health conditions to adult care is often suboptimal due to factors such as emotional and cognitive developmental challenges, lack of individual and family-centered social supports, communication and coordination challenges between health care sectors, and a lack of appropriately trained adult health care providers.4 Decline in health
after transfer of care to adult health care providers is well described, possibly due to lapses in adherence, follow-up, and/or insurance coverage5; however, most studies
reporting this phenomenon have focused on single populations such as those with sickle cell disease,6
diabetes mellitus,7 or organ
transplantation,8,9 and relatively
little is known about those with chronic mental health10 and
neurodevelopmental conditions. Population-level description of health care use and mortality during transfer may illuminate the pervasiveness of this problem among broad groups of youth transferring to adult care. In Canada, virtually all pediatric primary care, specialist, and hospital care are mandated by provincial funders to transfer by age 18 years, although not all aspects of care are transferred by this age (eg, primary care provided by family physicians); this provides a unique opportunity to assess the impact of this sentinel event on outcomes. The objective of this study was to compare the patterns of health care use and outcomes before and after transfer to adult care among universally insured youth with varied chronic conditions. We hypothesized that transfers are executed
poorly and thus lead to increased avoidable health care use, including
emergency department visits and hospitalizations.
METHODS
Study Design and Setting
Data for this longitudinal cohort study were obtained from population-based administrative health datasets at the institute for Clinical Evaluative Sciences (ICES), allowing linkage of individual health records across databases over time, using encoded identifiers for all residents of Ontario, Canada’s most populous province (∼14 million). Ethical approval was granted by the Sunnybrook Health Sciences Centre Research Ethics Board.
Data Sources
Cohorts were developed from selected disease registries derived from validated algorithms by using health administrative data, including Pediatric inflammatory Bowel Disease, Ontario Diabetes Database, and the Ontario Asthma Database registries.11–13 A clinical registry of
all children seen at the 4 provincial pediatric rheumatology clinics was used to define those with systemic lupus erythematosus (SLE).14,15
Additional cohorts were defined by using the international Classification of Diseases, Ninth (ICD-9; until 2002) and 10th Revisions (ICD-10), and Diagnostic and Statistical Manual of Mental Disorders, Text Revision (DSM-IV TR) diagnostic codes from inpatient discharge records (Discharge Abstract Database and the Ontario Mental Health Reporting System).
Outpatient physician visit and billing data were obtained from public health insurance data (Ontario Health insurance Plan [OHIP]). Physician specialty was determined from the ICES Physician Database. Primary care delivery by a usual provider of care was determined by using physician claims from OHIP, and the Client Agency Program Enrollment database, assigning enrollment
of individuals to a provider in a specific program or group. Home care service visits were captured from the Home Care Database, which records all government-funded home health care. The Ontario Drug Benefit Program data were used to enumerate children whose families are on social support (Ontario Works) and describe outpatient drug use for eligible children. The Registered Persons Database provides demographic information for Ontarians. Postal codes were linked to the 2006 Canadian Census to obtain mean neighborhood income quintile for each dissemination area (population 400–700 inhabitants) that are adjusted for both household size and community size. Immigrant status (nonimmigrant, immigrant, and refugee) was obtained by using the Citizenship and Immigration Canada database, which includes records of permanent residents that applied to land in Ontario since 1985. Other data used included emergency department (ED) visits (National Ambulatory Care Reporting System), and admissions to rehabilitation (National Rehabilitation Reporting System) and continuing care (Continuing Care Reporting System).
Study Population
Youth with at least 1 of 11 chronic conditions, born between April 1, 1989, and April 1, 1993 (last date of follow-up March 31, 2013) were included. Chronic conditions were sorted hierarchically into mutually exclusive condition categories. At the top of the hierarchy was neurologic impairment (NI), defined as diagnoses consistent with static or progressive neurologic, genetic, or other diseases that typically result in functional and/or intellectual impairment,16
(DM), and asthma. Last, we explored 3 chronic mental health conditions: eating disorders, schizophrenia and related psychotic disorders (SZ), and mood and affective disorders (MA). For descriptive purposes, the clinical conditions were grouped into (1) complex chronic conditions (CCC; NI, CF, SLE, SCD), which were operationally defined as chronic medical conditions in which multiple morbidities and/or multiorgan manifestations are common,17 (2)
“noncomplex” chronic conditions (N-CCC; CHD, IBD, DM, asthma), defined as chronic conditions typically affecting a single organ system, and (3) chronic mental health conditions (CMHC; eating disorders, SZ, MA).
CHD, CF, and SCD were defined based on hospital discharge records in any field, from birth to age 16. NI and CMHC were defined similarly, but obtained from hospitalization discharges from ages 10 to 16 to try to ensure activity of the underlying conditions necessitating transfer (see Supplemental Table 3 for diagnostic codes used in constructing these cohorts). SLE, IBD, DM, and asthma were defined from records in disease registries. Sensitivity and specificity of these disease definitions using ICES databases are previously reported.11–13
Excluded were youth born before fiscal year 1989 (1991 for the CHD cohort, as CHD categorization requires birth records that were only available at ICES in 1991), those who died before 16 years of age, or those without continuous residency in Ontario from ages 10 to 20 years. To focus the analysis to youth with a high likelihood of ongoing active chronic conditions, for asthma, we excluded those with no asthma-related health care visits (physician, ED, hospitalization) from 10 to 16 years of age. CHD diagnoses were reviewed with a pediatric cardiologist and excluded diagnoses that were very unlikely to have any residual health effects after early
childhood or once repaired (eg, isolated patent ductus arteriosus).
Health Service Utilization and System Costs
Health service utilization and systems costs were examined by sector. Type of service use included acute care (hospital) admissions, ICU admissions, ED visits, admissions to rehabilitation and complex continuing care (long-term care) facilities, outpatient drugs, primary care and specialist physician visits, and home care service visits. ED visits were subdivided based on the validated, ordinal (5-level) Canadian Triage Acuity Scale (CTAS)18 into
“low” (CTAS 1–3) and “high” acuity (CTAS 4–5).
Service costs were determined from payments to providers using service-specific unit costs. The costs of nonpsychiatric hospitalizations, ED visits, and inpatient rehabilitation were estimated by using case mix methodology, where case cost is determined based on resource weight during an episode of care and applicable unit costs. Complex continuing care and inpatient psychiatric hospitalization case costs were calculated by using measures of resource intensity, length of stay, and per diem costs. Further information on case-costing methodology using administrative data sources in Ontario are available online.19,20
Analysis
The subjects’ 18th birthday was defined as the index date, the age of transfer. We compared descriptive patterns of health service utilization and system costs, overall and by sector, calculated over 2-year periods before (age 16–18 years) and after index (age 18–20 years). Differences in demographic characteristics and health service use across cohorts at baseline (age 10–16 years) were examined by using either 1-way analysis of variance (means), Kruskal-Wallis (medians), or χ2 (categorical)
tests. Wilcoxon signed-rank tests
and χ2 tests were used to compare
health service utilization, costs, and mortality within groups, before and after transfer. Paired t tests were used to examine the contribution of costs before and after transfer, for each health care sector. Analyses were performed with SAS version 9.4 (SAS institute, inc, Cary, NC). Significance was defined as P < .05 (2-tailed).
RESULTS
Clinical and Demographic Characteristics
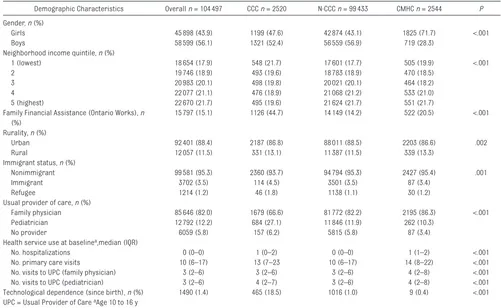
Among 104 497 youth identified as having chronic conditions, 2520 (2.4%) had CCCs (2118 with NI, 147 with CF, 94 with SLE, and 161 with SCD), 99 433 (95.2%) had N-CCCs (3436 with CHD, 860 with IBD, 2883 with DM, and 92 254 with asthma) and 2544 (2.4%) had a CMHC (374 with an eating disorder, 184 with SZ, and 1986 with MA) (Table 1). Boys made up more than half the study population (56.1%), with a preponderance of girls (71.7%) among mental health conditions (P < .001). Across groups, a higher proportion of youth with CCCs were recipients of Ontario Works family financial assistance (44.7%, P < .001) and new immigrants or refugees (6.3%, P = .001). Primary care was delivered primarily by family physicians across all 3 groups, with the highest rates of pediatrician-delivered primary care in youth with CCCs (27.1%, P < .001). Disease-specific characteristics showed that low-income status was most common among youth with SCD (45.3%), whereas family financial assistance (Ontario Works) was most common among youth with NI (46.3%). Low-income and financial assistance were least common among those with eating disorders (9.9% and 9.4%, respectively).
Posttransfer Mortality, Health Service Use and Costs
posttransfer (1.5%). Mortality rates did not significantly change in any groups (Table 2). Overall health system costs were highest among youth with CCCs but decreased during transfer (pre- and postmedian [interquartile range (IQR)]: $4626 [1253–21 435] vs $3733 [950–16 841], P < .001). Overall costs increased slightly for N-CCCs (median [IQR]: $569 (263–1246) vs $589 [262–1333], P < .001), and decreased slightly for CMHCs (median [IQR]: $1774 [659– 5977] vs $1545 [529–5128], P < .001).
Across all groups, visits to an adult specialist increased in the 2 years after transfer, whereas both primary care and subspecialty visits to pediatricians decreased. Visits to a family physician increased slightly after transfer only among youth with CCCs (78.3% vs 82.7%, P < .001). The proportion of youth with at least 1 annual primary preventative care visit in the 2 years after transfer decreased across all 3 clinical groups
(P = .02 for CCCs, P < .001 for N-CCCs, P < .01 for CMHCs).
Hospitalization rates for both CCCs and CMHCs declined after transfer in both groups (29.1% vs 24.2% for CCCs and 26.8% vs 22.8% for CMHCs, P < .001), as did total number of admissions (P < .001). For N-CCCs, the proportion of patients with a hospital admission increased slightly (5.8% vs 6.3%, P < .001). Hospital ICU admissions did not significantly increase for any of the 3 groups (P = .22 for CCCs, P = .60 for N-CCCs, P = .33 for CMHCs).
The proportion of subjects with ED visits increased among youth with N-CCCs (44.5% vs 45.9%, P < .001, respectively), but not for those with CCCs (P = .28) or those with CMHC (P = .16), with the highest overall rate of ED visits. Increased high-acuity ED visits were noted for CCCs (P = .04) and N-CCCs (P < .001), but not for CMHC (P = .59). Low-acuity visits
remained stable for all 3 groups (P = .60, P = .35, and P = .12, respectively).
Home care service use was highest among youth with CCCs, and decreased after transfer from 39.4% to 33.3% of CCCs (P < .001). The proportion of youth with drug claims increased significantly across claimants in all cohorts (P < .001), as did the number of claims among youth with CCCs (P < .001).
Among the 11 individual conditions (Fig 1), health system costs were highest among youth with CF and SCD. Significant increases in health system costs posttransfer were found for youth with asthma ($549 (257–1176) vs $567 (257–1265), P < .001) while significant (P < .05) decreases were found post-transfer for NI, SLE, IBD, eating disorders, and MA (Supplemental Tables 4, 5, and 6).
Inpatient hospitalizations contributed to >30% of overall costs both pre- and post-transfer for all three groups,
TABLE 1 Demographic Characteristics and Health Service Use at Baseline Among Youth With Chronic Health Conditions, by Clinical Group
Demographic Characteristics Overall n = 104 497 CCC n = 2520 N-CCC n = 99 433 CMHC n = 2544 P Gender, n (%)
Girls 45 898 (43.9) 1199 (47.6) 42 874 (43.1) 1825 (71.7) <.001
Boys 58 599 (56.1) 1321 (52.4) 56 559 (56.9) 719 (28.3)
Neighborhood income quintile, n (%)
1 (lowest) 18 654 (17.9) 548 (21.7) 17 601 (17.7) 505 (19.9) <.001
2 19 746 (18.9) 493 (19.6) 18 783 (18.9) 470 (18.5)
3 20 983 (20.1) 498 (19.8) 20 021 (20.1) 464 (18.2)
4 22 077 (21.1) 476 (18.9) 21 068 (21.2) 533 (21.0)
5 (highest) 22 670 (21.7) 495 (19.6) 21 624 (21.7) 551 (21.7)
Family Financial Assistance (Ontario Works), n (%)
15 797 (15.1) 1126 (44.7) 14 149 (14.2) 522 (20.5) <.001
Rurality, n (%)
Urban 92 401 (88.4) 2187 (86.8) 88 011 (88.5) 2203 (86.6) .002
Rural 12 057 (11.5) 331 (13.1) 11 387 (11.5) 339 (13.3)
Immigrant status, n (%)
Nonimmigrant 99 581 (95.3) 2360 (93.7) 94 794 (95.3) 2427 (95.4) .001
Immigrant 3702 (3.5) 114 (4.5) 3501 (3.5) 87 (3.4)
Refugee 1214 (1.2) 46 (1.8) 1138 (1.1) 30 (1.2)
Usual provider of care, n (%)
Family physician 85 646 (82.0) 1679 (66.6) 81 772 (82.2) 2195 (86.3) <.001
Pediatrician 12 792 (12.2) 684 (27.1) 11 846 (11.9) 262 (10.3)
No provider 6059 (5.8) 157 (6.2) 5815 (5.8) 87 (3.4)
Health service use at baselinea,median (IQR)
No. hospitalizations 0 (0–0) 1 (0–2) 0 (0–0) 1 (1–2) <.001
No. primary care visits 10 (6–17) 13 (7–23 10 (6–17) 14 (8–22) <.001
No. visits to UPC (family physician) 3 (2–6) 3 (2–6) 3 (2–6) 4 (2–8) <.001
No. visits to UPC (pediatrician) 3 (2–6) 4 (2–7) 3 (2–6) 4 (2–8) <.001
TABLE 2
Health Care Use, Costs, and Mor
tality, Before and After T
ransfer to Adult Care, Among Youth With Chronic Health Conditions
CCC, n = 2520 N-CCC, n = 99 433 CMHC, n = 2544 Pretransfer Posttransfer P Pretransfer Posttransfer P Pretransfer Posttransfer P Mor tality, n (%) 33 (1.3) 38 (1.5) .55 71 (0.1) 96 (0.1) .05 < 6 7 (0.3)
Total health system costs ($CDN), median (IQR)
4626 (1253– 21 435) 3733 (950– 16 841) <.001 569 (263–1246) 589 (262-1333) <.001 1774 (659–5977) 1545 (529–5128) <.001
Physician visits Any family physician visit,
n (%) 1972 (78.3) 2084 (82.7) <.001 86 471 (87.0) 86 311 (86.8) .20 2260 (88.8) 2235 (87.9) .18
No. family physician visits, median (IQR)
3 (1–7) 4 (1–8) <.001 4 (2–7) 4 (2–8) <.001 6 (2–11) 6 (2–10) <.01
Any primary care pediatrician visit,
n ( % ) 1083 (43.0) 568 (22.5) <.001 14 515 (14.6) 6031 (6.1) <.001 465 (18.3) 139 (5.5) <.001
No. primary care pediatrician visits, median (IQR)
0 (0–2) 0 (0–0) <.001 0 (0–0) 0 (0–0) <.001 0 (0–0) 0 (0–0) <.001
Any specialist visit,
n (%) 1882 (74.7) 1940 (77.0) .02 42 831 (43.1) 44 073 (44.3) <.001 1417 (55.7) 1517 (59.6) <.001
No. specialist visits, median (IQR)
2 (0–5) 3 (1–7) <.001 0 (0–2) 0 (0–2) <.001 1 (0–3) 1 (0–5) <.001
Any pediatric specialist visit,
n (%) 1558 (61.8) 902 (35.8) <.001 17 936 (18.0) 7532 (7.6) <.001 1021 (40.1) 393 (15.4) <.001
No. pediatric specialist visits, median (IQR)
1 (0–5) 0 (0–1) <.001 0 (0–0) 0 (0–0) <.001 0 (0–3) 0 (0–0) <.001
At least one annual primary care preventative visit,
n (%) 397 (15.8) 347 (13.8) .02 17 722 (17.8) 16 643 (16.7) <.001 493 (19.4) 423 (16.6) <.01
Physician costs ($CDN), median (IQR)
797 (352–1629) 874 (311–2049) <.001 286 (105–631) 264 (81–644) <.001 730 (252–1886) 628 (182–1806 ) <.001
Hospitalizations Any
hospitalization, n (%) 734 (29.1) 610 (24.2) <.001 5796 (5.8) 6261 (6.3) <.001 683 (26.8) 581 (22.8) <.001
No. hospitalizations, median (IQR)
0 (0–1) 0 (0–0) <.001 0 (0–0) 0 (0–0) <.01 0 (0–1) 0 (0–0) <.001
Hospital costs ($CDN), median (IQR)
0 (0–3123) 0 (0–0) <.001 0 (0–0) 0 (0–0) .30 0 (0–1749) 0 (0–0) <.001
ICU admissions Any ICU admission,
n (%) 156 (6.2) 137 (5.4) .22 537 (0.5) 521 (0.5) .60 30 (1.2) 23 (0.9) .33
Total ICU LOS, median (SD)
0 (0–0) 0 (0–0) .19 0 (0–0) 0 (0–0) .15 0 (0–0) 0 (0–0) .20
ED visits Any ED visit,
n (%) 1408 (55.9) 1376 (54.6) .28 44 268 (44.5) 45 686 (45.9) <.001 1649 (64.8) 1609 (63.2) .16
No. ED visits, median (IQR)
1 (0–2) 1 (0–2) .14 0 (0–1) 0 (0–1) <.001 1 (0–3) 1 (0–3) .27
No. high acuity
a ED visits, median (IQR)
0 (0–1) 0 (0–1) .04 0 (0–1) 0 (0–1) <.001 1 (0–2) 0 (0–2) .59
No. low acuity
b ED visits, median (IQR)
0 (0–1) 0 (0–1) .60 0 (0–1) 0 (0–1) .35 0 (0–1) 0 (0–1) .12
ED costs ($CDN), median (IQR)
143 (0–612) 134 (0–663) .01 0 (0–252) 0 (0–292) <.001 230 (0–728) 212 (0–755) .81
Home care visits Any home care ser
vice visit, n (%) 994 (39.4) 839 (33.3) <.001 1491 (1.5) 1502 (1.5) .81 42 (1.7) 50 (2.0) .37
No. home care ser
vice visits, median
(IQR) 0 (0–16) 0 (0–9) <.01 0 (0–0) 0 (0–0) .92 0 (0–0) 0 (0–0) .28
Home care costs ($CDN), median (IQR)
0 (0–2132) 0 (0–1398) <.001 0 (0–0) 0 (0–0) .15 0 (0–0) 0 (0–0) .10
Drug use Any drug claim,
n (%) 866 (34.4) 1234 (49.0) <.001 9796 (9.9) 11 677 (11.7) <.001 460 (18.1) 713 (28.0) <.001
No. drug claims, median (IQR)
5 (3–10) 6 (3–10) <.001 4 (2–7) 3 (1–6) <.01 4 (2–6) 4 (2–8) <.001
Drug costs ($CDN), median (IQR)
0 (0–293) 0 (0–1321) <.001 0 (0–0) 0 (0–0) <.001 0 (0–0) 0 (0–26) <.001
Other health ser
vice costs
c ($CDN), median
IQR 784 (209–2932) 334 (128–1165) <.001 117 (42–247) 150 (56–290) <.001 235 (93–464) 247 (108–445) .54
LOS, length of stay. a High-acuity ED visits = Canadian T
riage and Acuity (CTAS) 1–3.
b Low acuity= CTAS 4, 5. c Other health ser
vice costs include ambulatory visits to cancer and dialysis clinics; nonphysician OHIP billings; laboratory cl
aims; admissions to rehabilitation, continuing care, and long-term care facilities; capitation payments; and assisted devices
and were the largest contributor of overall costs in the CMHC group both pre- and posttransfer (Fig 2). During both periods, among CCCs, home care was the largest contributor of costs, whereas outpatient physician claims accounted for the largest costs among N-CCCs.
DISCUSSION
Among youth with varied chronic medical and psychiatric conditions, we found relatively stable patterns of mortality, overall health care use, and costs after transfer from pediatric to adult care. After transfer, overall annual preventive care visits declined while specialist visits increased. High-acuity ED use increased slightly for youth with CCCs and N-CCCs, but hospitalizations declined for those youth at highest risk of these outcomes (CCCs and CMHCs).
We used a population-level longitudinal study with a robust sample size across multiple conditions. Only 1 of the 11 conditions we studied (asthma) demonstrated an increase in health care use after age 18, but the absolute amount (median difference of $18) is of questionable clinical significance. Even among conditions with potential for disease progression (eg, CF, SCD, SZ), we did not find significant increases in health care use.
Some changes observed, such as a decline in preventive care visits, could be due to a lack of access to services posttransfer, but may also reflect changes in patterns of health-seeking behavior in young adulthood, such as delays in obtaining primary care services after moving to new communities for education or vocational purposes. Others, such as the decline in admission for CCCs and CMHCs, combined with an increase in high-acuity ED use for those with N-CCCs and CCCs suggest that thresholds for admission and discharge from hospital may differ between the adult and child health care systems. Use of outpatient
services and the ED account for a proportionately smaller amount of cost in children and youth with CCCs,21,22 so these changes may not be
reflected in changes to overall costs.
Our findings differ from those of many studies. Most studies have
focused on patient- (or parent-) reported outcomes, and have consistently reported inadequate support in transfers.3 One large study
of acute care utilization in SCD used population-level administrative data across 8 states, describing a peak in utilization for both ED use and FIGURE 1
Median health system costs by Ontario youth with chronic conditions, before and after transfer from pediatric to adult care. ***P < .001; **P < .01; *P < .05.
FIGURE 2
inpatient use among 18- to 30-year-olds, with lower rates reported in the 10- to 17-year-old age group.23
Differences between these findings and ours may be due to design issues (cross-sectional versus longitudinal), our relatively small SCD sample (n = 155) and/or differences in access, as the US findings varied by insurance status. Another explanation could be the difference in primary care, as 82% of youth in our study had a family physician as a primary care provider; pediatrician primary care may create a “double hit” in transfer.
Another explanation for the lack of changes during transfer was that our study did not allow for a sufficient observation period posttransfer to observe deleterious effects, which may only occur after a lag period of suboptimal care. This is supported by data from Western Australia on type 1 DM that demonstrate peaks in increased standardized mortality ratios in the 25- to 29-year-old age bracket for both men and women.24 However, in a single-center
longitudinal cohort of children with SCD (n = 940), 6 of 7 reported deaths occurred after 18 years of age; median time to death after transfer of 1.2 years (range, 0.2–5.3 years).25
There are a number of important limitations to our study. We lack complete data on private drug and home care coverage, and care from a small number of providers (eg, primary care nurse practitioners in rural areas). Indirect health costs, including those from private insurers and, in particular, those borne by patients and families were not captured. We were unable to assess outcomes of those youth with onset of their chronic medical or psychiatric conditions between the ages 16 and 18 years. Our inclusion criteria for some cohorts (NI, SCD, CHD, and all 3 CMHC groups) were limited to ICD-10 and DSM-IV-TR codes from hospitalizations, missing youth not hospitalized with these conditions.
The sensitivity and specificity of diagnostic codes for these conditions have not been formally assessed. We characterized “complexity” of medical conditions by using 1 framework (multiorgan involvement); an alternative classification system (eg, based on baseline costs), may have placed youth with IBD into the “complex” grouping, although given the relatively small sample size of this group, would have likely not changed our overall findings. We analyzed a variety of relatively high-prevalence chronic conditions, but our list was not exhaustive. We developed mutually exclusive disease categories, but, in the process, may have missed the effects of important comorbidities such as medical and mental health conditions (eg, SLE and MA).26 Subgroups with
small sample sizes may have been underpowered to detect differences, and small differences reported with larger groups (eg, asthma) may be of limited clinical importance. Children who died in the pretransfer period (n = 109) were unable to contribute to posttransfer data, and the overall period of observation included vulnerable periods of transition both before and after age 18. Some subjects may have maintained Ontario residency while obtaining some health services out-of-province as post-secondary students (eg, from university health services), which may have possibly underestimated health care use after transfer. It has been estimated that among the 62% of Canadians who attend post-secondary institutions by age 19,27 only ∼10%
attend out-of-province,28 and many
may still access health care in their home province. Given the stability of health care use across varied sectors of care, it is unlikely that this phenomenon had a substantial effect on outcomes. Last, some youth (eg, those whose care was delivered by a family physician without a pediatric specialist) may not have transferred care to a new provider.
CONCLUSIONS
Patterns of health care use of young adults with childhood-onset chronic conditions may look very similar to the patterns these people exhibited as youth, at least in the short-term. The implication is that quality metrics focused on transfers may need longer observation periods to detect meaningful differences in health system use and that patterns of health service utilization may not accurately reflect the overall health status of this population. Future work with longer time horizons and replication of our study design in other jurisdictions will further illuminate the trajectories of youth with chronic conditions as they traverse into the adult health care system.
ACKNOWLEDGMENT
The authors thank Dr Andrew Redington for his help in assessing the appropriateness of congenital heart disease codes.
ABBREVIATIONS
CCC: complex chronic conditions CF: cystic fibrosis
CHD: congenital heart disease CMHC: chronic mental health
conditions DM: diabetes mellitus
DSM: Diagnostic and Statistical Manual
ED: emergency department IBD: inflammatory bowel disease ICD: international Classification of
Diseases
ICES: Institute for Clinical Evaluative Sciences IQR: interquartile range
MA: mood and affective disorders N-CCC: non-complex chronic
conditions
OHIP: Ontario Health insurance Plan SCD: sickle cell disease
REFERENCES
1. Wise PH. The transformation of child health in the United States: social disparities in child health persist despite dramatic improvements in child health overall. Health Aff. 2004;23(5):9–25
2. Tennant PW, Pearce MS, Bythell M, Rankin J. 20-year survival of children born with congenital anomalies: a population-based study. Lancet. 2010;375(9715):649–656
3. Davis AM, Brown RF, Taylor JL, Epstein RA, McPheeters ML. Transition care for children with special health care needs. Pediatrics. 2014;134(5):900–908
4. Sharma N, O’Hare K, Antonelli RC, Sawicki GS. Transition care: future directions in education, health policy, and outcomes research. Acad Pediatr. 2014;14(2):120–127
5. Prior M, McManus M, White P, Davidson L. Measuring the “triple aim” in transition care: a systematic review.
Pediatrics. 2014;134(6). Available at: www. pediatrics. org/ cgi/ content/ full/ 134/ 6/ e1648
6. Blinder MA, Vekeman F, Sasane M, Trahey A, Paley C, Duh MS. Age-related treatment patterns in sickle cell disease patients and the associated sickle cell complications and healthcare costs. Pediatr Blood
Cancer. 2013;60(5):828–835
7. Nakhla M, Daneman D, To T, Paradis G, Guttmann A. Transition to adult care for youths with diabetes mellitus: fi ndings from a Universal Health Care System. Pediatrics. 2009;124(6).
Available at: www. pediatrics. org/ cgi/ content/ full/ 124/ 6/ e1134
8. Annunziato RA, Emre S, Shneider B, Barton C, Dugan CA, Shemesh E. Adherence and medical outcomes in pediatric liver transplant recipients who transition to adult services.
Pediatr Transplant. 2007;11(6):608–614 9. Samuel SM, Nettel-Aguirre A,
Hemmelgarn BR, et al; Pediatric Renal Outcomes Canada Group. Graft failure and adaptation period to adult healthcare centers in pediatric renal transplant patients. Transplantation. 2011;91(12):1380–1385
10. Singh SP. Transition of care from child to adult mental health services: the great divide. Curr Opin Psychiatry. 2009;22(4):386–390
11. Benchimol EI, Guttmann A, Griffi ths AM, et al. increasing incidence of paediatric infl ammatory bowel disease in Ontario, Canada: evidence from health administrative data. Gut. 2009;58(11):1490–1497
12. Hux JE, Ivis F, Flintoft V, Bica A. Diabetes in Ontario: determination of prevalence and incidence using a validated administrative data algorithm.
Diabetes Care. 2002;25(3):512–516
13. Gershon AS, Wang C, Guan J, Vasilevska-Ristovska J, Cicutto L, To T. Identifying patients with physician-diagnosed asthma in health administrative databases. Can Respir J. 2009;16(6):183–188
14. Levy D, Gunraj N, Pope J, et al. Childhood-onset systemic lupus erythematosus in Ontario: long term
outcomes in a population-based cohort with universal health care coverage.
Arthritis Rheum. 2013;65(10S):S533
15. Levy D, Gunraj N, Berard RA, et al. Long-term outcomes of childhood-onset systemic lupus erythematosus in adulthood. Arthritis Rheum. 2014;66(S3):S198
16. Srivastava R, Downey EC, Feola P, et al. Quality of life of children with neurological impairment who receive a fundoplication for gastroesophageal refl ux disease. J Hosp Med.
2007;2(3):165–173
17. Sevick MA, Trauth JM, Ling BS, et al. Patients with Complex Chronic Diseases: perspectives on supporting self-management. J Gen intern Med. 2007;22(suppl 3):438–444
18. CAEP/ACMU. Canadian Triage and Acuity Scale (CTAS)/prehospital CTAS. Available at: http:// caep. ca/ resources/ ctas. Accessed September 4, 2015 19. Wodchis W, Bushmeneva K, Nikitovic
M, et alGuidelines on person-level costing using administrative databases in Ontario: Working Paper Series. Vol 1. Toronto, Canada: Health System Performance Research Network; 2013
20. Woodchis WP, Austin PC, Henry DA. A 3-year study of high-cost users of health care [published online ahead of print January 11, 2016]. CMAJ. doi: 10. 1503/ cmaj. 150064
21. Neff JM, Sharp VL, Muldoon J, Graham J, Myers K. Profi le of medical charges for children by health status group and severity level in a Washington Address correspondence to Eyal Cohen, MD, Division of Pediatric Medicine, Department of Pediatrics, The Hospital for Sick Children, 555 University Ave, Toronto, ON M5G 1X8, Canada. E-mail: eyal.cohen@sickkids.ca
PEDIATRICS (ISSN Numbers: Print, 0031-4005; Online, 1098-4275). Copyright © 2016 by the American Academy of Pediatrics
FINANCIAL DISCLOSURE: Dr Cohen is supported as the 2015–2016 Commonwealth Fund Harkness/CFHI Fellow in Health Care Policy and Practice. The
Commonwealth Fund is a private independent foundation based in New York City. The views presented here are those of the author and not necessarily those of The Commonwealth Fund, its directors, offi cers, or staff. Dr Guttmann is funded by a CIHR (Canadian Institutes of Health Research) Applied Chair in Child Health Services and Policy Research. The other authors have indicated they have no fi nancial relationships relevant to this article to disclose.
FUNDING SOURCE: This project was completed with support from the Health Systems Performance Research Network and supported by the institute for Clinical
Evaluative Sciences, which is funded by an annual grant from the Ontario Ministry of Health and Long-Term Care. Parts of this material are based on data and information compiled and provided by CIHI (Canadian Institute for Health Information); however, the analyses, conclusions, opinions and statements expressed herein are those of the author, and not necessarily those of CIHI. The opinions, results, and conclusions reported in this paper are those of the authors and are independent from all funding sources. No endorsement by the institute for Clinical Evaluative Sciences or the Ontario Ministry of Health and Long Term Care is intended or should be inferred.
State Health Plan. Health Serv Res. 2004;39(1):73–89
22. Cohen E, Berry JG, Camacho X, anderson G, Wodchis W, Guttmann A. Patterns and costs of health care use of children with medical complexity.
Pediatrics. 2012;130(6). Available at: www. pediatrics. org/ cgi/ content/ full/ 130/ 6/ e1463
23. Brousseau DC, Owens PL, Mosso AL, Panepinto JA, Steiner CA. Acute care utilization and rehospitalizations for sickle cell disease. JAMA. 2010;303(13):1288–1294
24. Cooper MN, de Klerk NH, Jones TW, Davis EA. Clinical and demographic risk factors associated with mortality during early adulthood in a population-based cohort of childhood-onset type 1 diabetes. Diabet Med. 2014;31(12):1550–1558
25. Quinn CT, Rogers ZR, McCavit TL, Buchanan GR. Improved survival of children and adolescents with sickle cell disease. Blood. 2010;115(17):3447–3452 26. Knight A, Weiss P, Morales K, et
al. Depression and anxiety and
their association with healthcare utilization in pediatric lupus and mixed connective tissue disease patients: a cross-sectional study. Pediatr Rheumatol Online J. 2014;12:42 27. Statistics Canada. Postsecondary
Student information System, 2012. Available at: www. statcan. gc. ca/ pub/ 81- 004- x/ 2007002/ 9989- eng. htm. Accessed October 20, 2015
DOI: 10.1542/peds.2015-2734 originally published online February 23, 2016;
2016;137;
Pediatrics
Deborah Levy, Anne L. Stephenson and Astrid Guttmann
Eyal Cohen, Sima Gandhi, Alene Toulany, Charlotte Moore, Longdi Fu, Julia Orkin,
Conditions
Health Care Use During Transfer to Adult Care Among Youth With Chronic
Services
Updated Information &
http://pediatrics.aappublications.org/content/137/3/e20152734
including high resolution figures, can be found at:
References
http://pediatrics.aappublications.org/content/137/3/e20152734#BIBL
This article cites 20 articles, 7 of which you can access for free at:
Subspecialty Collections
sub
http://www.aappublications.org/cgi/collection/transition_adult_care_ Transition to Adult Care
icine_sub
http://www.aappublications.org/cgi/collection/adolescent_health:med Adolescent Health/Medicine
following collection(s):
This article, along with others on similar topics, appears in the
Permissions & Licensing
http://www.aappublications.org/site/misc/Permissions.xhtml
in its entirety can be found online at:
Information about reproducing this article in parts (figures, tables) or
Reprints
http://www.aappublications.org/site/misc/reprints.xhtml
DOI: 10.1542/peds.2015-2734 originally published online February 23, 2016;
2016;137;
Pediatrics
Deborah Levy, Anne L. Stephenson and Astrid Guttmann
Eyal Cohen, Sima Gandhi, Alene Toulany, Charlotte Moore, Longdi Fu, Julia Orkin,
Conditions
Health Care Use During Transfer to Adult Care Among Youth With Chronic
http://pediatrics.aappublications.org/content/137/3/e20152734
located on the World Wide Web at:
The online version of this article, along with updated information and services, is
http://pediatrics.aappublications.org/content/suppl/2016/02/17/peds.2015-2734.DCSupplemental
Data Supplement at:
by the American Academy of Pediatrics. All rights reserved. Print ISSN: 1073-0397.