Physicians’ Opinions on Compensation for Telephone Calls
Paul Clay Sorum, MD, PhD* and Rajiv Mallick, PhD‡
ABSTRACT. Objectives. To describe the attitudes of pediatricians and other physicians practicing in a fee-for-service environment toward compensation for telephone encounters with patients.
Design. Survey by mail.
Participants. The 67 pediatric and 634 other private physicians and medical school faculty of Albany County, NY.
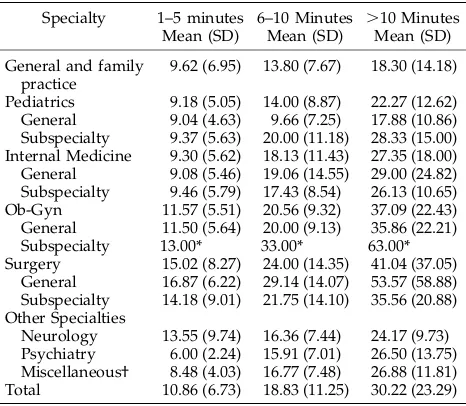
Results. A total of 479 of all the physicians (68.3%) and 55 of the pediatricians (82.1%) returned the question-naire. Of these, 69.9% of the total (95% confidence inter-val, 65.5% to 74.1%) and 58.2% of the pediatricians (95% confidence interval, 44.1% to 71.3%) indicated physicians should be compensated for calls with patients, especially for after-hours calls. This opinion was significantly as-sociated with greater concern about liability for calls, more negative sentiments about after-hours calls, and a longer reported duration of calls. After adjusting for these factors, surgeons and pediatricians were signifi-cantly less likely to favor compensation than the group as a whole. Pediatricians in favor of compensation sug-gested charging a mean of $9.18 (SD $5.05) for 1 to 5 min, $14.00 (SD $8.87) for 6 to 10 min, and $22.27 (SD $12.62) for>10 min. Pediatricians reported documenting in pa-tients’ charts a mean of 35.3% (SD 39.9%) of after-hours calls.
Conclusions. In a mostly noncapitated environment, the majority of pediatricians and other physicians favor compensation for telephone calls with patients. Some specialists, in particular pediatricians and surgeons, are, however, less likely to support this. Additional research into the reasons for these interspecialty differences may help to guide policy decisions on the financing of health care. Pediatrics 1997;99(4). URL: http://www.pediatrics.
org/cgi/content/full/99/4/e3; telephone calls, physician compensation, physician opinion, health care system, survey.
ABBREVIATIONS. CIs, confidence intervals; ROC, Receiver Op-erating Characteristic curve.
Pediatricians and other physicians are seldom compensated for telephone calls with patients. Yet telephone encounters play an important role in med-ical care, especially when the office is closed. They constitute ;20% of all encounters between patients (or their caregivers) and physicians.1–10They provide
patients and caregivers with important reassurance
and advice,11,12 prevent visits to the office or
emer-gency room,8,13–15and enable cost-effective follow-up
of acute and chronic illnesses.16 –18Accordingly, it has
recently been argued19,20 that paying physicians for
telephone encounters, or counting them when mea-suring physicians’ productivity, would have multi-ple beneficial effects. It would give physicians fair compensation for the time, inconvenience, expertise, and liability risk involved in talking with patients by telephone. It could be expected to increase the effi-ciency of providing medical care and to improve the documentation of telephone discussions.
The health care system is, of course, rapidly evolv-ing toward managed care, although payment of phy-sicians by capitation is still far from the norm, especially for specialists.21 As such risk-sharing
ar-rangements with physicians become more common, however, physicians’ incomes and the measures of their productivity will no longer be a function of the numbers of face-to-face encounters with patients, and they will lose the incentive to maximize such encounters. The telephone and eventually other modes of telecommunication are likely to be increas-ingly attractive ways to care for patients. Yet it will be many years, if at all, before most American phy-sicians are paid by pure capitation. In the meantime, they will continue to work within a variety of fee-for-service arrangements in which telephone consul-tations, although a very common part of continuing medical care, are largely uncompensated.
What pediatricians and other physicians think and feel about telephone calls, whether they want to be compensated, and how well they claim they are doc-umenting calls have been little studied. The purpose of this investigation was, therefore, to describe more fully the physicians’ point of view.
MATERIALS AND METHODS Subjects
The subjects of the survey were the physicians of Albany, NY, and its suburbs whose primary reimbursement from patients and third-party payers was through fee for service. These included both the private physicians and the full-time faculty members of the medical school. Although the latter are paid largely by salary, most of the revenues they contribute to the medical school faculty practice plan are compensations for individual services. Albany is a midsize city and the state capital of New York. The majority of its residents are enrolled in managed care plans that compensate physicians through fee for service rather than through capitation.
Research Methods
The survey was mailed to all subjects in early July 1994 along with a return envelope that was already stamped and addressed. A second survey and return envelope were again mailed to all subjects in late August. The questions are listed in the Appendix. From *the Departments of Medicine and Pediatrics, Albany Medical
Col-lege, Albany, New York.
‡Dr Mallick is a senior economist at Pracon, Reston, Virginia. Received for publication Jun 24, 1996; accepted Aug 12, 1996.
Address correspondence to: Paul Sorum, MD, AMC Internal Medicine– Pediatrics, 724 Watervliet-Shaker Road, Latham, NY 12110.
Statistical Analysis
SAS was used to calculate descriptive statistics, simple corre-lations, and multivariate logistic regressions. Statistical signifi-cance was defined as P,.05. All reported confidence intervals (CIs) pertain also to the 95% level of significance.
Descriptive statistics were calculated for the entire sample, for each specialty, and for the subgroups of generalists and subspe-cialists within pediatrics, internal medicine, obstetrics– gynecology, and surgery. The proportions of physicians who favored compen-sation for phone calls as well as of responses to the other variables (representing physicians’ experiences with and attitudes about telephone consultations) were compared across specialties and subgroups.
Differences among physicians in their sentiments about after-hours calls were treated in two different ways. They were sum-marized by aggregating the five individual scores. In addition, however, because these aggregate scores were artificial constructs and because the individual scores were ordinal, rather than inter-val, and were variably linked to each other, the individual scores too were used in the comparative analyses.
Power calculations were performed by Instat software to ex-amine the limitations resulting from the relatively small sizes of some of the specialties and subgroups.
Two multivariate models were then developed: a dichotomous choice (logistic) model to predict the probability of favoring com-pensation for telephone consultations and an ordinary least-squares model to predict the suggested dollar charges among those who wanted compensation. The models were used to infer what variables were independent predictors of physicians’ re-sponses. The models were then examined to determine whether they adequately accounted for the observed between-specialty differences in the proportions favoring compensation and in the amount of compensation desired.
Tests of goodness of fit22and of predictive accuracy (using the
Receiver Operating Characteristic [ROC] curve23) were performed
on the estimated logistic model to determine how well it described individual physicians’ opinions about compensation. The measure of goodness of fit compared the observed and expected propor-tions of “successes” (responses in favor of compensation) at each decile of estimated probability of favoring it. The ROC curve for the model was constructed by plotting the rates of true-positives and false-positives at different cutoff probabilities of favoring compensation. Because only 335 of the respondents answered all the relevant questions, this sample was used for the regression analyses; it did not differ significantly in demographic character-istics from the whole group of respondents.
RESULTS Sample Characteristics
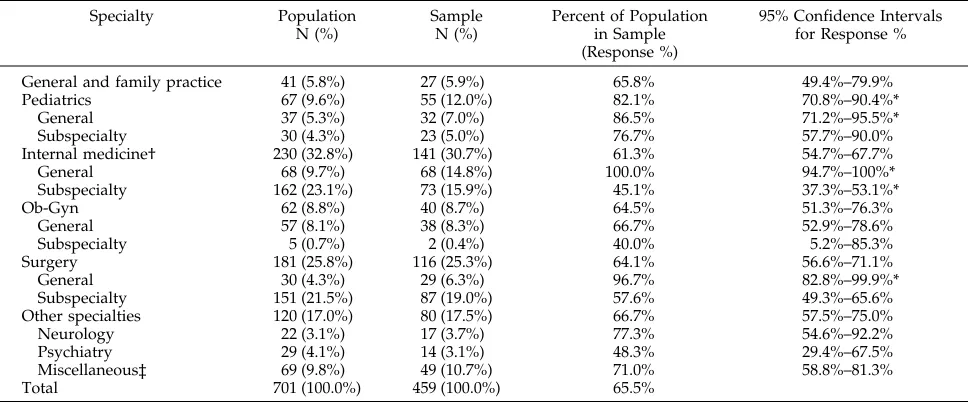
Letters were sent to 701 physicians and returned by 479 (68.3%). The professional identities of the 459 respondents who indicated their medical specialties are compared in Table 1 with those of the entire surveyed population. Pediatricians made up a signif-icantly higher proportion of the respondents than of the whole population (12.0% vs 9.6%).
The medical school faculty were represented equally among the surveyed population and respon-dents (29% of both). Both the population and the respondents were largely male, 84% and 82%, re-spectively. The mean age of respondents was 47.3 years (SD, 10.5); the median, 46; and the range, 31 to 81.
Opinions on Compensation
Only five physicians (1%) reported that they charged for phone calls; these included two inter-nists, an obstetrician, an orthopedist, and a psychia-trist. Overall, 69.9% (95% CI, 65.5% to 74.1%) indi-cated that physicians should be compensated for calls with patients. More specifically, 63.0% of all the respondents indicated patient-initiated calls after hours, 43.2% patient-initiated calls to the office, and 18.4% physician-initiated follow-up calls.
Table 2 shows the responses to the general ques-tion about compensaques-tion according to specialty and groups of specialties. Internists and neurologists were significantly more likely than the combined sample of physicians to favor compensation, and surgeons were less likely. The lower than average percentages of pediatricians and general and family practitioners favoring compensation were not statis-tically significant because of the limited sample sizes.
TABLE 1. Characteristics of Population and Sample
Specialty Population
N (%)
Sample N (%)
Percent of Population in Sample (Response %)
95% Confidence Intervals for Response %
General and family practice 41 (5.8%) 27 (5.9%) 65.8% 49.4%–79.9%
Pediatrics 67 (9.6%) 55 (12.0%) 82.1% 70.8%–90.4%*
General 37 (5.3%) 32 (7.0%) 86.5% 71.2%–95.5%*
Subspecialty 30 (4.3%) 23 (5.0%) 76.7% 57.7%–90.0%
Internal medicine† 230 (32.8%) 141 (30.7%) 61.3% 54.7%–67.7%
General 68 (9.7%) 68 (14.8%) 100.0% 94.7%–100%*
Subspecialty 162 (23.1%) 73 (15.9%) 45.1% 37.3%–53.1%*
Ob-Gyn 62 (8.8%) 40 (8.7%) 64.5% 51.3%–76.3%
General 57 (8.1%) 38 (8.3%) 66.7% 52.9%–78.6%
Subspecialty 5 (0.7%) 2 (0.4%) 40.0% 5.2%–85.3%
Surgery 181 (25.8%) 116 (25.3%) 64.1% 56.6%–71.1%
General 30 (4.3%) 29 (6.3%) 96.7% 82.8%–99.9%*
Subspecialty 151 (21.5%) 87 (19.0%) 57.6% 49.3%–65.6%
Other specialties 120 (17.0%) 80 (17.5%) 66.7% 57.5%–75.0%
Neurology 22 (3.1%) 17 (3.7%) 77.3% 54.6%–92.2%
Psychiatry 29 (4.1%) 14 (3.1%) 48.3% 29.4%–67.5%
Miscellaneous‡ 69 (9.8%) 49 (10.7%) 71.0% 58.8%–81.3%
Total 701 (100.0%) 459 (100.0%) 65.5%
* Response percentage significantly different (P,.05) from entire physician population. The confidence interval for General Internal Medicine is actually 97.5% because only the lower direction is uncertain.
† Ten of the respondents classified as general internists in the sample listed secondary subspecialties, and hence some or all may have been classified as subspecialists in the original population.
Gender, age, and faculty status had no significant effect.
Experience With Calls
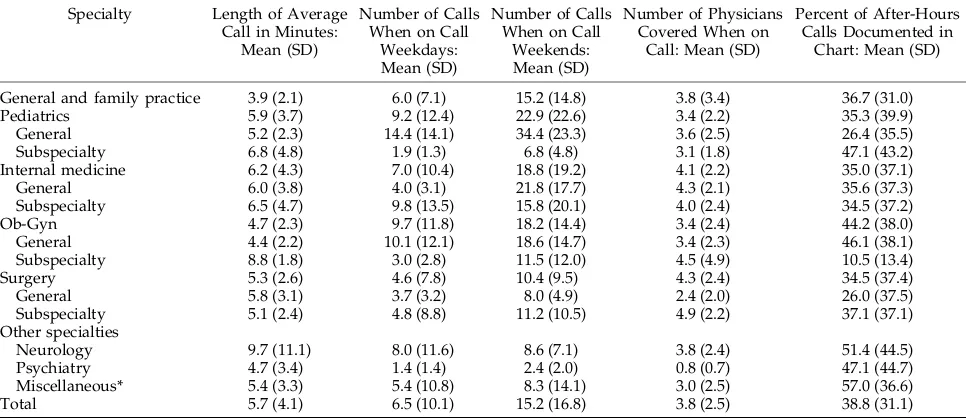
Table 3 lists various types of telephone call expe-riences according to the respondents’ specialties. Variation among individuals was great, as indicated by the large SD values in the table. The overall re-ported length of phone calls averaged 5.7 min (SD, 4.1). The mean estimated numbers of phone calls were 6.5 per weekday night on call and 15.2 per weekend. General pediatricians reported that they spent the same time on each call (5.2 min) and cov-ered the same number of physicians (3.6) as the aggregate of physicians but received significantly more calls when on call on both weekdays (mean,
14.4) and weekends (mean, 34.4). Documentation of after-hours calls is discussed further below.
Sentiments About After-Hours Calls
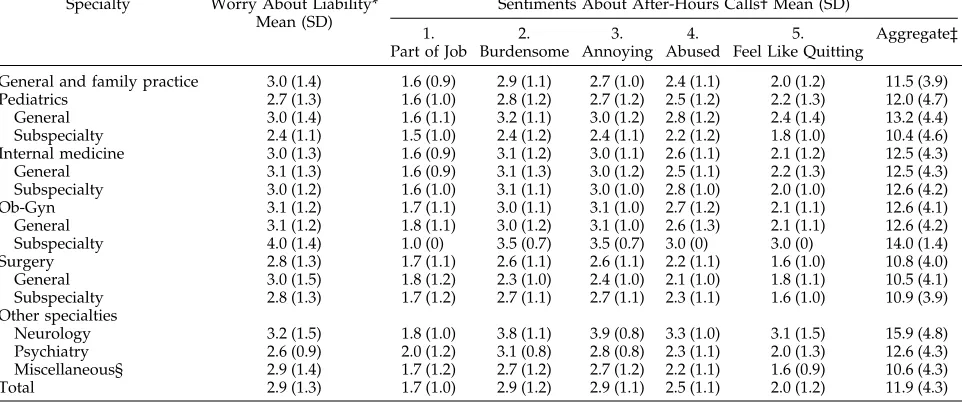
The physicians’ sentiments about after-hours phone calls were assessed on a 1- to 5-point scale in which a higher score indicated more negative feel-ings. Physicians found these calls moderately bur-densome and annoying (medians of 3), although they were less inclined to feel abused by callers (me-dian 2). Degree of annoyance was slightly negatively correlated with age (r5 2.12, P5.02), but not with gender or faculty status. It was positively correlated with duration of call (r5.20, P5.0002) and number of calls on weekends (r 5 .19, P 5 .0006). Table 4 shows the ratings according to specialty.
Pediatri-TABLE 2. Answers to Whether Physicians Should Be Compensated for Calls
Specialty Number of Responses “Yes” Answers (%) 95% Confidence Intervals* P Values†
General and family practice 27 17 (63.0%) 42.4%–80.6% .35
Pediatrics 55 32 (58.2%) 44.1%–71.3% .075
General 32 18 (56.2%) 37.7%–73.6% .14
Subspecialty 23 14 (60.9%) 38.5%–80.3% .25
Internal medicine 141 114 (80.8%)‡ 73.4%–87.0% .004
General 68 54 (79.4%) 67.9%–88.3% .06
Subspecialty 73 60 (82.2%)‡ 71.5%–90.2% .016
Ob-Gyn 40 31 (77.5%) 61.6%–89.2% .24
General 38 30 (78.9%) 62.7%–90.4% .21
Subspecialty 2 1 (50.0%) 1.3%–98.7% .54
Surgery 116 67 (57.8%)‡ 48.2%–66.9% .007
General 29 17 (58.6%) 38.9%–76.5% .16
Subspecialty 87 50 (57.5%)‡ 46.4%–68.0% .002
Other specialties 80 58 (72.5%) 61.4%–81.9% .20
Neurology 17 16 (94.1%)‡ 71.3%–99.9% .03
Psychiatry 14 12 (85.7%) 57.2%–98.2% .20
Miscellaneous 49 30 (61.2%) 46.2%–74.8% .20
Total 459 321 (69.9%)
* Based on binomial distribution with continuity correction (normal approximation). If the specialty is representative of the population of all responding physicians, one can be 95% certain that the proportion of favorable responses in the physician population lies within the 95% confidence interval of that specialty.
† For the difference between the specialty’s proportion of favorable responses and that of the total respondents (using the continuity-corrected binomial distribution).
‡ Significantly different (P,.05) from proportion of physicians as a whole favoring compensation.
TABLE 3. Physicians’ Experiences With Calls Specialty Length of Average Call in Minutes:
Mean (SD)
Number of Calls When on Call
Weekdays: Mean (SD)
Number of Calls When on Call
Weekends: Mean (SD)
Number of Physicians Covered When on
Call: Mean (SD)
Percent of After-Hours Calls Documented in
Chart: Mean (SD)
General and family practice 3.9 (2.1) 6.0 (7.1) 15.2 (14.8) 3.8 (3.4) 36.7 (31.0)
Pediatrics 5.9 (3.7) 9.2 (12.4) 22.9 (22.6) 3.4 (2.2) 35.3 (39.9)
General 5.2 (2.3) 14.4 (14.1) 34.4 (23.3) 3.6 (2.5) 26.4 (35.5)
Subspecialty 6.8 (4.8) 1.9 (1.3) 6.8 (4.8) 3.1 (1.8) 47.1 (43.2)
Internal medicine 6.2 (4.3) 7.0 (10.4) 18.8 (19.2) 4.1 (2.2) 35.0 (37.1)
General 6.0 (3.8) 4.0 (3.1) 21.8 (17.7) 4.3 (2.1) 35.6 (37.3)
Subspecialty 6.5 (4.7) 9.8 (13.5) 15.8 (20.1) 4.0 (2.4) 34.5 (37.2)
Ob-Gyn 4.7 (2.3) 9.7 (11.8) 18.2 (14.4) 3.4 (2.4) 44.2 (38.0)
General 4.4 (2.2) 10.1 (12.1) 18.6 (14.7) 3.4 (2.3) 46.1 (38.1)
Subspecialty 8.8 (1.8) 3.0 (2.8) 11.5 (12.0) 4.5 (4.9) 10.5 (13.4)
Surgery 5.3 (2.6) 4.6 (7.8) 10.4 (9.5) 4.3 (2.4) 34.5 (37.4)
General 5.8 (3.1) 3.7 (3.2) 8.0 (4.9) 2.4 (2.0) 26.0 (37.5)
Subspecialty 5.1 (2.4) 4.8 (8.8) 11.2 (10.5) 4.9 (2.2) 37.1 (37.1)
Other specialties
Neurology 9.7 (11.1) 8.0 (11.6) 8.6 (7.1) 3.8 (2.4) 51.4 (44.5)
Psychiatry 4.7 (3.4) 1.4 (1.4) 2.4 (2.0) 0.8 (0.7) 47.1 (44.7)
Miscellaneous* 5.4 (3.3) 5.4 (10.8) 8.3 (14.1) 3.0 (2.5) 57.0 (36.6)
Total 5.7 (4.1) 6.5 (10.1) 15.2 (16.8) 3.8 (2.5) 38.8 (31.1)
cians did not differ from the aggregate in spite of receiving the largest number of calls. Neurologists, however, appear to have been significantly more upset about after-hours calls than other physicians, and surgeons less upset.
Most physicians, however, felt that receiving after-hours calls, no matter how unpleasant, was part of their job (median 1) and did not make them “want to quit” (median 2). Nonetheless, a substantial minority (13.1% of the total and 31.3% of the general pediatri-cians) did report that these calls made them want to quit (ie, gave ratings of 4 or 5 on this item). These included 5 of the 7 faculty general pediatricians (71%) and 5 of the 20 private general pediatricians (20%) (relative risk, 3.6; 95% CI, 1.4 to 8.9).
Concern About Liability
Concern about liability for phone calls was mod-erate. On a scale of 15not at all to 55a great deal, the median degree of worry was 3 (interquartile range, 2). As shown in Table 4, there were no signif-icant differences across specialties. Degree of worry was mildly negatively correlated with age (r5 2.17, P 5 .0004) and with faculty status (r 5 2.13, P 5 .005). It was quite strongly associated with degree of annoyance with after-hours calls (r5.35, P5.0001).
Regression Analysis of Favoring Compensation
Multivariate logistic analysis identified three fac-tors as independent predicfac-tors of physicians’ desire for compensation for telephone consultations: rat-ings of concern about liability for calls, aggregate ratings of sentiments about after-hours calls, and average length of calls (Table 5). An incremental increase on the 5-point rating scale for liability was associated with 1.55 (95% CI, 1.24 to 1.93) times
greater odds of favoring compensation. In other words, a physician who rated his or her concern about liability at 5 had an odds of favoring compen-sation 5.76 (95% CI, 2.36 to 13.87) times as great as a physician who rated liability concern at only 1. Nei-ther the number of calls received when on call (on weekdays or weekends) nor the number of physi-cians covered while on call was significantly associ-ated with the probability of favoring compensation. Both measures of statistical fit demonstrated that the estimated logistic model described quite well physicians’ opinions on compensation. The Hosmer– Lemeshowx2statistic computed for the test of
good-ness of fit was 4.36, with a corresponding P value of .82. The calculated area under the ROC curve was .81. The actual percentages of pediatricians and sur-geons who favored compensation, however, were too low to be explained by the model (ie, they lay below the 95% CI for the predicated values). It is very likely, therefore, that factors other than those evalu-ated in this survey are important in explaining the differences among specialties in their opinions about compensation for telephone encounters.
Suggested Charges
Of the 198 respondents who wanted to charge for telephone consultations and also suggested dollar amounts to charge, the mean suggested charges, as shown in Table 6, were $10.86 for 1 to 5 min (SD, $6.73), $18.83 for 6 to 10 min (SD, $11.25), and $30.22 for.10 min (SD, $23.29). These correspond to;$2 to $2.50 per minute. The large SD values reflect the considerable differences among individual physi-cians. In general, pediatricians proposed lower com-pensations for telephone calls than physicians in higher-earning specialties, particularly surgeons,
al-TABLE 4. Physicians’ Attitudes Toward Calls Specialty Worry About Liability*
Mean (SD)
Sentiments About After-Hours Calls† Mean (SD)
1. Part of Job
2. Burdensome
3. Annoying
4. Abused
5. Feel Like Quitting
Aggregate‡
General and family practice 3.0 (1.4) 1.6 (0.9) 2.9 (1.1) 2.7 (1.0) 2.4 (1.1) 2.0 (1.2) 11.5 (3.9)
Pediatrics 2.7 (1.3) 1.6 (1.0) 2.8 (1.2) 2.7 (1.2) 2.5 (1.2) 2.2 (1.3) 12.0 (4.7)
General 3.0 (1.4) 1.6 (1.1) 3.2 (1.1) 3.0 (1.2) 2.8 (1.2) 2.4 (1.4) 13.2 (4.4)
Subspecialty 2.4 (1.1) 1.5 (1.0) 2.4 (1.2) 2.4 (1.1) 2.2 (1.2) 1.8 (1.0) 10.4 (4.6)
Internal medicine 3.0 (1.3) 1.6 (0.9) 3.1 (1.2) 3.0 (1.1) 2.6 (1.1) 2.1 (1.2) 12.5 (4.3)
General 3.1 (1.3) 1.6 (0.9) 3.1 (1.3) 3.0 (1.2) 2.5 (1.1) 2.2 (1.3) 12.5 (4.3)
Subspecialty 3.0 (1.2) 1.6 (1.0) 3.1 (1.1) 3.0 (1.0) 2.8 (1.0) 2.0 (1.0) 12.6 (4.2)
Ob-Gyn 3.1 (1.2) 1.7 (1.1) 3.0 (1.1) 3.1 (1.0) 2.7 (1.2) 2.1 (1.1) 12.6 (4.1)
General 3.1 (1.2) 1.8 (1.1) 3.0 (1.2) 3.1 (1.0) 2.6 (1.3) 2.1 (1.1) 12.6 (4.2)
Subspecialty 4.0 (1.4) 1.0 (0) 3.5 (0.7) 3.5 (0.7) 3.0 (0) 3.0 (0) 14.0 (1.4)
Surgery 2.8 (1.3) 1.7 (1.1) 2.6 (1.1) 2.6 (1.1) 2.2 (1.1) 1.6 (1.0) 10.8 (4.0)
General 3.0 (1.5) 1.8 (1.2) 2.3 (1.0) 2.4 (1.0) 2.1 (1.0) 1.8 (1.1) 10.5 (4.1)
Subspecialty 2.8 (1.3) 1.7 (1.2) 2.7 (1.1) 2.7 (1.1) 2.3 (1.1) 1.6 (1.0) 10.9 (3.9)
Other specialties
Neurology 3.2 (1.5) 1.8 (1.0) 3.8 (1.1) 3.9 (0.8) 3.3 (1.0) 3.1 (1.5) 15.9 (4.8)
Psychiatry 2.6 (0.9) 2.0 (1.2) 3.1 (0.8) 2.8 (0.8) 2.3 (1.1) 2.0 (1.3) 12.6 (4.3)
Miscellaneous§ 2.9 (1.4) 1.7 (1.2) 2.7 (1.2) 2.7 (1.2) 2.2 (1.1) 1.6 (0.9) 10.6 (4.3)
Total 2.9 (1.3) 1.7 (1.0) 2.9 (1.2) 2.9 (1.1) 2.5 (1.1) 2.0 (1.2) 11.9 (4.3)
The number of answers to each question was slightly less than the total number of respondents; ie, a few of the respondents did not answer one or more of these questions.
* Rating of worry about liability for phone calls on scale from 15not at all to 55a great deal.
† Rating of reactions to after-hours phone calls on scale of 1 to 5 of increasingly negative reactions: 1. 15an expected part of my job, 55 not a part of my job; 2. 15not burdensome, 55very burdensome; 3. 15not annoying, 55very annoying; 4. 15I do not feel abused by callers, 55I feel abused by callers; 5. 15these calls do not make me feel like quitting, 55they make me feeling like quitting. ‡ Sum of the five reactions to after-hours calls.
though the differences among specialties were not statistically significant.
A regression analysis showed that among the fac-tors surveyed, concern about liability had the largest impact on suggested charges. Every 1-point increase in the rating on concern about liability was associ-ated with a suggested charge that was higher by $1.33 (95% CI, $.53 to $2.12) for 1- to 5-min calls, by $2.16 ($.94 to $3.35) for 6- to 10-min calls, and by $2.55 ($.58 to $4.51) for calls of.10 min. Sentiments about after-hours calls had, after adjustment for the other variables, no impact on suggested charges. In addition, no correlation was found between amount of charges and a respondent’s age, sex, or faculty status.
Documentation of After-Hours Calls
As shown in Table 3, the percentage of after-hours phone calls that the physicians reportedly docu-mented in the patients’ charts (based on the 432 who
answered this question) was not high; the mean was 38.8% (SD, 38.2%) and the median 20% (interquartile range, 5% to 75%). The responses were widely spread; some physicians document well (24.8% esti-mated $75%), more document poorly (56.5% re-ported#25%).
A report of more complete documentation of after-hours calls was associated with a greater concern about liability for calls (P 5 .0005), holding other factors constant. Yet, even those who worried most about liability were likely to leave most calls undoc-umented; of those who rated their worry at 4 or 5, the mean reported rate of documentation was still only 45.5%. The percentage of documented calls was as-sociated negatively with the number of calls received on weekdays (P 5 .03). Multivariate analysis re-vealed that after controlling for concern with liability and number of weekday calls, no significant be-tween-specialty differences remained in the propor-tion of after-hours calls that pediatricians and other physicians said they documented in their patients’ charts.
DISCUSSION
The physicians’ descriptions of their on-call tele-phone experiences were in accord with the observa-tions of other investigators. The reported average number of phone encounters when on call (Table 3) was 6.5 on weekdays and 15.2 on weekends, or an average of 1.7 and 4 calls per physician covered. General pediatricians reported the highest number of calls: 14.4 on weekdays and 34.4 on weekends (or 4 and 9.6 per physician covered). These rates are sim-ilar to those in other studies.11,14,24 –27The length of an
average call (Table 3) was slightly longer than that found in the comprehensive Robert Wood Johnson study:125.7 min for the whole group (vs 4.6 min in
the Robert Wood Johnson study) and 5.9 (vs 3.9) for pediatricians. Other investigators11,14,24 –26 have also
reported shorter durations of calls than the estimates made by the survey respondents.
Most physicians in the Albany area stated that they should be compensated for at least some
tele-TABLE 6. Dollar Charges Suggested by Physicians Who Favor Compensation
Specialty 1–5 minutes Mean (SD)
6–10 Minutes Mean (SD)
.10 Minutes Mean (SD)
General and family practice
9.62 (6.95) 13.80 (7.67) 18.30 (14.18)
Pediatrics 9.18 (5.05) 14.00 (8.87) 22.27 (12.62) General 9.04 (4.63) 9.66 (7.25) 17.88 (10.86) Subspecialty 9.37 (5.63) 20.00 (11.18) 28.33 (15.00) Internal Medicine 9.30 (5.62) 18.13 (11.43) 27.35 (18.00) General 9.08 (5.46) 19.06 (14.55) 29.00 (24.82) Subspecialty 9.46 (5.79) 17.43 (8.54) 26.13 (10.65) Ob-Gyn 11.57 (5.51) 20.56 (9.32) 37.09 (22.43) General 11.50 (5.64) 20.00 (9.13) 35.86 (22.21)
Subspecialty 13.00* 33.00* 63.00*
Surgery 15.02 (8.27) 24.00 (14.35) 41.04 (37.05) General 16.87 (6.22) 29.14 (14.07) 53.57 (58.88) Subspecialty 14.18 (9.01) 21.75 (14.10) 35.56 (20.88) Other Specialties
Neurology 13.55 (9.74) 16.36 (7.44) 24.17 (9.73) Psychiatry 6.00 (2.24) 15.91 (7.01) 26.50 (13.75) Miscellaneous† 8.48 (4.03) 16.77 (7.48) 26.88 (11.81) Total 10.86 (6.73) 18.83 (11.25) 30.22 (23.29)
* The responses of the only one who favored compensation. † As defined in Table 1.
TABLE 5. Regression Model for Favoring Compensation
Independent Predictor Estimated Coefficient Wald’sx2
Statistic
Probability.x2
(P Value)
Odds Ratio (95% Confidence Intervals)
Intercept 21.923* 14.00 .0002 0.146 (0.053, 0.40)
Volume
Calls per weekday 2.00002 .000 .9989 1.000 (0.97, 1.03)
Calls per weekend 2.0032 .132 .716 0.997 (0.98, 1.01)
Number of physicians covered when on call
.0210 .125 .723 1.021 (0.91, 1.15)
Duration
Average length of call .1073† 4.512 .0336 1.113 (1.01, 1.23)
Liability concern
Rating on liability .4380* 15.339 .0001 1.550 (1.24, 1.93)
Sentiments
Rating on attitude towards after-hours calls
.0855† 6.148 .0132 1.089 (1.02, 1.17)
22*(Log-likelihood) 46.906
(P5.0001) Number of observations 335 (yes5236; no599)
phone calls with patients. The inverse may, however, be more surprising: 30% of all physicians and 42% of pediatricians did not think that they should be paid for telephone encounters, even though they know from experience that dealing with patients by tele-phone involves time, risk, and, often, inconvenience. Of those who did favor compensation, 89.6% af-firmed this for patient calls after hours, 61.7% for patient calls during office hours, but only 26.3% for follow-up calls initiated by the physicians. They ap-pear to see telephone access as part of the routine services offered to all patients who join a medical practice.28 Accordingly, even most of the
respon-dents who favored compensation for after-hours calls felt that such encounters were “an expected part of my job.” Most pediatricians and other physicians may agree with the designers of Medicare’s resource-based relative value scale29 that follow-up calls are
part of the service already charged for in the office visits.
Opinions about compensation differed among spe-cialties. Internists and neurologists were more likely than physicians as a whole to want payment for telephone encounters (80.8% and 94.1%, respective-ly). Part of the variation can be accounted for by differences among specialties in those factors that were important independent predictors of whether individual physicians would favor compensation (such as worry about liability, sentiments about after-hours calls, and average duration of calls). In particular, neurologists were most upset by after-hours calls and reported the longest duration of calls. Yet, after adjusting for these factors, pediatricians and surgeons emerged as significantly less likely than physicians as a whole to want payment for telephone encounters.
This study provides no explanation of these resid-ual differences among specialties. Nonetheless, it is easy to speculate about their sources. Surgeons may be accustomed to reimbursement for procedures rather than for talking. Moreover, many of the calls to them will concern these procedures (especially postoperatively), for which a single charge often in-cludes the surrounding care; they are less likely than primary care physicians to be called by a patient about a new problem. Pediatricians, on the other hand, must give advice continually to parents on a multiplicity of important and unimportant topics and see this as part of their role. They may, in addi-tion, be more sensitive than other physicians to the risks to their patients of any restrictions on access to care.
Making after-hours telephone care available to their patients does not necessarily mean that physi-cians must provide it themselves. Solo or small-group practitioners routinely share call with others. Furthermore, in Denver,2682% of the pediatricians in
private practice have subscribed, for at least some of their after-hours time periods, to an after-hours tele-phone service that manages their patients’ calls. The 18% who did not subscribe said that their patients’ parents “expected and needed” them to be available to provide advice after hours. Such a telephone ser-vice has been set up recently in Albany as well.
Physicians who want their patients to have after-hours access but who also find answering after-after-hours calls a burden would be expected both to desire compensation for such calls and to be willing to pay to avoid the burden.
Almost all respondents indicated that no matter how unpleasant it was to receive after-hours calls, it was a part of their job. Nonetheless, some were, of course, more annoyed than others; 13% of the total and 31% of the general pediatricians reported that these calls made them want to cease practicing. Sim-ilarly, other investigators have reported that;25% of after-hours calls provoke hostile feelings.11,24
Al-though it is alarming that after-hours calls make so many general pediatricians think about quitting, this reaction was less prevalent among the community pediatricians (20%) than among the full-time faculty (71%). It is unknown how many pediatricians and other physicians actually retire from or change their practices to avoid after-hours calls.
Pediatricians as well as other physicians, espe-cially those who receive a large volume of calls, admit that they do a poor job of documenting after-hours calls in patients’ charts. Similarly in Denver, 71% of pediatricians reported documenting “select-ed” calls in patients’ charts, but only 43% did “most” calls.26 This deficiency is understandable because of
the inconvenience and expense involved in such doc-umentation. Physicians are, however, constantly re-minded and are surely well aware of the benefits of good documentation, namely to improve continuity of care and to decrease liability risks.30,31 Indeed,
those who are highly concerned about their liability for phone calls do claim to document these calls more frequently than other physicians; nonetheless, even they report documenting less than half their calls.
Shortcomings
The study has, of course, a variety of shortcom-ings. First, the sample may be unrepresentative of physicians as a whole. The 32% of the private phy-sicians and medical school faculty who did not reply may differ in a systematic fashion from the responders. It is possible that those who want a change–ie, those who would like compensation for phone calls–would be more likely to send back the questionnaire. Further-more, Albany area physicians may differ from physi-cians in other parts of the country and in more rural or more urban settings. Second, as already pointed out, the power to detect meaningful differences was low within the less common specialties, such as the neurol-ogists and psychiatrists, and within the subgroups of generalists and specialists. Both of these shortcomings could be remedied by a much larger, multiarea survey, although at the risk of obtaining a smaller percentage of respondents among physicians who had no ties to the investigators.
probing questionnaire would, however, have had a lower rate of response.
Implications
The findings of this study support the recent ar-guments19,20 for compensating physicians for
tele-phone calls with patients. First, the large majority of pediatricians as well as other physicians would wel-come such a policy. Second, telephone encounters have many of the characteristics of the office and hospital encounters for which physicians are rou-tinely paid. When called by patients or their caretak-ers and even when making follow-up calls, physi-cians typically take histories, make tentative diagnoses, propose management plans, and offer ad-vice. The significant predictors of favoring compen-sation for phone calls such as worry about liability, feelings about receiving calls, and duration of tele-phone encounters are equivalent to the stress and time dimensions of work that physicians rated when the resource-based relative value scale was con-structed.32Furthermore, when physicians suggested
rates of compensation, they exhibited a conception of the monetary value of their time that was consistent with the current resource-based relative value scale for office visits. The suggested charges of;$2 to $2.5 per min are close for most physicians to their per-sonal contribution to the charges for office visits (ie, after subtracting the staff’s time and the overhead). Members of higher-earning specialties proposed higher compensations for telephone calls, even if not fully equivalent to their higher incomes.
Third, compensating telephone encounters is likely to have a favorable impact on the nature, cost, and outcome of medical care. The low level of doc-umentation of after-hours calls could be expected to rise if physicians had a financial incentive to do this. When physicians charge for encounters with pa-tients, however they take place, they must be able to provide third-party payers with documentation to support their claims. Moreover, telephone encoun-ters are efficient and inexpensive and, therefore, can save time and money for the patients and third-party payers whenever they are as effective as office or emergency room visits.17,18Patients and their
caregiv-ers realize that telephone access to physicians bene-fits them, and, as physicians and their staffs are well aware, frequently want to substitute telephone for office care. In the context of a questionnaire about otitis media, $25 was the median amount that 148 parents bringing their children to a suburban office reported they would be willing to pay to avoid an office visit (Sorum PC, unpublished data, 1995). Fur-thermore, the policy might well be extended to phy-sicians’ telephone consultations with other doctors. Even without the availability of full telemedicine capabilities, it is frequently more cost-effective for a primary care physician to talk with a specialist by telephone than to send the patient.
Like office visits, telephone encounters with pa-tients could be compensated according to their com-plexity, not their duration. It would be simpler, how-ever, to start with a payment schedule based on contact time. The physicians’ proposals of dollar
amounts (Table 6) can serve as a basis for establish-ing a suitable schedule, with an extra charge to cover the administrative costs associated with billing for and keeping records of telephone calls. A payment schedule of $15 for 1 to 5 min, $25 for 6 to 10 min, and $35 for .10 min would seem not only fair but also acceptable to physicians. The expense should be borne largely or fully by third-party payers so that parents are not dissuaded from calling when they should.20
It appears that pediatricians, parents, and third-party payers should all welcome incentives to phy-sicians to provide more acute and follow-up care over the telephone. Until capitation transforms how physicians’ income and productivity are de-termined, such incentives will be in the form of monetary and nonmonetary compensation for tele-phone encounters. Payments to physicians will be cost-effective, as long as any actual charges to patients and families do not limit telephone access unduly and as long as physicians and patients use the telephone judiciously.
APPENDIX Physician Questionnaire
1. Your specialty. Age. Sex. Are you a full-time faculty member at Albany Med?
2. Do you charge for telephone calls?
3. Should physicians be compensated for calls with pa-tients? For what types? Check as many as you consider appropriate: patient-initiated, during office hours? pa-tient-initiated, after office hours? physician-initiated, follow-up? other? if so, what?
4. How much should be charged for a call lasting 1 to 5 min? 6 –10 min?.10 min?
5. How many minutes does an average phone call with a patient last?
6. When you are on call, how many physicians do you cover?
7. On average, how many phone calls do you receive from patients per week-day night on call? per weekend on call?
8. Rate on a scale of 1 to 5 your reactions to after-hours phone calls.
1 5
a. an expected part of my job not a part of my job
b. not burdensome very burdensome
c. not annoying very annoying
d. I do not feel abused by I feel abused by
callers these calls
e. these calls do not make me they make me feel like quitting feel like quitting 9. What percentage of after-hours calls do you document
in the chart?
10. Rate from 1 to 5 how much you worry about liability for phone calls, where 15not at all and 55a great-deal.
ACKNOWLEDGMENTS
REFERENCES
1. Mendenhall RC. Medical Practice in the United States. A Special Report of
the Robert Wood Johnson Foundation. Princeton, NJ: Robert Wood Johnson
Foundation; 1981
2. Curtis P, Talbot A. The telephone in primary care. J Community Health. 1981;6:194 –203
3. National Center for Health Statistics. Physician Visits. Volume and
Inter-val Since Last Visit, United States, 1980. Vital and Health Statistics, Series
10, No. 144. DHHS Publication No. (PHS)83-1572. Washington, DC: US Government Printing Office; 1983
4. National Center for Health Statistics. Current Estimates from the National
Health Interview Survey: United States, 1982. Vital and Health Statistics,
Series 10, No. 150. DHHS Publication No. (PHS)85-1578. Washington, DC: US Government Printing Office; 1985
5. National Center for Health Statistics. Physician Contacts by
Sociodemo-graphic and Health Characteristics, United States, 1982– 83. Vital and
Health Statistics, Series 10, No. 161. DHHS Publication No. (PHS)87-1589. Washington, DC: US Government Printing Office; 1987 6. Roghmann KJ, Hoekelman RA, McInerny TK. The changing pattern of
primary pediatric care: update for one community. Pediatrics. 1984;73: 363–374
7. Solberg LI, Mayer TR, Seifert MH Jr, Cole PM, Holloway RL. Office telephone calls in family practice. J Fam Pract. 1984;18:609 – 616 8. Spencer DC, Daugird AJ. The nature and content of physician telephone
calls in a private practice. J Fam Pract. 1988;27:201–205
9. Johnson BE, Johnson CA. Telephone medicine: a general internal med-icine experience. J Gen Intern Med. 1990;5:234 –239
10. Perkins A, Gagnon R, deGruy F. A comparison of after-hours telephone calls concerning ambulatory and nursing home patients. J Fam Pract. 1993;37:247–250
11. Curtis P, Talbot A. The after-hours call in family practice. J Fam Pract. 1979;9:901–909
12. Radecki SE, Neville RE, Girard RA. Telephone patient management by primary care physicians. Med Care. 1989;27:817– 822
13. Fischer PM, Smith SR. The nature and management of telephone utili-zation in a family practice setting. J Fam Pract. 1979;8:321–327 14. Mayer TR, Solberg L, Seifert M, Cole P. After-hours telephone calls in
private family practice. J Fam Pract. 1983;17:327–332
15. Evens S, Curtis P, Talbot A, Baer C, Smart A. Characteristics and perceptions of after-hours callers. Fam Pract. 1985;2:10 –16
16. Greenlick MR, Freeborn DK, Gambill GL, Pope CR. Determinants of medical care utilization: the role of the telephone in total medical care.
Med Care. 1973;11:121–134
17. Bertera EM, Bertera RL. The cost-effectiveness of telephone vs clinic counseling for hypertensive patients: a pilot study. Am J Public Health. 1981;71:626 – 629
18. Wasson J, Gaudette C, Whaley F, Sauvigne A, Baribeau P, Welch HG. Telephone care as a substitute for routine clinic follow-up. JAMA. 1993;267:1788 –1793
19. Braithwaite SS, Unferth NO. Phone fees: a justification of physician charges. J Clin Ethics. 1993;4:219 –224
20. Sorum PC. Compensating physicians for telephone calls. JAMA. 1994; 272:1949 –1950
21. Gold MR, Hurley R, Lake T, Ensor T, Berenson R. A national survey of the arrangements managed-care plans make with physicians. N Engl
J Med. 1995;333:1678 – 83
22. Hosmer D, Lemeshow S. Applied Logistic Regression. New York, NY: John Wiley and Sons; 1989
23. Hanley JA, McNeil BL. The meaning and use of the area under a receiver operating characteristic (ROC) curve. Radiology. 1982;143:29 –36 24. Caplan SE, Orr ST, Skulstad JR, Charney E. After-hours telephone use in urban pediatric primary care centers. Am J Dis Child. 1983;137:879 – 882 25. Poole SR, Schmitt BD, Carruth T, Peterson-Smith A, Slusarsk M. After-hours telephone coverage: the application of an area-wide telephone triage and advice system for pediatric practices. Pediatrics. 1993;92:670–679 26. Fosarelli P, Schmitt B. Telephone dissatisfaction in pediatric practice:
Denver and Baltimore. Pediatrics. 1987;80:28 –31
27. Peters RM. After-hours telephone calls to general and subspecialty internists. J Gen Intern Med. 1994;9:554 –557
28. Isaacman DJ. Telephone fees: are they worth it? J Clin Ethics. 1993;4: 271–273
29. Hsiao WC, Braun P, Dunn D, Becker ER. Resource-based relative values: an overview. JAMA. 1988;260:2347–2353
30. Daugird AJ, Spencer DC. Patient telephone call documentation: quality implications and an attempted intervention. J Fam Pract. 1988;27: 420 – 421
31. Katz HP, Wick W. Malpractice, meningitis, and the telephone. Pediatr
Ann. 1991;20:85– 89
DOI: 10.1542/peds.99.4.e3
1997;99;e3
Pediatrics
Paul Clay Sorum and Rajiv Mallick
Physicians' Opinions on Compensation for Telephone Calls
Services
Updated Information &
http://pediatrics.aappublications.org/content/99/4/e3
including high resolution figures, can be found at:
References
http://pediatrics.aappublications.org/content/99/4/e3#BIBL
This article cites 27 articles, 3 of which you can access for free at:
Permissions & Licensing
http://www.aappublications.org/site/misc/Permissions.xhtml
entirety can be found online at:
Information about reproducing this article in parts (figures, tables) or in its
Reprints
http://www.aappublications.org/site/misc/reprints.xhtml
DOI: 10.1542/peds.99.4.e3
1997;99;e3
Pediatrics
Paul Clay Sorum and Rajiv Mallick
Physicians' Opinions on Compensation for Telephone Calls
http://pediatrics.aappublications.org/content/99/4/e3
on the World Wide Web at:
The online version of this article, along with updated information and services, is located
American Academy of Pediatrics. All rights reserved. Print ISSN: 1073-0397.