Fuzzy Based Graph Cut Classification of
Hyper-Spectral Image
Kavitha Devi.K Kamatchi.P
Assistant Professor UG Scholar
Department of Electronics and Communication Engineering Department of Electronics and Communication Engineering Christian college of Engg & Tech, Oddanchatram Christian college of Engg & Tech, Oddanchatram
Shanmugapriya.M Sujatha.V
UG Scholar Assistant Professor
Department of Electronics and Communication Engineering Department of Electronics and Communication Engineering Christian college of Engg & Tech, Oddanchatram Christian college of Engg & Tech, Oddanchatram
Sugapriya.K UG Scholar
Department of Electronics and Communication Engineering Christian college of Engg & Tech, Oddanchatram
Abstract
Image segmentation is an important image processing technique which is used to analyze what is inside the image. Image segmentation is used to separate an image into several “meaningful” parts. It is an old research, there is still no robust solution toward it. There are two main reasons, the first is that the content variety of images is too large, and the second one is that there is no benchmark standard to judge the performance. In this project we develop to segment the image in a better way in this project we use to get a better segmented Image. Here we used this graph cut technique to solve the image segmentation problem. And we got successful results in partitioning an in image. In this method we use an efficient computational technique based on the eigenvalues and eigenvectors to get an optimized segmented Image. We have applied this approach to segment the static images. Keywords: Hyper-Spectral Image, AIN, LASSO
________________________________________________________________________________________________________
I. INTRODUCTION
Classification or segmentation of hyper-spectral images is a perennial topic in remote sensing Imaging. The integration of the spatial and the spectral information is a research focus in hyper-spectral classification. In order to improve the classification rate, the segmentation followed with the classification method is proposed. We all know that every image is a set of pixels. And partitioning those pixels on the basis of the similar characteristics they have is called segmentation dividing an image into sub partitions on the basis of some similar characteristics like color, intensity and texture is called image segmentation. The goal of segmentation is to change the representation of an image into something more meaningful and easier to analyze. Image segmentation is normally used to locate objects and boundaries that is lines, curves, etc. in images Segmentation can be done by detecting edges or points or line in the image. Image classification refers to the task of extracting information classes from a multiband raster image. The resulting raster from image classification can be used to create thematic maps. Depending on the interaction between the analyst and the computer during classification, there are two types of classification: supervised and unsupervised.
(IJSTE/ Volume 2 / Issue 10 / 061)
II. PROPOSED METHOD
The aim of pre-processing is an improvement of the image data that suppresses undesired distortions or enhances some image features relevant for further processing and analysis task. Fuzzy segmentation reduces the edge degradation by introducing the weights of pixels within local neighbor windows.
An improved model for RF is the conditional random field, modeling the posterior of labels given the training data set. GC algorithm is its effective integration of the spectral and the spatial Information. The combination of Fuzzy with the Graph cut approach is proposed to enhance the classification rate.
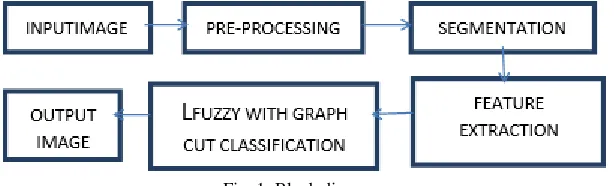
Fig. 1: Block diagram
Pre-Processing
Image pre-processing can significantly increase the reliability of an optical inspection. Several filter operations which intensify or reduce certain image details enable an easier or faster evaluation. Users are able to optimize a camera image with just a few clicks.
Segmentation
Image segmentation is the process of partitioning a digital image into multiple Segments. The goal of segmentation is to simplify and change the representation of an image into something that is more meaningful and easier to analyse Image segmentation is typically used to locate objects and boundaries (lines, curves, etc.) in images. We all know that every image is a set of pixels. And partitioning those pixels on the basis of the similar characteristics they have is called segmentation dividing an image into sub partitions on the basis of some similar characteristics like color intensity and texture is called image segmentation. The goal of segmentation is to change the representation of an image into something more meaningful and easier to analyze. Image segmentation is normally used to locate objects and boundaries that is lines, curves, etc. in images. In image segmentation image is divided into some regions and in that region each pixel is similar with respect to some of the characteristic such as the color, intensity, or texture. Adjacent regions are significantly different with respect to the same characteristic(s).
Segmentation can be done by detecting edges or points or line in the image. When we detect the points in an image then on the basis of similarities between any two points we can make them into separate regions. And in the case of the line detection technique we use to detect all the lines and the similarities in between those lines then on the basis of the dissimilarities between the lines or curves in the image we can divide the image into two regions. And in the case of edge detection we detect the edges in the image and after finding the edges in the image we can easily divide the image and here we can easily analyze what is inside the image and we can get a better segmented image. even it is the old technique to segment the image now a day these segmentation technique is used to segment the image.
In this project we use the graph cut technique to solve the segmentation problem. here we represent the image in the format of the graph that means it will contain the vertices and the edges like a graph .and here each vertices or a node can be taken as the pixels of the image and the color or intensity difference between any two pixels can be taken as the edge. And whenever there is a week edge in between the graph or the image then we cut that part. if the cutting the part of the graph is more than it is called maximum cut and we can call it minimum cut if the cut is small when compared to other cuts in the image. Here we use the minimum cut method to solve the segmentation problem and we didn’t get the better segmented image. Because there are some of the discontinuities are there in the case of the minimum cut technique. Because it cuts all the pixel’s even if there are similarities in the image. So here we go for the normalized cut method in which we use the eigenvalues and the eigenvectors to solve the image segmentation problem. In this normalized cut method, we use the eigenvector of the second smallest eigenvalue. And on the basis of the eigenvector we divide the image into two parts and if it is necessary we can cut the graph which divided into two parts by taking any part of the above divided image.
Feature Extraction
Fuzzy With Graph Cut Classification
By applying the graph cut technique we can easily and efficiently solve a wide variety of low-level computer vision problems, such as image smoothing and many other computer vision problems and the stereo correspondence problem, can be solved in terms of energy minimization. We can solve binary problems exactly using this approach; here problems where pixels can be labelled with more than two different labels (such as stereo correspondence, of a grayscale image) cannot be solved exactly, but here we can get the optimum solution to the problem.
In the graph cut technique we represent the image in the form of graphs. That means containing nodes and vertices like a graph. So here we represent each pixel as a node and the distance between those nodes as the edges. We can calculate the distance between the nodes by using the attributes of the Ohtacolor model. In graph theory, a cut is a partition of the nodes that divides the graph into two disjoint subsets. The set of cuts of the cut is the set of edges whose ending points are in different subsets of the divided region. If edges are in its cut-set then they are said to be crossing the cut.
In an un-weighted undirected graph, we can say that the weight or size of a cut is the number of edges that are crossing the cut in an image. And in the case of a weighted graph, it is defined as the sum of the weights of all the edges crossing the cut. The basic cuts in the graph theory are minimum cut and maximum cut
Minimum Cut
In the minimum cut technique, the size of the cut is not larger than the size of the any other cut. The figure showed in the below shows a minimum cut: Here the cut size is 2, and there is no cut of size 1 because the graph is bridgeless.
Maximum Cut
A cut is maximum if the size of the cut is not smaller than the size of any other cut in the image. In the below figure that shows a maximum cut: the size of the cut is equal to 5. In general, finding a maximum cut in an image is computationally hard.
Normalized cut
The normalized cut method was proposed by J. Malik and J. Shi. In their view, the image segmentation problem can be seen as a graph theory problem. Graph theory is an interesting math topic which models math problems into edges and vertexes. Here we represent each pixel as a vertex or node and the distance between those nodes as the edges. This model could be used for coloring problems (give each county a color, while connected county should have different colors. Each edge in the model could contain a value (weight), which could be used as flow or importance of it. This kind of graph is called “weighted graph”.
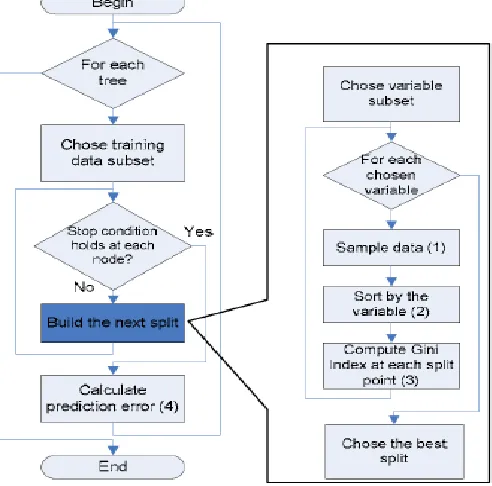
Algorithm
Let the number of training cases be N, and the number of variables in the classifier be M.We are told the number m of input variables to be used to determine the decision at a node of the tree; mshould be much less than M.Choose a training set for this tree by choosing n times with replacement from all N available training cases (i.e. take a bootstrap sample). Use the rest of the cases to estimate the error of the tree, by predicting their classes.For each node of the tree, randomly choose m variables on which to base the decision at that node. Calculate the best split based on these m variables in the training set.Each tree is fully grown and not pruned (as may be done in constructing a normal tree classifier).
(IJSTE/ Volume 2 / Issue 10 / 061)
III. OUTPUT IMAGES
Segments
Segmented image
Textured regions
Potential source and target regions
Adaptive contrast Enhancement image
(IJSTE/ Volume 2 / Issue 10 / 061)
IV. CONCLUSION
This method presents a novel method to improve the classification performance of Fuzzy classifiers, which combines group of features from the feature extraction process. Also, we used the graph cut technique to solve the image segmentation problem. The combination of Graph cut segmentation with the Fuzzy Classifier The performance of RF classifier is compared with the proposed method. The experimental results underline that the proposed approach, which achieves better results than a regular RF classifier and an RF with the features extracted by the SSFE, is effective to the ill-posed and proposed problems. The proposed model is proved to be the better classification method compared to the previous approach.
REFERENCES
[1] Yanfei.Z&Liangpei.Z,(2012), ‘An adaptive artificial immune network for supervised classification of multi-/hyperspectral remote sensing imagery,’Geosci. pp. 894–909.
[2] Batenburg.K.J&Sijbers.J,(2011), ‘DART: A practical reconstruction algorithm for discrete tomograph’, Image Process.,pp. 2542–2553.
[3] Wright.S.J., Nowak.R.D&Figueiredo.M.A.T,(2009), ‘Sparse reconstruction by separable approximation’, Signal Process., vol. 57, no. 7, pp. 2479–2493. [4] Du.P et al.,(2012), ‘Multiple classifier system for remote sensing image classification: A review’, Sensors, pp. 4764–4792.
[5] Xia.J,Du.P,He.X&Chanussot.J,(2014), Hyperspectral remote sensing image classification based on rotation forest’,Geosci. Remote Sens.pp.239–243. [6] C. Yangchi , M. M. Crawford and J. Ghosh, "Knowledge based stacking of hyperspectral data for land cover classification", Proc. IEEE Symposium CIDM,
pp. 316-322, 2007
[7] M. Fauvel , J. A. Benediktsson , J. Chanussot and J.R.Sveinsson,"Spectral and spatial classification of hyperspectral data using SVMs and morphological profiles", IEEE Trans. N .Geosci. Remote Sens., vol. 46, no. 11, pp. 3804-3814, 2008
Graph cut Using Fuzzy Logic
50 100 150 200 250 300 350 400 450
100
200
300
400
500
600
700
800 0