Tasks Distribution Strategy based on Cluster in
MWfSCC
Xiuguo Wu
Shandong University of Finance and Economics/School of Management Science and Engineering, Jinan, China Email: xiuguosd@163.com
Abstract—Cloud computing technology offers a new way to develop workflow system. Migrating workflow system based on cloud computing paradigm (MWfSCC) can obtain high system performance and service quality in cloud computing environment, where an agent (called CMI) is deployed to fulfill several tasks by migrating to other computers (called work machines). In general, task execution involves several input data sets usually placed on distributed work machines. On the other hand, task execution will also generate some data sets, which may be regard as input data sets for other tasks. Traditionally, CMI moves to work machines one by one for the reason that tasks execution places are also distributed. In this way, it is very important to arrange the tasks on different work machines in order to reduce CMI’s movements. In this paper, we propose a tasks distribution strategy based on cluster in MWfSCC, which contains tasks classifications and arrangements. Simulations show that tasks distribution strategy based on cluster can effectively reduce CMIs movements during workflow execution, and hence can significantly improve the performance of MWfSCC.
Index Terms—workflow, cloud computing, tasks distribution
I. INTRODUCTION
Cloud computing technology offers a new way to enable massive amounts of data sets to work together, since it supplies a pool of abstracted, virtualized, dynamically-scalable, highly available, and configurable and reconfigurable computing resources (e.g., networks, servers, storage, applications, data) [1]. However, as solving problems becomes more and more complex, especially the exponential growth of data sets, the data movements is a challenge for the sake of network bandwidth limitation. In this way, migrating workflow is an emerging technology that applies mobile agent technology to workflow management, which deploys an agent (called CMI) to fulfill several tasks by migrating to other computers (called work machines) [2-4]. By taking advantage of cloud computing technology, migrating workflow system based on cloud computing paradigm (MWfSCC) could gain a wider utilization. MWfSCC obtains so many advantages in system performance, such as easy interaction, intelligent decision making, especially in distributed, dynamic and unpredictable environment [5-6].
Yet there are still some new challenges have to face, and the tasks distribution is one of them [7]. There are
many tasks in MWfSCC, and each task can be bound to a certain work machines for execution, where store a large amount of data sets. Similarly, each task execution usually includes several input data sets, which are usually placed on distributed work machines. On the other hand, a series of output data sets will be generated after tasks completed, which may be required by other tasks as input data sets. Traditionally, a CMI’s tasks execution involves many work machines; and it needs to move on these machines one by one for the reason that tasks are also distributed. However, if one work machine can fulfill one or more tasks, then CMI’s movements can be reduced effectively during workflow execution, and the performance of cloud workflow system can be significantly improved in this way.
Based on the above analysis, it is an urgent question to find the tasks relations and arrange them in a suitable work machine in order to reduce the CMI movements. So, in this paper, we propose a tasks distribution strategy based on cluster in MWfSCC. In our strategy, we try to classify the different tasks into sub-classes, which are linked by input and output data sets. In this way, the performance of cloud workflow system will be greatly improved when some tasks are distributed on the same machine.
The remainder of the paper is organized as follows: Section II presents the related works, including migrating workflow system based on cloud computing paradigm and tasks scheduling in traditional distributed system, Section III gives models for task distribution in MWfSCC, including models of task and other related conceptions, and Section IV demonstrates the strategy for tasks distribution based on cluster using a simple example. Section V presents the simulation results and the evaluation. Finally, Section VI addresses our conclusions and future work.
II. RELATED WORK
In this section, we will briefly introduce the existing literatures related to this research. There are two parts, including migrating workflow system based on cloud computing paradigm, and tasks management about workflow in traditional distributed system.
A. Migrating Workflow System based on Cloud Computing Paradigm
service cloud server, service cloud network and cloud migrating instance (CMI) [2].
• Cloud workflow engine (CWfE). The main function of cloud workflow engine is to administrate the execution of whole system, including the management of service cloud servers and service cloud networks. It has the capabilities to create, to call and to kill a cloud migrating instance. Also, it controls the generation and elimination of CMIs.
• Service cloud server (SCS). Service cloud server is the main place of cloud migrating instance. It accepts the queries and requests from CMI, and supplies the service once an instance arrives. In special circumstances, it can also create and kill cloud migrating instance.
• Service cloud network (SCN). Service cloud network is the provider of resource and service. • Cloud migrating instance (CMI). Cloud migrating
instance is the main body of workflow execution, which is assigned a task description before execution. And CMI also manages and monitors tasks execution process.
According to the framework of MWfSCC, the core question of SCS is to administrate a table of tasks list, which is associated with a task description, input and output data. Figure 2 describes the architecture of service cloud server.
• Task engine: the main function of task engine is to administrator the task list table, such as adding, deleting and updating the service of SCS, and to take over the execution of a CMI.
• Task list table: the list of service is stored in task list table, indicating the capability of SCS. Each element in task list table includes task description, its input data and output data.
• Migrating tree: once a CMI decides to achieve its goals in SCS, migrating tree will tell the routine of how to find the nearest (most appropriate) work machine.
• Tasks directory: a blue print of service list table. • Tasks lib: a library containing all the tasks
description.
B. Task Scheduling in Traditional Distributed System Task managements in the traditional distributed computing system include tasks scheduling and tasks placement strategy. As for cloud workflow systems, scheduling is a very important component similar to many other workflow systems. It directly determines the performance of the whole system. According to [8], there are two major types of workflow scheduling: best-effort based and QoS constraint based. Best-effort based scheduling attempts to minimize the execution time without considering other factors such as the cost of accessing resources and various users’ QoS satisfaction levels.
Generally speaking, the algorithms usually are designed for scheduling a single workflow instance. However, for instance-intensive workflows on a cloud computing platform, fierce competition on servers/services may occur and failures may happen from time to time. Thus scheduling strategy needs to incorporate these situations accordingly. In addition, scheduling algorithm needs to consider the characteristics of cloud computing in order to accommodate instance-intensive cost-constrained workflows by compromising execution time and cost with user intervention, which is not considered in other strategies [9-12].
In cloud computing system, the infrastructure is hidden from users. Hence, for most of the application tasks, the system will decide where to perform them. Dependencies exist among these tasks via input and output data sets [13-15]. In this paper, we initially adapt the cluster algorithms for tasks distribution in order to reduce the number of CMIs movements.
III.MODELS FOR TASKS DISTRIBUTION IN MWFSCC In this section, we will define some models related to research, including migrating workflow system based on cloud computing paradigm, cloud migrating instance, data set, etc.
Definition 1. Migrating Workflow System based on Cloud Computing Paradigm (MWfSCC).
Migrating workflow system based on cloud computing paradigm isa4-tuple: (Wid, CMI, SC, Eng), where,
(1) Wid is an identifier of MWfSCC;
(2) CMI={CMI1, CMI2,…, CMIn}, representing a set of
cloud migrating instances (CMIs). Each CMI pursues a certain goal on behalf of an independent business process;
Task Engine
Task 1 Task 2 Task 3
…… Task n
Task1 Description Input Data Output Data
Task2 Description Input Data Output Data
Migrating Tree Tasks Directory Tasks Lib
Taskn Description Input Data Output Data
Task List
……
Figure 2. Architecture of service cloud server.
Service Cloud Server Service Cloud Network Work Place
Cloud Workflow Engine
Service Cloud Server Service Cloud Network Work Place
☺
☺
CMI CMI
☺
CMI
(3) SC={sc1, sc2, …, scn}, representing a set of servers
in cloud computing environment, where CMIs fulfill tasks;
(4) Eng is an engine ofMWfSCC, which administers the whole workflow system, including creating, killing or suspending CMIs and monitoring the activities, etc.
Definition 2. Cloud Migrating Instance(CMI). A CMI can be described with a 8-tuple: (cmiid, TL, t, SCcmi, p, Scmi, ToL, MC), where,
(1) cmiid is an identifier of a CMI, which is exclusive in the whole system;
(2) TL=({〈t1, R1, S1〉, 〈t2, R2, S2〉, …, 〈tn, Rn, Sn〉},
Schedule), representing sub-task specifications in CMI, including two parts: task list table {〈t1, R1, S1〉, 〈t2, R2, S2〉, …, 〈tn, Rn, Sn〉} and task scheduler Schedule. And task
t is corresponds to the activities ai in business process, Ri
is the resource requirements for task completion, Si is the
service requirements of tasks. Schedule is the dependency relationship of sub-tasks t1, t2 …tn;
(3) t is the a task that CMI is processing, equal to one of ti;
(4) SCcmi is the set of available service cloud,
SCcmi∈SC;
(5) p is the service cloud that CMI is deployed; (6) Scmi describes CMI’s current state;
(7) ToL is CMI’s life cycle;
(8) MC is the machine that supplies services or resources CMI requires, including task performing and halting, multi-tasks coordination, detecting resource and service, migrating places query.
Definition 3. Service Cloud (SC).
A service cloud (SC) can be described by a 4-tuple: (scid, S, R, Svr), where,
(1) scid is an identifier of service cloud;
(2) S={s1, s2, …, sn} represents a set of services that a
service cloud can supply;
(3) R={r1, r2 , …, rm} is a set of resources that a
service cloud can supply;
(4) Svr is a service engine, which can coordinate the running of cloud system.
Definition 4. Data set type (DST) .
Data set in MWfSCC can be divided two types: DSini,
and DSgen, where,
(1) DSini={di1, di2, di3,…}, representing the original
data sets uploaded by users, which are usually collected from the devices in experiments. And the most important feature of these data sets is that they can’t be regenerated again if they are deleted;
(2) DSgen={dg1, dg2, dg3,…}, representing the data sets
produced in the cloud computing system after tasks completion. They are the intermediate or final computation results of the applications.
Definition 5. Task (T).
A task in MWfSCC can be defined as a 3-tuple <ti, din,
dout>, where,
(1) ti means the identifier of a task;
(2) din means input data sets for performing a task ti;
(3) dout means output data sets after a task ti execution.
A task model can be described asFigure 3.
Definition 6. Use relation matrix Ru.
Given a data set D={d1, d2, .., dn}, and a task set T={t1, t2, …, tm}, then using relation matrix Ru can be defined as
follows: Ru=(rij)m×n, where,
else
0
; data using task executing where
1
⎩ ⎨ ⎧
= i j
ij
d t
r
Definition 7. Generation relation matrix Rc.
Generation relation matrix Rc can be defined as follows:
Rc=(rij) m×n, where,
⎩ ⎨ ⎧
=
else 0
; data generating task
executing where
1
i j
ij
d t
r
Definition 8. Task data graph (TDG).
A task data graph can be defined as a 4-tuple <T, D, Ci,
Dai>, where,
(1) T is a task set; (2) D is a data set;
(3) Ci represents the control flow between task ti;
(4) Dai refers to data flow relation.
According to the above definition, we can depict a graph including tasks, data sets and their relations. Figure 4 shows a simple task data graph, where each node in the graph denotes a data set. In Figure 4, data set d1
points to task t4, which means that d1 is an input data set
of task t4; and task t3 points to data set d4, which means
the data set d4 can be acquired by performing task t3.
In this way, the use relation matrix and generation relation matrix can be represented as follows:
⎟ ⎟ ⎟ ⎟ ⎟ ⎟ ⎟ ⎟
⎠ ⎞
⎜ ⎜ ⎜ ⎜ ⎜ ⎜ ⎜ ⎜
⎝ ⎛
=
1 1 1 1 1 1 1 1
0 0 0 0 0 1 0 1
0 0 0 0 0 0 0 1
0 1 0 0 0 0 0 0
1 0 0 0 0 0 0 0
0 1 0 0 0 0 1 0
u
R , and
d1
d5
d6
t1
t2 t3
t4 t5
t6
d3
ti task
di data
control flow
data flow
d2
d8
d4
d7
Figure 4. An example of task data graph.
Din Dout
ti
task data
⎟ ⎟ ⎟ ⎟ ⎟ ⎟ ⎟ ⎟
⎠ ⎞
⎜ ⎜ ⎜ ⎜ ⎜ ⎜ ⎜ ⎜
⎝ ⎛
=
0 0 0 0 0 0 0 0
0 0 1 0 0 0 0 0
0 0 0 0 0 0 1 0
1 0 0 0 1 0 0 0
0 1 0 1 0 0 0 0
0 0 0 0 0 1 0 1
c
R .
Definition 9. Work machine.
A work machine can be defined as a 4-tuple <wi, pi, si,
D>, where,
(1) wi means the identifier of work machine;
(2) pi is the performance value related to the CPU
speed, memory size and other hardware factors; (3) si is the size for data storage;
(4) D is a data sets stored in work machine wi.
A work machine can fulfill a number of tasks; also, each task can perform on many work machines.
Definition 10. Dependency relation.
R→ denotes that two data sets have a generation relationship, where di→dj means that djcan be acquired
by calculation from data set di, that di is the predecessor
of dj. Also, we can define relation ¬→ denotes that the
two data sets do not have a generation relationship, where di and dj are in different branches in TDG.
IV.ALGORITHM FOR TASKS DISTRIBTION BASED ON CLUSTER
In workflow modeling stage, all the data sets should be logically assigned to different work machines, which can optimize the distribution schema.
Use relation matrix describes the using relation between data sets and tasks; and we will calculate the relativity using matrix Ru in the succeeding paragraph. An
element rij means a data set dj can be used in fulfilling a
task ti directly.
A. Algorithm for Tasks Distribution
In this section, we will present task distribution algorithm based on cluster.
Algorithm 1: Tasks distribution algorithm based on Cluster
Input: A set of tasks T;
Output: Tasks subset for distribution on work
machines.
01. Construction input data set Din from task ti,
Din={ti.din| ti∈T};
02. Construction output data set Dout from task ti,
Dout={ti.dout| ti∈T};
03. Calculate the use relation matrix Ru;
04. Calculate generation relation matrix Rc;
05. Calculate the one-step arrival matrix G
06. i=2;
07. While i<|T| Do //multi-steps arrival matrix
08. Begin
09. Gi=Gi-1×G1;
10. i=i+1;
11. End;
12. G= G1∨…∨ G|T|-1∨ G|T|
13. Calculate the mutual accessibility among data sets;
14. Calculate sub-strong mutual accessibility matrix;
15. Row adjustment;
16. Column adjustment;
17. Acquire the classification of task sets;
18. End.
In Algorithm 1, function |T| means the number of tasks in cloud environment. Here, we will analyze the time complexity of Algorithm 1. An adjacent matrix is used to represent task data graph. And the Line 09 will execute less than n3 times, where n is the tasks number. So, the total time complexity of tasks distribution algorithm based on cluster is O(n3). A simple example will be shown in the following sub-section.
B. A Simple Example
In this section, we will present the proposed tasks distribution algorithm step by step using a simple example. The tasks are described in Table I. And there are eight data sets, representing as d1, d2, d3, d4, d5, d6, d7, d8, and six tasks, representing as task1, task2, task3, task4, task5, task6.
TABLE I TASKS DESCRIPTIONS
Tasks Input Data Output Data
t1 {d2, d6} {d1, d3} t2 {d8} {d5, d7} t3 {d7} {d4, d8} t4 {d1} {d2} t5 {d1,d3} {d6}
t6 {d1,d2,d3,d4,
d5,d6,d7,d8} Ø
Step 1
The use relation matrix Ru can be obtained from Table
I using Definition 6. And the matrix Ru is described as
. 1 1 1 1 1 1 1 1 0 0 0 0 0 1 0 1 0 0 0 0 0 0 0 1 0 1 0 0 0 0 0 0 1 0 0 0 0 0 0 0 0 0 1 0 0 0 1 0 ⎟ ⎟ ⎟ ⎟ ⎟ ⎟ ⎟ ⎟ ⎠ ⎞ ⎜ ⎜ ⎜ ⎜ ⎜ ⎜ ⎜ ⎜ ⎝ ⎛ = u R Step 2
The generation relation matrix Rc can be obtained from
Table I using Definition 7. And the matrix Rc is described
as follows: ⎟ ⎟ ⎟ ⎟ ⎟ ⎟ ⎟ ⎟ ⎠ ⎞ ⎜ ⎜ ⎜ ⎜ ⎜ ⎜ ⎜ ⎜ ⎝ ⎛ = 0 0 0 0 0 0 0 0 0 0 1 0 0 0 0 0 0 0 0 0 0 0 1 0 1 0 0 0 1 0 0 0 0 1 0 1 0 0 0 0 0 0 0 0 0 1 0 1 c R . Step 3
Calculate one-step arrival matrix G using the following formula: )) , ( ) , ( ( )
(g, ( n1 R i k R k j R
R
G m*m k c uT
T u
c⋅ = i j = ∨ ∧
= = ,
i=1, 2… m, and j=1, 2 …n.
. 0 0 0 0 0 0 1 0 0 0 0 1 1 0 0 0 0 1 1 0 0 0 1 0 1 0 0 1 0 0 1 1 1 0 0 0 1 0 0 0 1 0 1 0 0 1 0 0 1 0 0 0 0 1 1 0 0 0 0 0 1 0 0 0 0 0 1 1 0 0 0 0 1 0 0 0 0 1 1 1 1 0 0 0 0 0 0 0 0 0 0 0 0 0 1 0 0 0 0 0 0 0 0 0 0 0 1 0 1 0 0 0 1 0 0 0 0 1 0 1 0 0 0 0 0 0 0 0 0 1 0 1 1 1 1 1 1 1 1 1 0 0 0 0 0 1 0 1 0 0 0 0 0 0 0 1 0 1 0 0 0 0 0 0 1 0 0 0 0 0 0 0 0 0 1 0 0 0 1 0 0 0 0 0 0 0 0 0 0 0 1 0 0 0 0 0 0 0 0 0 0 0 1 0 1 0 0 0 1 0 0 0 0 1 0 1 0 0 0 0 0 0 0 0 0 1 0 1 ⎟ ⎟ ⎟ ⎟ ⎟ ⎟ ⎟ ⎟ ⎠ ⎞ ⎜ ⎜ ⎜ ⎜ ⎜ ⎜ ⎜ ⎜ ⎝ ⎛ = ⎟ ⎟ ⎟ ⎟ ⎟ ⎟ ⎟ ⎟ ⎟ ⎟ ⎟ ⎠ ⎞ ⎜ ⎜ ⎜ ⎜ ⎜ ⎜ ⎜ ⎜ ⎜ ⎜ ⎜ ⎝ ⎛ ⋅ ⎟ ⎟ ⎟ ⎟ ⎟ ⎟ ⎟ ⎟ ⎠ ⎞ ⎜ ⎜ ⎜ ⎜ ⎜ ⎜ ⎜ ⎜ ⎝ ⎛ = ⎟ ⎟ ⎟ ⎟ ⎟ ⎟ ⎟ ⎟ ⎠ ⎞ ⎜ ⎜ ⎜ ⎜ ⎜ ⎜ ⎜ ⎜ ⎝ ⎛ ⋅ ⎟ ⎟ ⎟ ⎟ ⎟ ⎟ ⎟ ⎟ ⎠ ⎞ ⎜ ⎜ ⎜ ⎜ ⎜ ⎜ ⎜ ⎜ ⎝ ⎛ = T G Step 4
Two-step arrival matrix G can be obtained by calculation using following formula:
⎟⎟ ⎠ ⎞ ⎜⎜ ⎝ ⎛ ∧ ∨ = ⋅ =
=1( (, ) ( , )) 2 j k G k i G G G G m k ,
i=1, 2… m, and j=1, 2 …n. So, ⎟ ⎟ ⎟ ⎟ ⎟ ⎟ ⎟ ⎟ ⎠ ⎞ ⎜ ⎜ ⎜ ⎜ ⎜ ⎜ ⎜ ⎜ ⎝ ⎛ ⋅ ⎟ ⎟ ⎟ ⎟ ⎟ ⎟ ⎟ ⎟ ⎠ ⎞ ⎜ ⎜ ⎜ ⎜ ⎜ ⎜ ⎜ ⎜ ⎝ ⎛ = 0 0 0 0 0 0 1 0 0 0 0 1 1 0 0 0 0 1 1 0 0 0 1 0 1 0 0 1 0 0 1 1 1 0 0 0 0 0 0 0 0 0 1 0 0 0 0 1 1 0 0 0 0 1 1 0 0 0 1 0 1 0 0 1 0 0 1 1 1 0 0 0 2 G ⎟ ⎟ ⎟ ⎟ ⎟ ⎟ ⎟ ⎟ ⎠ ⎞ ⎜ ⎜ ⎜ ⎜ ⎜ ⎜ ⎜ ⎜ ⎝ ⎛ = 0 0 0 0 0 0 1 1 1 0 0 0 1 1 1 0 0 0 1 0 0 1 0 0 1 0 0 0 1 0 1 0 0 0 0 1 .
Similarly, we can calculate the three-step arrival matrix G3, four-step arrival matrix G4 and five-step arrival matrix G5. Then the arrival matrix R can be
obtained using following formula:
. 1 0 0 0 0 0 1 1 1 0 0 1 1 1 1 0 0 1 1 0 0 1 1 0 1 0 0 1 1 0 1 1 1 0 0 1 ; 5 4 3 2 ⎟ ⎟ ⎟ ⎟ ⎟ ⎟ ⎟ ⎟ ⎠ ⎞ ⎜ ⎜ ⎜ ⎜ ⎜ ⎜ ⎜ ⎜ ⎝ ⎛ = ∨ ∨ ∨ ∨ = R G G G G G R Step 5
In order to calculate the accessible relationship among data sets, we will first give definitions of accessibility and mutual accessibility.
Definition 11. Accessibility.
In matrix R, if there is an element R(i, j)=1, we call task ti is accessible to task tj. In other words, accessibility
means the ti’s output data sets are also the input data sets
for task tj.
For example, in matrix R, the element R(4, 5) =1, we can see from Figure 1 that the output data set of t4 (d2) is
also the input data set of task t1. On the same way, task t1’s output data set d3 is also the input data set of task t5.
Definition 12. Mutual accessibility.
If a data set di is accessible to data set dj, and dj is also
accessible to di, then these two data sets are mutual
accessible.
As is shown in Figure 5, where data set di and dj are
mutual accessible.
We use Q=R∧RT to calculate the mutual accessibility.
tm
di
ti task
di data
tn
dj
T
Q
⎟ ⎟ ⎟ ⎟ ⎟ ⎟ ⎟ ⎟
⎠ ⎞
⎜ ⎜ ⎜ ⎜ ⎜ ⎜ ⎜ ⎜
⎝ ⎛
∧
⎟ ⎟ ⎟ ⎟ ⎟ ⎟ ⎟ ⎟
⎠ ⎞
⎜ ⎜ ⎜ ⎜ ⎜ ⎜ ⎜ ⎜
⎝ ⎛
=
1 1 1 1 1 1
0 1 1 0 0 1
0 1 1 0 0 1
0 0 0 1 1 0
0 0 0 1 1 0
0 1 1 0 0 1
1 0 0 0 0 0
1 1 1 0 0 1
1 1 1 0 0 1
1 0 0 1 1 0
1 0 0 1 1 0
1 1 1 0 0 1
.
1 0 0 0 0 0
0 1 1 0 0 1
0 1 1 0 0 1
0 0 0 1 1 0
0 0 0 1 1 0
0 1 1 0 0 1
⎟ ⎟ ⎟ ⎟ ⎟ ⎟ ⎟ ⎟
⎠ ⎞
⎜ ⎜ ⎜ ⎜ ⎜ ⎜ ⎜ ⎜
⎝ ⎛
=
Step 6
Sub-strong mutual accessibility matrix can be obtained by adjusting the rows and columns order. And there are three steps.
Step 6.1
Create a set of random sequence numbers, which can be a Fibonacci sequence. In this paper, we use a number list as follows:
a1=1, a2=3,
a3=a1+a2+1=5, aj=2aj 1 ( j≥4).
In this way, random sequence numbers can be calculated as: 1, 3, 5, 10, 20, 40, 80 …
Step 6.2
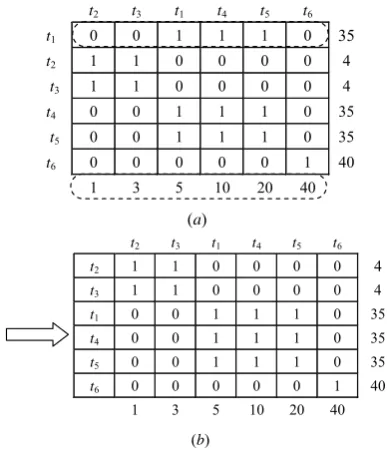
Adjust the columns using random sequence numbers. Each element Q[i][j] is multiplied by corresponding sequence number, then a series values can be obtained for adjusting the columns. As is shown in Figure 7(a) and (b).
Step 6.3
Adjust the rows using random sequence numbers. Each element Q[i][j] is multiplied by corresponding sequence number, then a series values can be obtained for adjusting rows. As is shown in Figure 8.
Step 7
The last step is to acquire the classification of tasks sets. As is shown in Figure 9.
In this way, we have divided all the tasks into three sub sets, including {t2, t3}, {t1, t4, t5} and {t6}. In the tasks
distribution, these tasks in one sub sets should be arranged in the same work machine for reducing the CMIs movements. And the classification result can be seen in Figure 10.
t1 t2 t3 t4 t5 t6
t1 1 0 0 1 1 0 1
t2 0 1 1 0 0 0 3
t3 0 1 1 0 0 0 5
t4 1 0 0 1 1 0 10
t5 1 0 0 1 1 0 20
t6 0 0 0 0 0 1 40
31 8 8 31 31 40
(a)
t2 t3 t1 t4 t5 t6
t2 1 1
t3 1 1
t1 1 1 1
t4 1 1 1
t5 1 1 1
t6 1
Figure 9. Result of classification Matrix.
t2 t3 t1 t4 t5 t6
t1 0 0 1 1 1 0 35 t2 1 1 0 0 0 0 4
t3 1 1 0 0 0 0 4
t4 0 0 1 1 1 0 35
t5 0 0 1 1 1 0 35
t6 0 0 0 0 0 1 40 1 3 5 10 20 40
(a)
t2 t3 t1 t4 t5 t6
t2 1 1 0 0 0 0 4
t3 1 1 0 0 0 0 4
t1 0 0 1 1 1 0 35
t4 0 0 1 1 1 0 35
t5 0 0 1 1 1 0 35
t6 0 0 0 0 0 1 40 1 3 5 10 20 40 (b)
Figure 8.Adjustment the column of Matrix(ii).
t2 t3 t1 t4 t5 t6
t1 0 0 1 1 1 0 1
t2 1 1 0 0 0 0 3
t3 1 1 0 0 0 0 5
t4 0 0 1 1 1 0 10
t5 0 0 1 1 1 0 20
t6 0 0 0 0 0 1 40 8 8 31 31 31 40 (b)
Figure 7. Adjustment the column of Matrix(i).
t1 t2 t3 t4 t5 t6
t1 1 0 0 1 1 0 t2 0 1 1 0 0 0 t3 0 1 1 0 0 0 t4 1 0 0 1 1 0 t5 1 0 0 1 1 0 t6 0 0 0 0 0 1
V.EXPERIMENTAL DETAILS AND COMPARISONS MWfSCC (Migrating Workflow System Model based on Cloud Computing Paradigm) is developed on
migrating workflow system. The prototype is designed in Java and currently running on the simulation environment. As is shown in Figure 11.
To simulate the cloud computing environment, we set up VMware software on the physical servers and PCs as work machines. In order to testify the validity of task classification strategy, we design an experiment of sorting random numbers. The main object is to compare mean execution time between task classification and no task classification.
In experiments, each CMI is assigned a task to arrange 2,000 random numbers into a sequence. In task classification, most of tasks are stored on the same work machine, while each task is arranged in different work machines with no task classification. Table II recorded the execution time among different number of CMIs.
TABLE II.
EXECUTION TIME AMONG DIFFERENT NUMBER OF CMIS
Number of CMIs
Execution Time with No Tasks classification
Execution Time with Tasks classification 100 1.156 0.756 150 1.239 0.839
250 1.508 1.008 300 1.602 1.202 350 2.676 1.376 400 3.889 1.667 450 6.581 2.743
500 9.541 4.652
Figure 12 describes the execution time for workflows across scheduling with different number of CMIs. From Figure 12, we can see that the execution time with tasks classification has gradually deceased compared with the time without tasks classification. In addition, the
execution time will be saved up to half of the whole time with CMIs number 500.
VI. CONCLUSIONS AND FUTURE WORKS
Large scale sophisticated workflow applications are commonly seen in both e-business and e-science areas.
1.239 1.508 1.602 2.676
3.889 6.581
9.541
0.839 1.008 1.202 1.376
1.667 2.743
4.652
0 2 4 6 8 10 12
150 250 300 350 400 450 Number of CMIs500
Execution
Time (Seco
nd)
Execution Time without Task classification Execution Time with Task classification
Figure 12. Execution time for workflow among different number of CMIs
t1 t4
t5
t2 t3
t6
S1
S2
S3
Figure 10. Result of tasks distribution.
Workflow system built on high performance computing infrastructures such as p2p and grid computing are often applied to support the process automation of large scale workflow applications. MWfSCC is not built from scratch but from its predecessor GoMWfS (goal oriented migrating workflow system). The practical applications show the simplicity and validity of our prototype system in modeling and executing cloud computing transactions. Traditional scheduling strategy usually emphasize on the data place, not involving the tasks distribution.
In this paper, a novel task distribution strategy based on cluster has been presented. Simulations in our MWfSCC indicated that our task distribution strategy can effectively reduce execution time.
In the future, more functional components will be designed and deployed to enhance the capability of MWfSCC. And different types of tasks should be performed many times to guarantee the task classification reliability. Also, we will develop some efficient replication strategies for data sets placements according different types of tasks, which could balance the data sets and tasks storage usage.
ACKNOWLEDGMENTS
This work presented in this paper is partly supported by Project of Shandong Province Higher Educational Science and Technology Program (No.J12LN33), China; the Doctor Foundation of Shandong University of Finance and Economics under Grant (No.2010034), and the Project of Jinan High-technology Independent and Innovation (No.201303015), China.
REFERENCES
[1] Raghavan B., Ramabhadran S., Yocum K. and Snoeren A. C. “Cloud control with distributed rate limiting”. In
Proceedings of the 2007 conference on Applications, technologies, architectures, and protocols for computer communications (ACM SIGCOMM) , Kyoto, Japan, 2007,
pp.337–348.
[2] WFMC, Workflow management coalition terminology and glossary, Workflow Management Coalition, Brussels: Technical Report WFMC-TC-1011, 1996.
[3] Zeng Guangzhou and Dang Yan, “The study of migrating workflow based on the mobile computing paradigm,”
Chinese Journal of Computers, Vol.26,(10), pp.1343-1349,
2003.
[4] Wu Xiuguo, “MWfSCC: A migrating workflow system based on cloud computing paradigm,” Journal of Convergence Information Technology, Vol. 7(23), pp.
537-547, 2012.
[5] Wu Xiuguo and Zeng Guangzhou, “Goals description and application in migrating workflow system”. Expert Systems with Application, Vol.37(12), pp.8027-8035, 2010.
[6] Zhuangjun Wu, Xiao Liu, Zhiwei Ni, Dong Yuan and Yun Yang, “A market-oriented hierarchical scheduling strategy in cloud workflow system,” The Journal of Supercomputing, Vol. 63(1), pp.256-293, 2011.
[7] D. Yuan, Y. Yang, X, Liu and Jinjun Chen, “A cost-effective strategy for intermediate data storage in scientific cloud workflow systems,” in Proceedings of 24th International parallel & Distributed Processing Symposium, Atlanta, USA, pp.1-12, 2010.
[8] R. Barga and D.Gannon, “Scientific versus business workflows,” in Workflows for e-Science, pp.9-16, 2007.
[9] Yu J, Buyya R and Ramamohanarao K. “Workflow scheduling algorithms for grid computing”, Metaheuristics for scheduling in distributed computing environments.
Springer Berlin Heidelberg, pp.173-214, 2008.
[10]Y. Yang, K. Liu, J. Chen, X. Liu, D. Yuan and H. Jin, “An algorithm in SwinDeW-C for scheduling transaction-intensive cost-constrained cloud workflows,” in
proceedings of 4th IEEE International Conference on e-Science, pp. 374-375, 2008.
[11]J. Yan, Y. Yang and G. K. Raikundalia, “SwinDeW- A P2P-based decentralized workflow management system”,
IEEE Transactions on Systems, Man and Cybernetics, Part
A, Vol. 36, pp.922-935, 2006.
[12]Liu K, Chen J, Yang Y and Jin H, “A throughput maximization strategy for scheduling intensive workflows on SwinDeW-G,” Concurrency and Computation: Practice & Experience - 2nd International Workshop on Workflow Management and Applications in Grid Environments (WaGe2007), vol.10(15), pp. 1807-1820, 2008.
[13]Ludscher, B., Altintas, I., Berkley, C., Higgins, etc. “Scientific Workflow Management and the Kepler System”. In: Concurrency and Computation: Practice and Experience, vol.18, pp.1039–1065, 2006.
[14]D. Ardagna and B. Pernici, “Adaptive service composition in Flexible Processes”, IEEE Trans. on Software Engineering, vol.33(6), pp. 369-384, 2007.
[15]Wang M, Kotagiri R and Chen J, “Trust-based robust scheduling and run time adaptation of scientific workflow”.
Concurrency Computation: practice and experience,
vol.21(16), pp: 1982-1998, 2009.
Xiuguo Wu received the BEng degree