ISSN (e): 2250-3021, ISSN (p): 2278-8719
Vol. 10, Issue 1, January 2020, ||Series -II|| PP 56-73
Performance of Sustainable Recycled Concrete Pavers
Miss Swati N. Nibhorkar, Dr M.V.Mohod
Assistant Professor, S.B.J.I.T.M.R, NagpurAssistant Professor, P.R.M.I.T.&.R, Badnera Received 31 December 2019; Accepted 15 January 2020
Abstract:
As more amount of researches are focused to explore different grey areas in sustainable material technology as the demand for construction material is heavily increasing. This research deals with study on the performance of Sustainable Paving Unit. Structural designers are more concerned on use of suitable material / technology in day to day construction practices. Considering that in view an Endeavour has been made to investigate the feasibility of using granite aggregate in concrete. Literature survey has shown various fiber materials and granite aggregate properties and their behavior on concrete that have potential to be used as feasible material. Among those materials industrial waste granite is adopted to see whether those materials can be used in mass construction. Therefore, the prime objective of this paper is to investigate the feasibility of utilizing waste granite material for preparing the concrete of M40 grade with locally available material. The addition of small granite aggregate to concrete would substantially improve its properties. In this study we used industrial waste granite as a replacement with aggregates in concrete. Granite aggregates are replaced by natural aggregate in the proportion of 10%, 20%, 30%, and 40%, to investigate effect on mechanical properties of Concrete mix such as compressive strength, flexural strength and split tensile strength. For easy reference, results are presented in tabular and graphical form. Parametric study has been conducted on mechanical properties of prepared concrete mix. From study it has been observed that the Granite aggregate have shown significant improvement in compressive strength, flexural strength and split tensile strength for 30% replacement of granite aggregate. Whereas, comparing the results obtained it can be concluded that Granite aggregate can be utilized in mass concrete construction. The variation in temperature of 24 hours has been studied for different shape of Paver. The actual differences are presented in graphical and tabular form for easy referencing.Keywords:
Sustainable Material, Granite Waste, Compressive Strength, Flexural StrengthI.
INTRODUCTION
Concrete is a man-made construction material that is widely used. It is obtained by mixing cement, water and aggregate in required proportions. Aggregate provide higher volume, stability and better durability than cement paste in concrete and provide around 75 per cent of the body of concrete. The aggregate are obtained from natural rock deposits are scarce, burnt-clay bricks are used as an alternative source of coarse aggregate. Since granite is a lighter material compared to aggregates, its use in concrete will lead to reduced self-weight on members and hence reduced dead load on column and eventually, the foundation system. Concrete that has a mixture of coarse aggregate and granite chips in certain proportion will have more strength than the sum which has a coarse aggregate completely replaced with granite chips.
II.
LITERATURE REVIEW
From the literature review it has been noted that a tremendous work has been done to study the effect of Industrial Granite on concrete. In this research paper, we will study the properties and behaviour of concrete after adding Industrial Granite pieces with dosage of 10%, 20%, 30% and 40% replacement of aggregate and effect on the compressive, split tensile and flexural strengths on the cubes, cylinders and beams respectively. From the observed percentage of replacement materials, optimum dosage of replacement material will be obtained, which could be used in current industrial demand. Effect of temperature along the depth of concrete has been reported by various researchers. Hence we will also study the effect of temperature on the concrete at various depth of concrete block.
The main advantage of using granite pieces as partial replacement with coarse aggregate is that the compressive, flexural and split tensile strength is increasing than the conventional concrete. The granite pieces are the waste material coming from tile industry. When the granite is cut in required sizes, the small broken pieces remains unused and are thrown out. This waste is having no cost so cost effective concrete can be made. The marble chips are also the waste from industry. Our objective is to reduce the temperature of the paver by adding marble chips in top layer of the paver.
III.
METHODOLOGY
The concrete is made with concrete wastes which are eco-friendly so called as Green concrete. Green concrete is a revolutionary topic in the history of concrete industry. Waste can be used to produce new products or can be used as admixtures so that natural resources are limited and used more efficiently and the environment is protected from waste deposits. Considerable research has been carried out on the use of various industrial by-products and micro fillers in concrete. The main concern of using granite wastes was not only the cost effectiveness but also to improve the properties of concrete, especially durability. Using the waste products like broken granite pieces and marble chips we have developed a new type of concrete.
A. MATERIAL USED
In this project, we have used different material for concrete mix such as cement, natural sand, aggregates and also used waste material which are described below.
Cement
The cement used was Pozzolona Portland cement grade 53 and confirming to IS 1489-1-1991. Initial and final setting time of cement was 158 min and 345 min, respectively. Pozzolona Portland cement is obtained by grinding fly ash with Portland cement clinker, no material other than gypsum or water or both, shall be added.
Fig 1 PPC Cement
Table No. 1 Chemical composition of constituents in PPC cement. (IS1489-1991) Sr.
No
Constituents PPC Cement
1 SiO2 23.5
2 Al2O3 12.9
3 Fe2O3 2.04
4 CaO 47.0
5 MgO 1.74
6 Loss on ignition 1.05
7 Chloride 0.01
Aggregate:
to fill up the voids in the aggregates. Minimum paste means less quantity of cement and less water, which are further mean increased economy, higher strength, lower shrinkage and greater durability.
a. Fine Aggregate:
Those fractions from 4.75 mm to 150 microns are termed as fine aggregate. The river sand is wash and screen, to eliminate deleterious materials and over size particles. Good quality WARDHA river sand was used as a fine aggregate.
Fig. 2 Wardha Sand
b. Course Aggregate:
The material whose particles are of size as retained on IS Sieve No 480 (4.75 mmm) is termed as course aggregate. Course aggregate used were 10 mm downgraded and 20 mm downgraded.
Fig.3. Coarse Aggregate
B. Granite:
Granite is the material, traditionally used in the construction of monuments. It is one of the hardest and most durable of substances. It can withstand extreme weather conditions. It is in fact, one of the main reasons it is used in the construction of monuments. Three Different varieties of granites are available from specific regions of the world. For experimental purpose we use the waste granite. We broke in small pieces and use the pieces passing through 20mm sieve and retained on 10mm sieve. Granite used in the investigation were obtained from Rahul Marble M.I.D.C Amravati.
Fig. 4 Granite aggregate
C. Marble Chips:
Fig. 5 Marble chips
Water:
Water is also one of the important ingredient of concrete. As the strength, workability is depending on water, the quantity of water a required to be taken very carefully. The potable water is used for the experiment.
IV.
LABORATORY TESTS ON MATERIAL:For mix design calculations we required data of materials like specific gravity, sieve analysis. For which we had conducted the different tests on materials which are described below
A. TEST ON CEMENT
For cement test we have conducted some different test on cement like Fineness test, Standard Consistency, Initial & final setting time which are described below.
a. Fineness Test:
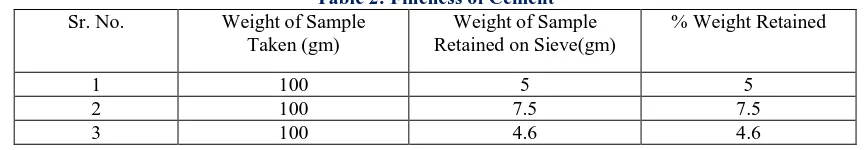
The fineness of cement has an important bearing on the rate of hydration and hence on the rate of gain of strength and also on the rate of evolution of heat. Finer cement offers a greater surface area for hydration and hence faster the development of strength. The fineness of grinding has increased over the years. But now it has got nearly stabilized. Different cements are ground to different fineness. Fineness of cement is tested by sieving.
b. By Sieving:
Weigh correctly 100 grams of cement and take it on standard IS Sieve No. 9(90 microns). Break down the air-set lumps in the sample with fingers. Continuously sieve the sample giving circular and vertical motion for a period of 15 minutes. Mechanical sieving devices may also be used. Weigh the residue left on the sieve. This weight shall not exceed 10 for ordinary cement. Sieve test is rarely used.
Table 2: Fineness of Cement Sr. No. Weight of Sample
Taken (gm)
Weight of Sample Retained on Sieve(gm)
% Weight Retained
1 100 5 5
2 100 7.5 7.5
3 100 4.6 4.6
Average retained weight= (5+7.5+4.6)/3 = 5.7%
After the experiment, we were able to determine the fineness of the cement by sieve method. Based on our results, we have observed that sieving process should be done properly and carefully. In data, the average fineness of the cement is 94.3% which means it passed the standard because it is clearly not less than 90% Other sources of errors could come from carelessness while sieving and wrong calculations.
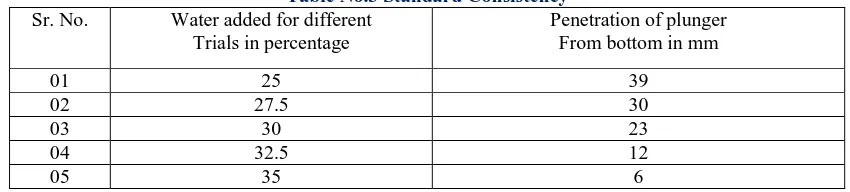
c. Standard Consistency Test:-
Table No.3 Standard Consistency Sr. No. Water added for different
Trials in percentage
Penetration of plunger From bottom in mm
01 25 39
02 27.5 30
03 30 23
04 32.5 12
05 35 6
Standard consistency in percentage = Total water for standard consistency x 100/400 = 140 X 100/400
=35%
This experiment tells us the amount of water content at which we can obtain the maximum strength of cement. The achieved Standard Consistency is coming within the range of water (25% to 36%) So, the Standard Consistency of cement paste is 35% . This test also gives us information that how much amount of water is enough to prepare a paste of cement before using it at the site at the time of construction.
d.Setting Time Test
The initial setting time is the time elapsed between the moment that the water is added to the cement, to the time that the paste starts losing its plasticity. The final setting time is the time elapsed between the moment the water is added to the cement, and the time when the paste has completely lost its plasticity and has attained sufficient fineness to resist certain definite pressure. In actual construction dealing with cement paste, mortar or concrete certain time is required for mixing, transporting, placing, compacting and finishing. During this time cement paste, mortar or concrete should be in plastic condition is known as the initial setting time. Normally a minimum of 30 minutes is given for mixing and handling operations. Before commencing setting time test, do the consistency test to obtain the water required to give the paste normal consistency (P). The constituents and fineness of cement is maintained in such a way that the concrete remains in plastic condition for certain minimum time. Once the concrete is placed in the final position, compacted and finished, it should lose its plasticity in the earliest possible time so that it is least vulnerable to damages from external destructive agencies. This time should not be more than 10 hours which is often referred to as final setting time.
Initial setting time = t2-t1 Final setting time = t3-t1 Where,
t1 = Time at which water is first added to cement
t2 = Time when needle fails to penetrate 5 mm to 7 mm from bottom of the mould t3 = Time when the needle makes an impression but the attachment fails to do so.
Minimum Initial Setting time for PPC cement is 30 min and Minimum Final Setting Time for PPC Cement is 600 Minimum as per IS: 1489, P-1
B. TEST ON AGGREGATE
For Aggregate test we have conducted some different test on Aggregate like Specific Gravity Test, Sieve analysis test, which are described below.
a. Specific Gravity Test b. Sieve analysis test
C. MIX DESIGN
Concrete mix design is step by step procedures to work out the various proportions of the ingredients which go to make concrete. There are various methods of mix design available. These methods can only give guideline to the site engineer to work out the various parameters of concrete mix & it may or may not be necessary to make minor adjustments thereafter. However, it is very essential for the site engineer to get the feel of concrete material &concrete by continuous check on workability, cohesiveness, finished surface, strength & durability parameter. It is only then that the engineer acquires the art of designing concrete mixes.
The method we used is popularly known as 'AMBUJA METHOD'. This method has been adopted on several sites in and around Mumbai and has given technically and economically good results.
In this method, for various concrete specifications, various tables from IS 456-2000, IS 10262-1982 were referred. Three specimens of each cubes, cylinder and beams were casted for different proportions of granite pieces. The aim is to calculate the optimum dosage for improvement of qualities in concrete. The compressive, flexural and split tensile strength is calculated for specimens for 7 days, 14 days, and 28 days. Design mix for M40 grade concrete was prepared by partially replacing granite piece with coarse aggregate.
For calculating the various strength and properties of concrete tests were performed on the specimens viz., cubes of size 150mm × 150mm, beams of length 500mm and cross section of 100mm, and cylinder of diameter 150mm of length. Temperature at various depth was calculated with the aim to get our experimental temperature differential for our pavers and market manufactured pavers.
V.
TESTS FOR PROPERTIES ON CONCRETE SPECIMEN
For Concrete test we have conducted some different test on concrete Compressive Strength Test, Split Tensile Strength Test, and Flexural Strength Test which are described below.
A. Compressive Strength Test
Compressive strength of concrete is a measure of its ability to resist load, which tends to crush it. Most common test on hardened concrete is compressive strength test. It is because the test is easy to perform. Furthermore, many desirable characteristic of concrete are qualitatively related to its strength and the importance of the compressive strength of concrete in structural design. The compressive strength gives a good and clear indication that how the strength is affected with the increase of granite volume dosage rate in the test specimen.
B. Split Tensile Strength Test
The concrete is very weak in tension due to its brittle nature and is not expected to resist the direct tension. The concrete develops cracks when subjected to tensile forces, it necessary to determine the tensile strength of concrete to determine the load at which the concrete members may crack. Tensile strength of concrete is a measure of its ability to resist forces, which stretch or bend it. Unlike steel, the concrete is sufficient in strength only in one direction. Nevertheless, it is an important property in many applications.
C. Flexural Strength Test
Flexural strength of concrete is a measure of its ability to resist bending. Flexural strength can be expressed in terms of 'modulus of rupture'. Concrete specimens for flexural strength were cross sectional are of 100mm width and 500mm of length with the concrete. The task of this test was performed to find the flexural strength of the beam, and to compare its differences. Types of loadings are Third -point loading and Centre-point loading. Centre-point loading is when the entire load is applied at the centre span. The maximum stress is present only at the centre of the beam. Third-point loading is the when half the load is applied at each third of span length. Maximum stress is present over the centre 1/3 portion of beam. We have applied loading in this manner. Use of three-point loading is preferred for determining flexural strength of concrete in IS 516. The load shall be applied through two similar rollers mounted at the third points of the supporting span that is, spaced at 20 or 13.3 cm centre to centre. The flexural strength test was conducted in the strength of material laboratory. The concrete specimens were cured for 7, 14 and 28 days.
D. TEMPERATURE EFFECT
Fig. 10 Temperature set
VI.
RESULT AND DISCUSSION
The experimental tests were carried out to obtain the mechanical properties of granite aggregate added concrete to use them in the paving block. The comparisons of mechanical properties like compressive strength, split tensile strength and flexural strength is carried out. Effect of replacing coarse aggregate with granite aggregate on concrete was studied. The replacement of material is in increasing percentages by weight of coarse aggregate. Observation for 7, 14 & 28 days curing period were recorded and presented in the form of tables and graphs.
The temperature variations of 24 hours were recorded at interval of one hour, temperature differential was also calculated. The temperature differential is a function of solar radiation received by the pavement surface, wind velocity, thermal diffusivity of concrete, latitude, longitude and elevation of the place and is thus affected by geological features of the pavement location. As far as possible, temperature differential values estimated realistically for the given site using relevant geographical parameters and material characteristics should be used for calculation of temperature gradient. The variation of temperature with depth is nonlinear during night hours. The maximum temperature differential during the night is nearly half of the day time.
A. Specific gravity test
The specific gravity of an aggregate is the ratio of the weight in air of given volume of aggregate particles at a stated temperature to the weight of an equal volume of distilled water under the same conditions. It is necessary because the aggregate may contain water permeable voids.
The purpose of specific gravity of an aggregate is often used in relating weight of aggregate to its volume. a. Specific gravity of fine aggregate
Table no. 4.1 Specific gravity of fine aggregate
Type of material Fine aggregate
Sample 1 2 3
Wt of container 670 670 670
Wt of container + solid 1100 1130 1120
Wt of material + water + solid 1820 1880 1860
Wt of container + water 1560 1590 1580
Specific gravity of material 2.5 2.7 2.65
Average specific gravity of Fine aggregate 2.76 RESULT: -The specific gravity of give fine aggregate sample is 2.6
c. Specific gravity of coarse aggregate (10mm+20mm)
Table no. 4.2 Specific gravity of coarse aggregate (10mm+20mm) Type of material Coarse Aggregate 10mm+20mm
Sample 1 2 3
Wt of container 670 670 670
Wt of container + solid 1170 1090 1080
Wt of material + water + solid 1790 1770 1780
Wt of container + water 1520 1510 1520
Specific gravity of material 2.93 2.625 2.73
Average specific gravity of coarse agg. 10mm+20mm 2.76 RESULT: - The specific gravity of given aggregate sample is 2.76
C.Specific gravity of granite
Table no. 4.3 Specific gravity of granite aggregate
Type of material Granite chips
Sample 1 2 3
Wt of container 670 670 670
Wt of container + solid 1060 1090 1076
Wt of material + water + solid 1810 1830 1825
Wt of container + water 1555 1562 1552
Specific gravity of material 2.89 2.75 2.95
RESULT: - The specific gravity of given granite sample is 2.86. B. Sieve analysis as per IS 23869 (part 4)- 1963
Fineness modulus is an empirical factor which is one hundredth of the sum of cumulative percentages of fractions of a sample retained when sieve successfully through the following IS sieves in that order: 10 mm, 4.74 mm, 2.36 mm, 1.18 mm600 micron, 300 micron, 150 micron, pan.
a.Sieve analysis of fine aggregate
Table No. 4.4 Sieve analysis for fine aggregate IS sieve size Wt. retained (gm) Wt. retained (%) Cumulative wt.
retained (%)
% passing
10mm 0 0 0
100
4.75mm 0 0 0 100
2.36mm 136 13.6 13.60 86.40
1.18mm 483 48.3 61.90 38.10
600 µ 197 19.7 81.60 18.40
300 µ 122 12.2 93.80 6.20
150 µ 37 3.70 97.50 2.50
75 µ 13 1.30 98.80 1.20
Pan 12 1.20 100 0
RESULT:-The fineness modulus of fine aggregate is found to be 3.48 b.Sieve analysis of coarse aggregate (10mm+20mm)
Table No. 4.5 Sieve analysis for coarse aggregate (10mm+20mm) IS sieve size Wt. retained (gm) Wt. retained (%) Cumulative wt. retained
(%)
% passing
20mm 790 15.80 15.80 84.20
16mm 1427 28.54 44.34 55.66
12.5mm 976 19.52 63.86 36.14
10mm 1097 21.94 85.50 14.28
4.75mm 467 9.34 95.14 4.86
Pan 243 4.68 100 0
RESULT :-The fineness modulus of coarse aggregate is found to be 4.05 C. Workability Result
The slump test is the most well-known and widely used test method to characterize the workability of fresh concrete. This test measures the consistency and is used on job sites to determine rapidly whether a concrete batch should be accepted or rejected. The test method is widely standardized throughout the world. The result of conventional mix and replacement mix are as follows;
Fig no.4.1 Workability for granite aggregate added concrete
45 50 55 60 65
0% 10% 20% 30% 40%
sl
u
m
p
v
al
u
e
(
m
m
)
Replacement of coarse aggregate by granite aggregate
D. TEST PERFORMED ON CONCRETE
Compressive strength, flexural strength, split tensile strength and temperature variation results for mix M40 concrete.
a. For conventional concrete mix M40
Tests results obtained for compressive strength, flexural strength and split tensile strength. Compressive strength for conventional mix M40
Fig.no.4.2 compressive strength for conventional mix M40
From the graph it can be seen that the conventional concrete has achieved satisfying results according to days of curing. i.e. at 7 days period of curing the concrete has achieved above 65% results, at 14 days curing above 90% and at 28 days achieved 100% results.
Flexural strength for conventional mix M40
Fig.no.4.3 Flexural strength for conventional mix M40
From the above graph, it can be seen that the flexural strength for the M40 mix of 7, 14 & 28 days curing shows good gain in strength. 4.2.4 Split tensile strength for conventional mix M40
Split tensile strength for conventional mix M40
Fig.no.4.4 Split tensile strength for conventional mix M40
From the above graph it is observed that the split tensile strength for granite added concrete satisfying results are obtained according to days of curing. i.e. 7, 14 and 28 days.
b. For Granite aggregate added concrete (M40 mix)
0 10 20 30 40 50
7day 14day 28day
Co
m
press
iv
e
st
re
ng
th(N
/m
m
2
)
Period of curing (days)
Compressive strength
0 1 2 3 4 5 6
0 1 2 3 4
Fl
e
xu
ral
st
re
n
gth
in
(N
/m
m
2)
Period of curing (Day)
Flexural strength
0 1 2 3 4
7day 14day 28 day
sp
lit
tens
ile
st
re
ng
th
(N/m
m
2
)
Period of curing
Granite aggregate replacement with coarse aggregate is done in increasing percentages in concrete and from the tests results are obtained for compressive strength, flexural strength and split tensile strength. The percentage replacement was 0%, 10%, 20%, 30% & 40% with coarse aggregate.
Compressive strength for Granite aggregate added concrete
Compressive strength of concrete is a measure of its ability to resist load, which tends to crush it. Most common test on hardened concrete is compressive strength test. It is because the test is easy to perform. Furthermore, many desirable characteristic of concrete are qualitatively related to its strength and the importance of the compressive strength of concrete in structural design. The compressive strength gives a good and clear indication that how the strength is affected with the increase of granite content in the test specimen.
Fig no.4.5 Compressive strength for granite aggregate added concrete
From the above figure plotted graph for the variation in compressive strength for the mix proportion M40 granite replacement with coarse aggregate is added in increasing percentage (0%, 10%, 20%, 30% and 40%) in the concrete and the results obtained for compressive strength. It is observed that use of granite aggregate increases the compressive strength at 20% to 30% and then reduction in compressive strength is observed when percentage of granite increases beyond 30%. The graph shows drop after 30% granite agg. Here the 30% shows higher compressive strength which is more than conventional mix. So we conclude that the optimum value of granite agg.is 30% for compressive strength.
Flexural Strength for Granite aggregate added concrete
Flexural strength of concrete is a measure of its ability to resist bending. Flexural strength can be expressed in terms of 'modulus of rupture'. Concrete specimens for flexural strength were cross sectional are of 100mm width and 500mm of length with the concrete. The task of this test was performed to find the flexural strength of the beam, and to compare its differences.
Fig.4.6flexural strength for granite aggregate added concrete
0 10 20 30 40 50 60 70
0% 5% 10% 15% 20% 25% 30% 35% 40% 45%
Co
m
p
re
ssi
ve
S
tr
e
n
gth
(
N
/m
m
2)
Replacement of CA by granite aggregate
7 day 14 day 28 day
0 1 2 3 4 5 6 7 8
0% 10% 20% 30% 40%
F
lex
ura
l st
re
ng
th in (
N/m
m
2
)
Replacement of CA by granite aggregate
From the above graph plotted for the variation in flexural strength for mix proportion M40 with respect to varying granite content (0%, 10%, 20%, 30%, 40%) shows the drop of strength after 30% granite aggregate addition. And 40% granite replacing to coarse aggregate shows lower strength. So we can conclude that the optimum value of granite for flexural strength is 30% 0f replacement of coarse aggregate.
Split tensile strength for granite added concrete
The concrete is very weak in tension due to its brittle nature and is not expected to resist the direct tension. The concrete develops cracks when subjected to tensile forces, it is necessary to determine the tensile strength of concrete to determine the load at which the concrete members may crack. . Tensile strength of concrete is a measure of its ability to resist forces, which stretch or bend it. Unlike steel, the concrete is sufficient in strength only in one direction. Nevertheless, it is an important property in many applications.
Fig.no.4.7 Split tensile strength for granite aggregate added concrete
From the above graph plotted for the variation of split tensile strength for mix proportion M40 with respect to varying waste granite content (0%, 10%, 20%, 30% and 40%) shows the increase in split tensile strength at 10%, 20%, 30% and drop is observed above 30%.And 40% granite replacing to coarse aggregate shows lowest strength. So we conclude that the optimum value of waste granite aggregate for split tensile strength is 30% of replacement of coarse aggregate.
VII.
RESULTS OF PAVER
For the mix proportion M40 grade concrete granite aggregate replacement with coarse aggregate is added in linearly varying percentage such as 0%, 10%, 20%, 30% and 40% in the concrete and the results obtained for compressive strength, split tensile strength and flexural strength. It is observed that use of granite aggregate greatly affect the mechanical properties of concrete such as compressive strength, split tensile strength and flexural strength. It is seen that gain in strength slightly at 10%. Strength is increasing continuously at 20% and 30% after decrease in compressive strength is observed when percentage of granite aggregate increased above the 30%. The graph shows fall after 30% granite aggregate replacement with coarse aggregate. Here the 30% shows greater compressive strength, split tensile strength and flexural strength which is comparatively better than conventional concrete. Hence the optimum value of granite aggregate is 30% for compressive strength, split tensile strength and flexural strength. From this we have casted the pavers at 30% replacement because it gives the maximum strength. As shown below in table we compared compressive strength of market paver, interlocking paver and square paver as shown below which is comparatively higher than market paver of conventional mix. Compressive Strength of Paver
Fig No.4.8 Compressive strength of paver with 30% replacement of granite added Concrete.
0 1 2 3 4 5 6
0% 10% 20% 30% 40%
S
p
lit
t
ens
il
e
st
reng
th
in
(N/mm2
)
Replacement of CA by granite aggregate
7day 14day 28day
0 20 40 60 80
7day 14day 28day
Co
m
p
re
ssi
ve
Str
e
n
gth
(N
/m
m
2)
Period of curing (day)
Bar graph shows the Comparison of compressive strength for interlocking paver, square paver and market paver at the age of curing 7 day, 14 day and 28 day. On comparing the compressive strength of interlocking paver, square paver and market paver we get the maximum value of compressive strength for square paver at the age of 28 days of curing.
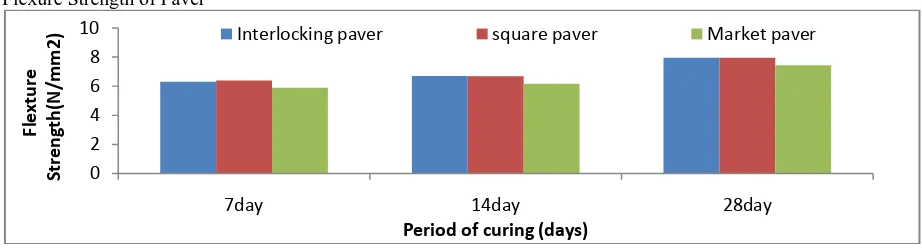
Flexure Strength of Paver
Fig no 4.9 Flexure strength of paver with 30% replacement of granite added Concrete
Bar graph from the figure above shows the variation in flexural strength for the type of materials used in concrete mix. Here granite replaced with coarse aggregate shows comparatively greater strength than that of market paver of conventional concrete mix. Bar graph shows the Comparison of flexural strength for interlocking paver, square paver and market paver at the age of curing 7 day, 14 day and 28 day. On comparing the flexural strength of interlocking paver, square paver and market paver we get the maximum value of flexural strength for square paver and interlocking at the age of 28 days of curing.
A. Variation of Temperature in Concrete Paver
Temperature differential between the top, middle and bottom of concrete pavers causes the concrete paver to curl, giving rise to stresses. The temperature differential is a function of solar radiation received by the paver surface, wind velocity, thermal diffusivity of concrete, latitude, longitude and elevation of the place and is thus affected by geological features of the paver location. As far as possible, temperature differential values estimated realistically for the given site using relevant geographical parameters and material characteristics should be used for analysis.
The maximum temperature differential during the night is nearly half of the day time maximum temperature differential. The timings refer to Indian Standard time and may be different for different geographical locations in India. Our temperature analysis is purely focuses on keeping our manufactured paver’s temperature low. For the analysis we drill the pavers according to the varying depth. Three holes had been drilled one just below the top layer, second at the middle and third near the bottom. For comparison we take two pavers having the same dimensions as ours from the market and accordingly drilled. The temperature readings are taken after every hour. We started at 7 PM and ended at next day 7 PM. We have 24 hours temperature readings from which following graphs has been plotted
Fig no 4.10 Temperature variation for Top hole in our and market manufactured parking paver
0 2 4 6 8 10
7day 14day 28day
Fl
e
xtu
re
Str
e
n
gth
(N
/m
m
2)
Period of curing (days)
Interlocking paver square paver Market paver
0 5 10 15 20 25 30 35 40 45 50 55
TE
PR
A
TURE
IN
DE
G
R
EE
CE
LCIUS
HOURS
PARKING PAVER TOP
Fig no 4.11 Temperature variation for Top hole in our and market manufactured square paver
Fig no 4.12 Temperature variation for Middle hole in our and market manufactured parking paver
Fig no 4.13 Temperature variation for Middle hole in our and market manufactured square paver 0
10 20 30 40 50 60
TE
MPR
ET
URE
IN
DE
G
R
EE
CE
LCIUS
HOURS
SQUARE PAVER TOP
SQUARE OUR (T) SQUARE MARKET(T)
0 10 20 30 40 50 60
TE
MPR
ET
URE
IN
DE
G
R
EE
CE
LCIUS
HOURS
PARKING MIDDLE
PARKING MARKET(B) PARKING OUR(B)
0 20 40 60
TE
MPR
ET
URE
IN
DE
G
R
EE
CE
LCIUS
HOUR
SQUARE MIDDLE
Fig no 4.14 Temperature variation for Bottom hole in our and market manufactured parking paver
Fig no 4.15 Temperature variation for Bottom hole in our and market manufactured square paver
Temperature Gradient calculations:
Fig no 4.16 Temperature variation for our manufactured parking paver
Temp. gradient = Highest temperature at top for 24 hours – Lowest temperature at bottom for 24 hours Temperature gradient for parking paver our manufactured = 50.7° - 28.7° = 22°C
0 20 40 60
TE
M
PR
ET
U
RE
IN
D
EG
RE
E
CE
LCIUS
HOURS
PARKING BOTTOM
PARKING MARKET(B) PARKING OUR(B)
0 20 40 60
TE
MPR
ET
URE
IN
DE
G
R
EE
CE
LCIUS
HOURS
SQUARE BOTTOM
SQUARE OUR(B) SQUARE MARKET(B)
0 10 20 30 40 50 60
TE
MPR
A
TURE
IN
DE
G
R
EE
CE
LCIUS
HOURS
PARKING PAVER OUR
Fig no 4.17 Temperature variation for market manufactured parking paver
Temp. gradient = Highest temperature at top for 24 hours – Lowest temperature at bottom for 24 hours Temperature gradient for 150mm slab = 52.2° - 28.8° = 23.4°C
Fig no 4.18 Temperature variation for our manufactured square paver
Temp. gradient = Highest temperature at top for 24 hours – Lowest temperature at bottom for 24 hours Temperature gradient for 150mm slab = 49.1° - 28.3° = 20.8°C
Fig no 4.19 Temperature variation for market manufactured square paver 0
10 20 30 40 50 60
TE
MPR
A
TURE
IN
DE
G
R
EE
CE
LCIUS
HOURS
PARKING PAVER MARKET
PARKING MARKET(T) PARKING MARKET(M) PARKING MARKET(B)
0 10 20 30 40 50 60
TE
MPR
A
TURE
IN
DE
G
R
EE
CE
LCIUS
HOURS
SQUARE PAVER OUR
SQUARE OUR (TOP) SQUARE OUR(MIDDLE) SQUARE OUR(BOTTOM)
0 10 20 30 40 50 60
TE
MPR
A
TURE
IN
DE
G
R
EE
CE
LCIUS
HOURS
SQUARE PAVER MARKET
Temp. gradient = Highest temperature at top for 24 hours – Lowest temperature at bottom for 24 hours Temperature gradient for 150mm slab = 53.1° - 29.1° = 24°C
Comparative graphs:
Fig no 4.20 Temperature variation in top holes for all pavers
Fig no 4.21 Temperature variation in middle holes for all pavers
Fig no 4.22 Temperature variation in bottom holes for all pavers 0
20 40 60
TE
MPR
ET
URE
IN
DE
G
R
EE
CE
LCIUS
HOURS
PAVER TOP
PARKING PAVER OUR(T) PARKING PAVER MARKET(T)
SQUARE OUR (T) SQUARE MARKET(T)
0 10 20 30 40 50 60
TE
MPR
ET
URE
IN
DE
G
R
EE
CE
LCIUS
HOURS
PAVER MIDDLE
PARKING MARKET(M) PARKING OUR (M) SQUARE OUR(M) SQUARE MARKET(M)
0 10 20 30 40 50 60
TE
M
PR
ET
U
RE
IN
D
EG
RE
E
CEL
CIU
S
HOURS
PAVER BOTTOM
D. Cost effectiveness
Table no. 4.15 cost calculations for conventional paver block
Table no. 4.16 cost calculations for sustainable paver block
The tests on material such as specific gravity, sieve analysis and fineness modulus etc. are carried out to verify material properties. When the granite aggregates are replaced with coarse aggregate for 10% it is found that the compressive strength is 44.12 N/mm2 which is equal or slightly greater than compressive strength of conventional concrete i.e. 42.4 N/mm2. Then we replace it by 20%, it is seen that there is continuous rise in the strength. After this replacement is done by 30% and we get maximum values of strength. Again the granite aggregates are replaced with coarse aggregate for 40% then there is reduction in strength. Hence 30%replacement shows significant results for mechanical properties of concrete. With the help of these facts the optimum quantity is taken as 30% replacement.
When the coarse aggregate is replaced with granite aggregate for various percentages, it is found that maximum or higher values are obtained on the 30% replacement of coarse aggregate by granite aggregate for the compressive strength which is comparatively better than conventional concrete. For the Flexural strength optimum value is observed at 30% replacement. Also for the split tensile` strength optimum value is observed at 30% replacement. In case of compressive strength and split tensile strengths the strength was satisfactorily good and greater than conventional concrete. But the flexural strength is also more than conventional concrete strength. One significant fact is observed that compressive strength of granite aggregate added concrete is much more than conventional concrete.
When comparison for temperature variation in between sustainable paver and market paver of conventional concrete mix is made, it is observed that there is reduction in temperate of paver in case of sustainable paver than the market paver due to addition of marble crushed powder at top surface. Hence it also contributes in reduction of temperature of paver up to 1.4°c than interlocking parking paver and 4°c for square paver.
VIII.
CONCLUSION
In this research we have studied the usage of waste granite and their behavior on different mechanical properties of concrete and the effect on the concrete. The research project utilizes the waste granite as a replacement with coarse aggregates in different percent which enhance the mechanical properties of concrete. The analysis for various temperature differentials of our casted paving block and paving block available in market are compared. 1. As per our research, best suited method for the mix design of concrete is Ambuja Cement Method amongst all other design methods.
2. The experimental work shows that the mechanical properties of concrete of grade M40 get improved due to incorporation of waste granite.
SR.NO. MATERIALS RATES(RS./KG) QUANTITY (KG) PRICE (RS)
1. CEMENT 6.2 0.8 4.96
2. FINE
AGGREGATE 0.42 1.61 0.68
3. COARSE
AGGREGATE 1 0.68 0.74 0.5
4. COARSE
AGGREGATE 2 0.68 1.39 0.95
RS. 7.09 /-
SR.NO MATERIALS RATES(RS/KG) QUANTITY (KG) PRICE (RS)
1 CEMENT 6.2 0.694 4.30
2 FINE
AGGREGATE 0.42 1.396 0.586
3 COARSE
AGGREGATE 1 0.68 0.088 0.059
4 COARSE
AGGREGATE 2 0 0.552 0
5 GRANITE 0.68 0.648 0.441
RS.
International organization of Scientific Research
73 | Page
3. From the experimental results, we can say that concrete give the optimum results at 30% replacement of coarse aggregates with granite.4. It is observed that the addition of crushed granite improves the compressive strength at 28 days.
5. As the percentage of granite increases up to optimum dosage the mechanical properties of concrete like compressive strength, flexural strength and split tensile strength also increases. The compressive strength of concrete increases by 41.08% as compared to the conventional concrete.The flexural strength of concrete increased by 41.45% and the split tensile strength of concrete increased by 43.66% on comparing with the conventional concrete mix.
6. After studying the temperature analysis, we can say that our casted paving block is more suitable in higher temperature (as results were observed for 24 hours) than the market paving block.
7. It will be more cost effective as the waste product is used.
REFERENCES
[1]. Osman Gencela et al. “Properties of concrete paving blocks made with waste marble” A Civil Engineering Department, Faculty of Engineering, Bartin University, 74100 Bartin, Turkey.
[2]. ShowkatMaqboolBhat “A Comparative Study Of Amalgamation Of Various PET Fibres In Concrete And Their Influence On Mechanical Properties: A Review” Dept. of civil Engineering, SOET, BGSB University-Rajouri (J&K), India. International Journal of Advance Engineering and Research Development.Volume 5, Special Issue 01, Jan.-2018.
[3]. M. Krishnamoorthy et al. “Durability Studies on Polyethylene Terephthalate (pet) Fibre Reinforced Concrete” Research Scholar, School of Civil Engineering, Karunya University, Tamilnadu, Coimbatore, India. International Journal of Civil Engineering and Technology (IJCIET) Volume 8, Issue 10, October 2017.
[4]. Sudarshan D. Kore and A. K. Vyas “Impact of Marble Waste as Coarse Aggregate on properties of lean cement concrete.” Research Scholar and Professor, Department of Civil Engineering, Malaviya National Institute of Technology, Jaipur, Rajasthan-302017
[5]. Jay P. Chotaliya, Kuldip B. Makwana, Pratik D. Tank, “Waste Marble Chips As Concrete Aggregate” B.E. CIVIL, G.E.C, Rajkot. 2016 IJEDR Volume 4, Issue3 ISSN: 2321-9939.
[6]. Milind V. Mohod, “Performance of Steel Fiber Reinforced Concrete” Assistant Professor, Department of Civil Engineering, P.R.M.I.T.&R., Badnera. International Journal of Engineering and Science ISSN: 2278-4721, Vol. 1, Issue 12 (December 2012)
[7]. Ambuja cement literature, Gujarat Ambuja cements limited, Technical service division, Mumbai-400093-November,2012
[8]. Indian Standard 15658 (2006) : Precast concrete blocks for paving.