International Journal of Business and Applied Social Science (IJBASS)
VOL: 4, ISSUE: 9September 2018
http://ijbassnet.com/
E-ISSN:2469-6501
©Center for Promoting Education and Research (CPER) USA
,
www.cpernet.org
Classification of the Micro, Small, Medium and Large (MSMLE’s) enterprises in Belize, based on the Free Cash Flow (FCF).
Dr. Romaldo Isaac Lewis (DBA) Faculty of Management & Social Sciences
University of Belize Phone: 501-822-3680 Ext 140
Email: [email protected] Abstract
The objective of this research was to classify the enterprises into Micro, Small, and Medium & Large (MSMLE’s) in Belize base on its Free Cash Flow (FCF). The data that was used came from 1500 enterprises distributed within the nine municipalities through the country of Belize. The method that was used to classify the enterprises base on the Free Cash Flow was the Discriminant Analysis method. The specific objectives of this research were to 1) Evaluate the accuracy level in the classification of the enterprises in Belize. 2) Determine correlation level, or association of the contributing indicators or Factors, in the classification process, 3) Estimate a Mathematical Equation for Enterprise classification into MSMLE's for Belize. The study found that the Discriminant Analysis (DA) calculated four groups that can be classified as Micro, Small, Medium and Large Enterprises(MSMLE’s). Additionally, it confirmed an accuracy level of 98.8%. Furthermore the calculated Mathematical Equation for unstandardised values is as follows:D1= -13.186 + 5.723EBT(X1) -0.258BT(X2) + 0.013GST(Xӡ) + 6.954NOPAT(X4) + 0.105EI(X5).
Keywords: Free Cash Flow; Micro, Small, Medium and Large Enterprises (MSMLE’s); Taxes; Nopat; Belize; Discriminant Analysis
1. INTRODUCTION
The main objective of this study was to classify the firms into Micro, Small, Medium and Large Enterprise (MSMLE’s) within the Belizean economy. The study was concluded with the use of a Discriminant Analysis as an agglomeration procedure that determined the Discriminant Functions, Coefficients, and Association Level (%), as well as the accuracy level of the selected cases or enterprises into its appropriate groups. The study was based on the information of 1500enterprises from the nine municipalities of the country. The sales and operational cost was then calculated to obtain the Earnings before Interest & Tax (EBIT).
Additionally, the General Sales Tax (GST) and the Business Tax (BT) was deducted from the Earnings before Interest & Tax (EBIT), which then resulted in the Net Operating Profit after Tax (NOPAT). Nopat was then used to subtract the reinvestment to get to the Free Cash Flow (FCF). Today’s modern business model, calls for the most competitive enterprise to apply the most efficient management instrument continuously in order
to stay on top and to prevent other from be active or determined competitors.
For the country to continue its long journey towards Enterprise development, it is important to design strategic plans that will design research to answer entrepreneur questions. These questions will facilitate and lead us into new horizons, providing that the required resources of human capital, finance, time, equipment and infrastructure are available to provide the services to the market. These instruments will create innovative tools and strategies for business creation, development, monitoring, and evaluation for long term sustainability.
International Journal of Business and Applied Social Science (IJBASS)
VOL: 4, ISSUE: 9September 2018
http://ijbassnet.com/
E-ISSN:2469-6501
©Center for Promoting Education and Research (CPER) USA
,
www.cpernet.org
2. LITERATURE REVIEWFree Cash Flow(FCF) can be describe in financial terms as the monies that results from the subtraction of any reinvestment for the Net Operating profit after Tax (Nopat). Nopat as a financial term eliminates completely the influences of taxes since this can increase or decrease the performance of the Free Cash Flow. Meena&Pawan (2009) mentioned that the Discriminant Analysis (DA) can be classified as a technique that is been used when analyzing data that is been categorized on some criteria or dependent variable. For other authors, this technique is been view as a method to discriminate between two or more mutually exclusive and exhaustive groups on the basis of some explanatory variables.
Additionally, the Discriminant Analysis as a process to assess the capacity of the variables to predict the classification of firms or groups within cluster since the analysis also creates an equation which will minimize the possibility ofmisclassifying cases into their respective groups or categories. Finally, a predicated group membership will always perform to reconfirm the accuracy or association level of the cluster groups into membership groups. The Discriminant Analysis main purpose are to 1) To maximally separate the groups, 2 To determine the most parsimonious way to separate groups, and 3) To discard variables that are little related to group distinctions. However researchers are always interested in the relationship between groups of independent variable.
In today’s world of investment portfolio, the Free Cash Flow is a modern practical terminology used to indicate, classify or identify the liquidity of an enterprise, especially for turnover reasons. Therefore authors indicated that researcher would also like to know how many dimension are needed to express the relationship. By the use of this relationship, we can predict classification based on independent variable or assess how the independent variables separate the categorises in the classification.
3. HYPOTHESIS
3.1 Null Hypothesis
1. There is no statistical significance in the effects caused by the financial indicators as well as the clusters.
2. The accuracy level that results from the Discriminant Analysis is equivalent to 95% or more.
4. OBJECTIVES
4.1 Specific Objectives
1. Evaluate the accuracy level in the classification of the enterprises in Belize.
2. Determine correlation level, or association of the contributing indicators or Factors, in the classification process
3. Estimate a Mathematical Equation for Enterprise classification into MSMLE's for Belize.
5. METHODOLOGY
For this particular study a convenient stratified sample of 1500 enterprise were selected to participate in the process throughout the country of Belize, a number that is equivalent to an average of 15% of the population (10,233) of registered enterprisesin the nine municipalities in the country. Information was taken from the enterprises that were registered during the last three fiscal years (April 1st, 2013 to Mach 31st 2016).
In order to obtain a very high confidential level degree, 95% was used and can be translated to the level of probabilistic success and 5% tolerance or failure as illustrates below:
= ((Z²) * P * q) / (e²) = Provisional Sample size
Z² = Abscissa of the normal curve (1.96) P = Proportion within the population q = (1- p) e² = Precision level or variability
n = Sample size n = / ((1 + (/N)
N = Number of enterprises [15].
5.1 Discriminant Analysis as classification methodThe Discriminate Analysis was used as the classification method considering that is useful in determining whether a set of variables is effective in predicting category membership. Additionally, its prediction equations is based on method that develops a multiple regression equation for each group, ignoring the discrete nature of these options let you specify where to store various row-wise statistics as observed in the table below.
6. Results and Discussion
6.1 Group Membership Application
International Journal of Business and Applied Social Science (IJBASS)
VOL: 4, ISSUE: 9September 2018
http://ijbassnet.com/
E-ISSN:2469-6501
©Center for Promoting Education and Research (CPER) USA
,
www.cpernet.org
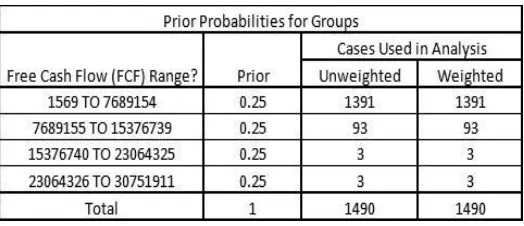
Table 1: Classification Processing SummaryThe calculation of prior grouping was as calculated as art of the procedures as illustrated in Table No. 44 the analysis revealed the pre-classification of four groups according to the Free Cash Flow (FCF). Based on a probability of 0.25; 1391 cases were classified between the ranges of $1,569 to $7,689,154, 93 were classified
between the ranges of $7,689,155 to $15,376,739, 3 were classified between the ranges of $15,376,740 to $23, 064,325 and finally; 3 were classified between the ranges of $23,064,326 to $30,751,911 as expressed in the Table No. 2.
Table 2: Prior Probability for Groups.
6.2 Verification of the accuracy of the clustering process
To ensure that the cluster procedure was completed appropriately, a canonical Discriminant analysis was performed on the four-cluster and the Six(6) variables. Three canonical Discriminant functions were significant in deferring among the clusters (p < 0.0005). Table 3: illustrates the Eigen values and Wilks’ Lambda results in the calculation.
The analysis revealed that the Discriminant functions had calculated Eigen values of 9.667, 0.674
and 0.053; with correlations of 0.95, 0.635 and 0.225 respectively. Such Eigen value can be classified as good, with a positive correlation nature for Function 1, 2 and 3; the classification of the correlation level is Very High for Function 1, moderate for Function 2 and Low for Function 3.
This correlation also indicates the high efficiency of the Discriminant in discrimination. Wilks’ Lambda calculated a value of 0.053 for the first functions; 0.567 for the second function and finally; and 0.949 for the third function (p< 0.0005) as shown below.
International Journal of Business and Applied Social Science (IJBASS)
VOL: 4, ISSUE: 9September 2018
http://ijbassnet.com/
E-ISSN:2469-6501
©Center for Promoting Education and Research (CPER) USA,www.cpernet.org
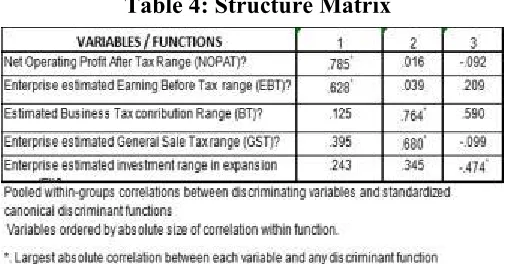
With regards to the second function Business Tax (BT)(X₂) and General Sales Tax (GST)(Xӡ) contribution calculated the correlation of 0.764 and 0.680 respectively. For the last function (3) the Business Tax(BT)(X₂) contributed to a correlation of 0.590 compared to the Earnings before Tax (EBT)(X₁) that calculated 0.209. For a positive correlation this indicates the level of relationship that exists between discriminating variables and the
standardized Discriminant function.
Table 4: Structure Matrix
To evaluate the effect of the individual discrimination of Canonical Discriminant Function Coefficients and the the variables; calculationwas performed on the Standardized group centroidfor the Standardized Canonical Discriminant Canonical Discriminant Function Coefficients and the Function as express in the tables consecutively. group centroid for the Standardized the Standardized
Table 5: Standardized Canonical Discriminant Function Coefficient
According to the calculated Standardized Canonical Discriminant Function Coefficients the most statistically significant function is the First one (1) according to its Eigenvalue (9.667) and the calculated the Chi² value
(4356.61). This indicates that the Discriminant Equation can be expressed for the standardize values as follows:
D1= 0.629EBT(X1) -0.070BT(X2) + 0.003GST(Xӡ) +
0.768NOPAT(X4) + 0.041EI(X5). Table 6, Unstandardised Canonical Discriminant
International Journal of Business and Applied Social Science (IJBASS)
VOL: 4, ISSUE: 9September 2018
http://ijbassnet.com/
E-ISSN:2469-6501
©Center for Promoting Education and Research (CPER) USA
,
www.cpernet.org
The Unstandardised Canonical Discriminant FunctionCoefficients was also calculated here. In line with the above statistical significance, function number one was also used according to its Eigenvalues (9.667) and the calculated Chi² value (4356.61). This measurement
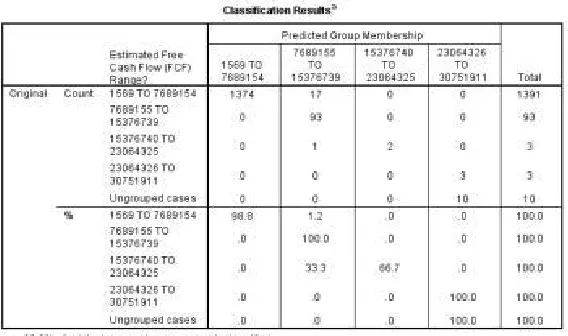
The correct prediction analysis revealed that 98.8% of the cases or enterprises were correctly classified into its corresponding group base on the ranges of the Free Cash Flow (FCF) compared to an insignificant 1.2% of the cases or Enterprises that weren’t correctly classified as illustrated in Table 7.
In conclusion the Discriminant Analysis serves as a statistical procedure to verify and measure the level of
indicates that the Discriminant Equation can be expressed as the unstandardised values as follows:
D1= -13.186+5.723EBT(X1)-0.258BT(X2)+0.013 GST
(Xᴣ)+ 6.954NOPAT(X4) + 0.105EI(X5)
accuracy of the cases classified within and among the groups based on the Free Cash Flow (FCF) ranges of the dependent variable as shown in the Table No 7. It is also a representation of the proximity of the cases around the Group Centroid. Base on this calculation Hypothesis No. 2 is accepted, considering that the prediction of the clusters was higher than 95% as illustrated in the table below.
Table 7; Classification Summary
7. CONCLUSION
1. The Discriminant Analysis (DA) calculated four groups that can be classified as Micro, Small, Medium and Large Enterprises (MSMLE’s), with a confirmed accuracy level of 98.8%.
2. The Mathematical Equation for Unstandardised values for Enterprise classification is as follows:
D1= -13.186+5.723EBT(X1) -0.258BT(X2) + 0.013GST(Xӡ)+6.954NOPAT(X4) + 0.105EI(X5).
3.The calculated correlation value for the equation expressed above is 0.952 according to its Eigenvalues (9.667) and calculated Chi² value (4356.61).
8. RECOMMENDATION
1. Base on the variables evaluated; it is important to classify the enterprises in the country base on financial indicators considering that ithighlights Business Tax
(BT)(X1), General Sales Tax(GST)(Xӡ), and Net Operating Profit after Tax (NOPAT)(X4) and Free Cash Flow (FCF)(X5). Moreover; these variables were statistically significant and highly correlated as expressed in the Eigenvalues.
2. Use the calculated Mathematical Equation for unstandardised values for Enterprise classification as estimated.
3. All municipalities should formalize the informal business sector; by extending a specific license to Mobile Informal Micro Enterprise (MIME’s) that are doing street vending, which can be seen as an avenue to create illegal competition for business.
ACKNOWLEDGMENT
International Journal of Business and Applied Social Science (IJBASS)
VOL: 4, ISSUE: 9September 2018
http://ijbassnet.com/
E-ISSN:2469-6501
©Center for Promoting Education and Research (CPER) USA
,
www.cpernet.org
BIBLIOGRAPHYBoguslauskas, V. & Adlyte, R. (2010), Evaluation of Criteria for the classification of Enterprises, Ruta. Engineering Economics. 2010, Vol. 21 Issue 2, p119-127
Creswell, J.W. (2011), Research Design; Qualitative, Quantitative, and Mixed Methods Approaches, (3rd Ed.), India: Sage Publication, pp. 16– 89
George, D. & Mallery, P. (2014), IBM SPSS; Statistics 21, Step by Step, A simple guide, and reference (13th), Pearson Education Inc: pp. 282-295
Hallberg, K. (2000), A Market-Oriented Strategy for Small and Medium Scale Enterprises; Discussion Paper 40, International Finance Corporation (IFC), USA: pp. 1-23
Harris, E. A. (2010), You can be a successful business person; Micro, Small & Medium Enterprises (MSME’s) Fundamentals, (2nda.Ed.), 1st Ed, USA.
Helfert. E.A. (2001), Financial Tools and Techniques: A guide for managers (1st Ed.), USA: McGraw-Hill, pp. 15-58
Herrle, E. (2006) The promotion of small and medium-sized Enterprises in the EU; Seminar paper: (1st Ed), Germany, pp. 1-23.
Malhorta, M., Chen, Y., Criscuolo, A., Fan, O., Hamel, I. I., & Savchenko, Y (2007), Expanding Access to Finance, Good Practices and Policies for Micro, Small and Medium Enterprises: (1st Ed), Washington, DC: The World Bank, pp. 3-25
Ross, S. A; Westfield, W. R & Jaffe, J. (2010), Cooperate Finance (9ª. Ed.), USA: McGraw-Hill, pp. 300 - 426
Seepersaud, M. M, (2012), Belize MSME policy and strategy report, Belize, pp. 5- 61
Pooja, K. (2009), Micro, Small and Medium Enterprise, (14th Ed.)
Tri Rahayu1, S. A; (2010), Analysis of investment decision in Micro, Small and Medium Enterprise (MSME’s) in Indonesia.
Tambunan, T. Journal of Small Business Management, 2005, Vol. 2 Issue 43,p13-15.
Vintila, G. & Ghenghina, S.C (2014), Pattern recognition techniques to classify the European Markets companies from the valuation perspective, Jan, Vol. 48, Issue 1, p.1-17.
Warner, R. M; (2012), Applied Statistics: From Bivariate Through Multivariate Techniques, (2nd ed), Sage Publication Inc, pp. 51-59