Research Article
Comparative Analysis of Machine Learning Algorithms on
IVR data
Aswin.T.S
1*, Himanshu Batra
1and Mathangi Ramachandran
11Data Science Group, [24]7.ai India
Abstract
We aim to classify IVR data (Interactive Voice Response) and provide a detailed summary of the methods and techniques we employed to create a classifier model of reasonably high accuracy. This model is built to process large datasets of customer grievance lines (in IVR form converted to text), clustering and classifying these lines as accurately as possible. Here machine learning algorithms have been used to build text classifier models, in both supervised and unsupervised approaches on IVR datasets, and their labels have been checked for accuracy. Documentation of the methods applied gives insight into how best we can extract meaningful information and perform classification. By ensuring optimization in the classification of large datasets, resources like time, money and human effort are saved in the long run, and the data is more purposeful.
Keywords: IVR data classification, machine learning on IVR data, text classification, analysis of machine learning methods Received on 11 April 2018, accepted on 06 May 2018, published on 12 June 2018
Copyright © 2018Aswin.T.Set al., licensed to EAI. This is an open access article distributed under the terms of the Creative Commons Attribution licence (http://creativecommons.org/licenses/by/3.0/), which permits unlimited use, distribution and reproduction in any medium so long as the original work is properly cited.
doi: 10.4108/eai.12-6-2018.154814
*Corresponding author. Email: [email protected]
1. Introduction
We need no convincing that data organization is the need of the hour [1]. The advantages of having data classified optimally are ever growing, with every passing hour. Analysis and classification is used even to aid in decision making and optimizing time and resources allocated [2]. In the service provider industry it is essential to identify the shortcomings of programs in their policies or in implementation. With the advancement in the services industry, it is much easier for end users to send their queries as audio (Interactive Voice Response) clips with a fixed time limit (up to 15 seconds long). This may be considered preferable than typing a lengthy message to explain their concern. From the service provider’s perspective, it would be useful to categorize the queries, to understand the trends as well as make predictions. Rather than manually labelling (i.e. classifying the purpose/ intent of the conversation to a certain category)
the entire dataset it would be to beneficial to have the process automated while keeping the efficiency optimal [5][6][8]. We can make use of open source libraries provide their programs available to the public, making it easy to implement different approaches, tweak function parameters and run machine learning algorithms on the datasets, to build text processing models of high accuracy.
2. Background Information
The data we have used is from the datalogs of a leading service provider. The data previously in IVR format is converted from speech to text format for easy analysis. The datasets we are observing are users’ queries converted to the text format (by speech to text conversion tools). For purpose of measuring accuracy of models built (in both supervised and unsupervised approaches) a large dataset was manually tagged. Some samples lines are shown here along with their labels.
2
IVR line Classification
I need to reset my password
Login-get-help
I forgot my password Login-get-help
Trouble logging in Login-get-help
I think my account has been hacked
Unauthorized-use-report
Unauthorized payment Unauthorized-use-report
My account has been compromised
Unauthorized-use-report
My account has been blocked
Account-suspended-get-help
Why has my account been suspended
Account-suspended-get-help
My account is suspended
Account-suspended-get-help
Table1. Sample lines with their labels
By ‘tagging’ or labelling the lines, the entire dataset will become understandable and much value can be inferred from the datasets. For huge datasets, the IVR lines will take too long to manually tag and can be a cumbersome process. For building a supervised machine learning model, we may need to tag enough lines to build an efficient model, because the model needs to have a good dataset to train on, so that it can best identify similar entries in future tests.
However, in the unsupervised scenario, we will not need a dataset to train the model. By building an unsupervised model, we will eliminate the need to manually tag a huge dataset of entries (which would have been needed as a one-time prerequisite for supervised model building). Our approach has been to first build an unsupervised machine learning model and test its accuracy with another dataset which is already tagged, so as to evaluate both the model’s efficiency and how the different processes employed in building the unsupervised model contribute to the accuracy rating of the model.
3. Data pre-processing
Pre-processing of the data includes data-cleaning, or noise removal. It means that we need to optimize the data to ensure that un-necessary markers in the dataset are not picked up by the model, either for training or for testing. First we must remove or mask content in the dataset that are not relevant to our purpose. This content includes locations, geographical regions, names of vendors, products, product models, profanity, numbers, date, currency, family relation (ie. Sister, brother, father.,etc), company contact designation (i.e supervisor, manager, executive, agent).
Processing are imported. The open source library NLTK (Natural Language Tool Kit) has a list of words called ‘stopwords’ which include words not required to be picked up by the model for training or testing. A few words in the list include: “all”, “should”, “being”, “once”, “off”.,etc The list contains around 150 words and can be extended as per user’s convenience.
3.1. Supervised machine learning approach
We shall build a supervised model (using a labelled dataset for training) and evaluate its accuracy with another dataset for noting its accuracy. Generally supervised machine learning models yield results that are more accurate, vis-à-vis unsupervised machine learning models. Before we begin explaining the approaches employed, it is essential to know the datasets employed, i.e. their size, the number of lines, the number of unique ‘labels’ or tags present in them.
File size Number of unique tags
Number of records in the files
3MB 131 19735
Table2. Brief description of the training dataset used Our training dataset may be considered large enough to train the model well, since it contains reasonable number of lines to ensure good coverage of all categories[4]. It is generally not advised to use datasets of small size to train the model as they will act as outliers, i.e. exceptions. Even if other datasets yield a sufficiently good accuracy rating for the model, training or testing the model using small datasets may have adverse consequences, for example: getting a poor rating. Even if the model is trained using a small dataset, the rating will not be optimal when tested with other datasets. Model accuracy was noted at 96.4% (see Fig.1 below). Test dataset has 7922 lines (see Snippet 1 below)
Approach followed:
1. Iterate through every line to extract words 2. Split the words in each document (i.e line) into unigrams,
bigrams and trigrams
3. Concatenate every element into a list
4. Use TF-IDF vectorizer to map the elements of the list to a mathematical array
5. Use Support Vector Machines to build a model from the Tf-Idf vectors
6. Pickle the vectorizer and model for future use without needing to build a model
EAI Endorsed Transactions on
Energy Web and Information Technologies
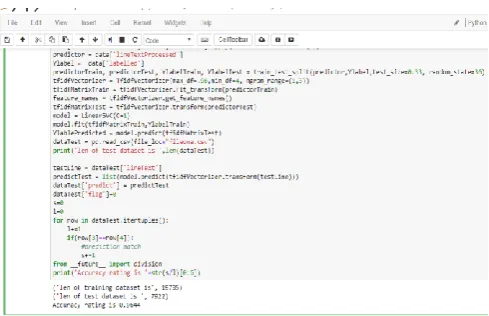
Snippet 1. Code snippet of the supervised approach
3.2. Unsupervised machine learning
approach
Following the Bag of Words Model Approach followed:
1. Iterate through every line to extract words 2. Split the words in each document (i.e line) into unigrams, bigrams and trigrams
3. Concatenate every element into a list
4. Use TF-IDF vectorizer to map the elements of the list to a mathematical array
5. Perform KMeans clustering to cluster the records together.
Number of clusters fixed at 500(a random value, to begin with the process).
6. Each cluster now needs to be labelled, and already contains the label that was manually assigned from the tagging process (let us use them here to check the accuracy of the clustering). For each cluster, let us identify the manual tag that has occurred majority number of times in that cluster, and let us assign that tag to all elements in the cluster.
Then all the tags with labels matching their manually assigned tags are given a flag value of 1 (indicating a match), those whose tags don’t match their newly given labels are given a flag value of 0 (indicating a mismatch). We can check the accuracy of the model by the following formula:
Model accuracy = number of records with label 1/ (total number of records)
In the unsupervised approach we have merged the two files we used earlier (i.e. training data and test data in the supervised approach). So now we use a single dataset of size which is the combination of both the datasets added. Our aim now is to get a ratio of number of correct tags to all the records in the file. A high ratio would indicate that the model accuracy is also high. Let us observe the results for the dataset for clustering the records into 500 clusters for the dataset.
Model
accuracy rating
Execution time Number of records 64.5% 19.9 seconds 27657
Table 3. Model accuracy of approach A
Snippet 2. Code snippet showing the unsupervised approach’s model accuracy
One suggestion for improving model accuracy could be to fix number of clusters needed to a value close to the actual number of tags that exist in the file. In our tests we fixed the ‘k’ value to 500, while the number of unique tags in the datasets were noted to be 131 (refer Table2). A related concept is ‘silhouette analysis’, where a entries of a given dataset are clustered into ‘k’ groups and a score is obtained based on how well the grouping has taken place, i.e an indicator of whether value of ‘k’ has ensured a good clustering[7].
If the entries are clustered well, i.e. if they can be easily placed into a fixed group, the ‘score’ for ‘k’ will be a higher value. Whereas on the other hand if we fix a very small number for ‘k’ value (for eg. Some value much lesser than number of labels existing in the dataset) some entries may seem to be a good match for more than 1 group, and the score for the ‘k’ value will be small. The graph illustrates the relation between number of clusters and the silhouette score.
4
coefficient) for the various fixed number of clusters in each trial.
In fig 1, the graph shows an increasing trend for the silhouette score as the number of clusters increases. We found that there are 131 unique tags in the dataset. But the silhouette clustering suggests that an ideal ‘k’ value would be some peak point between the range 175 to 200 clusters (since high Silhouette score, i.e. peak on the graph implies optimal value of clusters). We observe no definite uniqueness for the silhouette score for the range 125-150 clusters. One would expect a unique high score around 131 clusters (given that the manual tagging informs us of this as the optimal value).
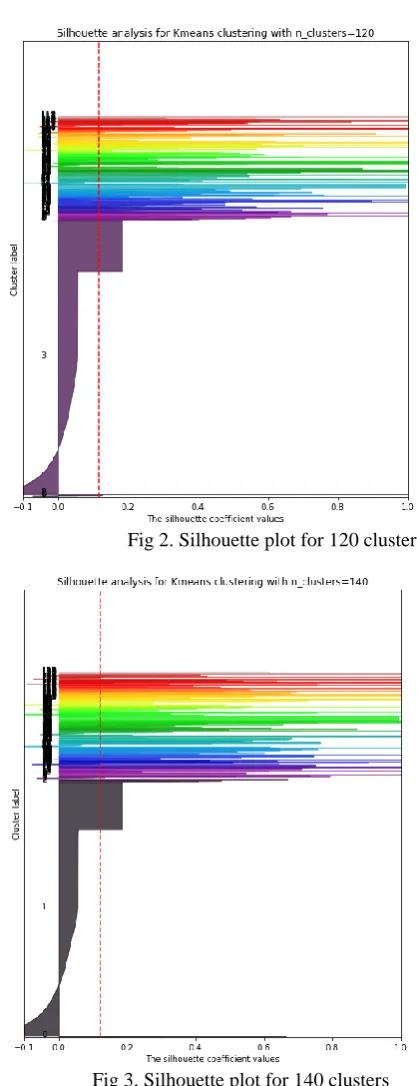
To get a further insight into the clustering, let us observe the silhouette plot for number of clusters to be made fixed at value of 120, 140 and 160, plotted for each line with their silhouette scores. These three values of ‘k’ (i.e. 160, 140 and 120) were chosen because of their proximity to 131 (the number obtained as the optimal ‘k’ by manual labelling of the datasets). The silhouette analysis for the clustering was obtained by using open source library for Python language called Matplotlib. For every line of the dataset, the lines of similar cluster have the same colour and are grouped together. The horizontal value of the line represents the score of that line’s clustering (i.e a score of how good the line matches the cluster). A low score indicates that the line may be a good match for more than one cluster.
The horizontal value of the line represents the score for the individual line’s clustering. We note that some lines have a score of 1, meaning that they are a perfect match for the cluster. We notice from the clustering in Fig 2 below that cluster number 3 seems to have large number of lines belonging in that category compared to other smaller clusters. In group 3 itself, we notice large number of lines having scores close to zero, indicating that the clustering was done poorly.
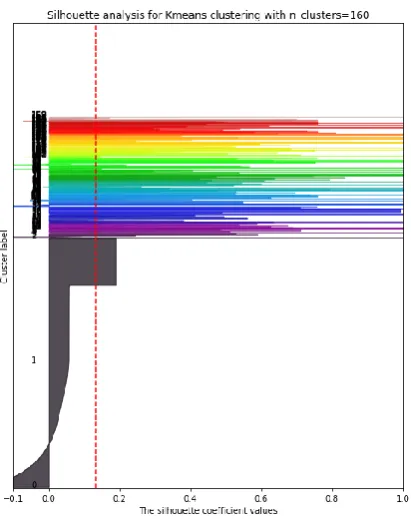
This indicates that it not be efficient to divide the dataset into 120 clusters. Similarly in Fig 3 and Fig 4 below, we notice a single group having large number of lines belonging to that group, and many lines in the group have score near zero. The score or ‘silhouette coefficient’ is along the X axis.
In Fig 2,3 and 4, we also observe that certain clusters have high scores but the number of lines in them are too few, indicated by their height on the vertical axis of the graphs. At the same time, a single group or few have most number of lines in them, but very low scores.
Fig 2. Silhouette plot for 120 clusters
Fig 3. Silhouette plot for 140 clusters
EAI Endorsed Transactions on
Energy Web and Information Technologies
Fig 4. Silhouette plot for 160 clusters
3. Conclusion
1) It was found that unsupervised approaches to build text models did not yield accurate enough results for IVR data. Unless more NLP (Natural Language Processing) techniques are available that can be used with IVR data, we will have to only use supervised models to build efficient text classifier models. Supervised models on the other hand are found to be more efficient.
2) The silhouette analysis did not indicate the ideal value for number of clusters for grouping the data, and did not relate to the grouping of data(as observed from the number of manual tags assigned and the trend of increasing silhouette score as the number of clusters increased).
4. Limitations
Building a model of very high accuracy and efficiency in an unsupervised environment is very challenging because of a variety of reasons: the data may not be pre-processed enough or the model is not able to identify and extract the relevant features, due to language dependencies or other issues.
For best results it is advised to follow a supervised approach to build an efficient model, unless models of similar or better accuracy can be built with an unsupervised approach. Currently available NLP tools do not support building high accuracy text processing models with unsupervised approaches.
One drawback in the supervised approach is that the model needs to be trained before it can accurately identify the required features. For this purpose it is essential to
have large datasets that are tagged and labelled for the model to be trained on. This is a time consuming and exhausting process, apart from the possibility of manual error in tagging. In our analysis we assume that manual tagging is error-free.
5. Future scope
With the evolution of Natural Processing Language (NLP) tools with time, it is expected that we can integrate machine learning systems with almost every gadget in use to support our day-to-day tasks [3].
In our system, we could classify the given IVR content into a predefined category. Further, we could take a certain action or decision based on what category it is classified into. Consider integrating our model with a text-to-speech recognition system and we can obtain an interesting product: a hands-free talkback assistant. This product can have a wide variety of utilities, for eg. a full time helpline system to connect people in distress to law enforcement agencies, to automate replies, to schedule actions, to issue instructions in critical scenarios.,etc Moreover, since it is expected that with time, advanced processors will be available that are cheaper, and more efficient, the reaction or response time of automated systems will be further shortened and operational costs minimized [9][10].
Acknowledgements
The authors would like to thank [24]7.ai India, for the data provided that made this research possible.
References
[1] Business Standard. A safer road ahead via data analytics. (2016, June 6) Retrieved from: http://www.business- standard.com/article/companies/a-safer-road-ahead-via-data-analytics-116060600015_1.html
[2] Economic Times. Analytics critical for enterprise decisions say business heads (2016, February 2). Retrieved from: http://economictimes.indiatimes.com/news/company/corpo rate-trends/analytics-critical-for-enterprise-decisions-say-business-heads/articleshow/50826575.cms
[3] Drucker, Harris, Donghui Wu and Vladimir N. Vapnik. “Support vector machines for spam categorization.” IEEE Transactions on Neural networks 10.5 (1999): 1048-1054 [4] Joachims, Thorsten. “Text categorization with support
vector machines: Learning with many relevant features.” Machine learning: ECML-98 (1998):137-142
[5] Davies, David L., and Donald W. Bouldin. “A cluster separation measure.” IEEE transactions on pattern analysis and machine intelligence 2 (1979): 224-227.
[6] Kao, Anne and Steve R. Poteet, eds. Natural language processing and text mining. Springer Science & Business Media, 2007.
6 “Distributional clustering of words for text classification.” Proceedings of the 21st annual international ACM SIGIR
conference on Research and development in information retrieval. ACM, 1998.
[9] Aggarwal, C.C. and Zhai, C., 2012. A survey of text classification algorithms. In Mining text data (pp. 163-222). Springer, Boston, MA.
[10] Ko, Y. and Seo, J., 2000, July. Automatic text categorization by unsupervised learning. In Proceedings of the 18th conference on Computational linguistics-Volume 1 (pp. 453-459). Association for Computational Linguistics.
EAI Endorsed Transactions on
Energy Web and Information Technologies