Securing Smart Grid In-Network Aggregation
through False Data Detection
Lei Yang, Fengjun Li
∗Department of Electrical Engineering and Computer Science, The University of Kansas, Lawrence,KS, 66045, US
Abstract
Existing prevention-based secure in-network data aggregation schemes for the smart grids cannot effectively detect accidental errors and falsified data injected by malfunctioning or compromised meters. In this work, we develop a light-weight anomaly detector based on kernel density estimator to locate the smart meter from which the falsified data is injected. To reduce the overhead at the collector, we design a dynamic grouping scheme, which divides meters into multiple interconnected groups and distributes the verification and detection load among the root of the groups. To enable outlier detection at the root of the groups, we also design a novel data re-encryption scheme based on bilinear mapping so that data previously encrypted using the aggregation key is transformed in a form that can be recovered by the outlier detectors using a temporary re-encryption key. Therefore, our proposed detection scheme is compatible with existing in-network aggregation approaches based on additive homomorphic encryption. We analyze the security and efficiency of our scheme in terms of storage, computation and communication overhead, and evaluate the performance of our outlier detector with experiments using real-world smart meter consumption data. The results show that the performance of the light-weight detector yield high precision and recall.
Receivedon 25 November 2016;acceptedon 14 January 2017;publishedon 31 January 2017 Keywords: Smart grid, security, anomaly detection
Copyright © 2017 Lei Yang and Fengjun Li, licensedto EAI. This isanopen accessarticle distributedundertheterms of the Creative Commons Attribution license (http://creativecommons.org/licenses/by/3.0/), which permits unlimiteduse,distributionandreproductioninanymediumsolongastheoriginalworkisproperlycited.
doi:10.4108/eai.1-2-2017.152156
1. Introduction
Envisioned as the next-generation power grid, the smart grid is the modernization of the existing power grid with advanced bidirectional communication and per-vasive computing capabilities. The fundamental goal is to introduce intelligent electricity generation, dis-tribution, consumption and management into conven-tional power systems. An essential component of the smart grid is the two-way communication infrastruc-ture that connects energy consumers and suppliers for fine-grained meter readings, real-time status reports (e.g., functional time and diagnostic flags), dynamic pricing and control, etc. However, along with all the advantages, the smart grid with improved communi-cation and computation capabilities inevitably raises new security and privacy risks [18, 28]. With forged
HPlease ensure that you use the most up to date class file, available
from EAI at http://doc.eai.eu/publications/transactions/ latex/
∗
Fengjun Li. Email:[email protected]
consumption data or electricity price, attackers can remotely turn on or off electronic devices in target households, or trigger imbalanced power supplement to cause power outages and tremendous damages [25]. Moreover, fine-grained usage data collected by smart meters often contains sensitive information of energy consumers. For example, a smart meter can learn per-sonal information such as current location and distance traveled while charging an electric vehicle [9]. Usage patterns can also be derived from high-frequency usage data to depict consumers’ demand profiles in a user profiling attack [33]. As such information becomes the primary target of the attackers, they might launch sophisticated attacks to gain access to the consumption data of the victim by eavesdropping the communica-tions, compromising smart meters or utility’s database, etc. Therefore, it is critical to ensure that metering data is securely collected, transmitted, stored and pro-cessed [27].
In the smart grids, a huge amount of real-time information is collected and reported to the Control
on
Industrial Networks and Intelligent Systems
Research Article
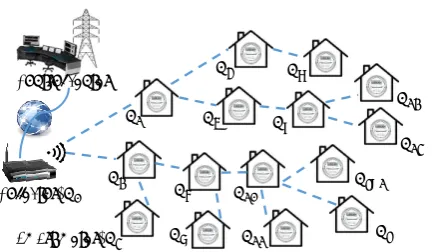
Centerfor timely monitoring. For example, the power consumption data of appliances in a household is collected by the smart meter and reported to a local area gateway (i.e., a Collector). As shown in Figure 1, the collector collects data from a number of smart meters and forwards it to the control center for further analysis. For difference management purposes, the data is collected at different frequencies. For example, summary data for periodic power usage is collected at a low frequency, while usage data for billing with non-constant tariffs or real-time optimization is collected at a high frequency (e.g., every 15 minutes). To report the data, a simple and easy-to-implement approach is to establish a connection between each smart meter and the collector. To protect users’ privacy, their consumption data should not be accessed by the local collector and thus need to be encrypted. However, this end-to-end encryption approach will incur an excessive amount of traffic in the network, especially when collecting the high-frequency smart meter data.
Some management and control applications in the control center only require statistical measurements of the meter data, such as summation, average, or a periodic maximum. Based on this observation, in-network aggregation, which was first designed for wireless sensor network applications [10, 15, 19, 26], has been proposed to solve the secure data collection problem in the Smart Grid Neighborhood Area Networks (NANs). Figure 1 shows a mesh network of interconnected smart meters, which form an aggregation tree. In this network, any smart meter can report its measurement to the collector via multi-hop routing through a set of other meters. The core idea of in-network aggregation is to let the intermediate nodes to perform aggregation functions (such as SUM or AVG) over the meter data that is transmitted though them, and relay only the aggregated result to the next hop. Obviously, individual meter readings are well masked by the aggregated results through this process. Meanwhile, the amount of data transmitted in the NAN is greatly reduced due to aggregation. Finally, since the aggregation is performed in a distributed manner, it also reduces the computation and communication overhead of the collector, comparing to the previous centralized approach.
To provide end-to-end security, smart meters need to encrypt the data before forwarding it to another meter for in-network aggregation. This ensures that the smart meters participating in the aggregation cannot view intermediate or final aggregation results. Li et al. first proposed an aggregation approach to encrypt meter data with homomorphic encryption [23], which supports in-network aggregation operations over the encrypted data. Later, several secure in-network aggregation protocols based on modified homomorphic encryption have been proposed to securely and
𝑁1
Collector: 𝑁0
𝑁4
𝑁2
Smart meter: 𝑁3
𝑁8
𝑁5
𝑁6
𝑁7
𝑁9
𝑁10
𝑁11
𝑁12
𝑁13
𝑁𝑡−1
𝑁𝑡 Control center
Figure 1. An example of in-network aggregation in NAN.
efficiently route the meter data to the collector [14,21, 24].
To ensure confidentiality, integrity and authentic-ity in in-network aggregations, these protocols take a prevention-based approach [37], which adopts enci-pherment and digital signature techniques to prevent the adversary from eavesdropping or altering mes-sages. Security of such approaches heavily relies on the assumption that the adversary can not break cryptog-raphy system. Nevertheless, it neglects the fact that if a smart meter is compromised the adversary is able to steal secret keys, insert or alter output aggregation results to further tamper with critical smart grid func-tions such as load balancing and smart pricing.
Meanwhile, accidental errors may occur in the aggregation result due to malfunctioning smart meters or unreliable wireless transmission channel [36]. Unfortunately, there is only a few work that takes a difference approach other than prevention to address this problem. To the best of our knowledge, [22] was among the first to examine this problem with an attestation-based solution. The incremental integrity check proposed in [22] can be used to verify the aggregate-so-far results based on homomorphic signatures. It also incorporates anomaly detection at the collector to identify irregular data values potentially caused by accidental errors or malicious attacks.
However, to verify that if a meter reading largely deviates from normal data profile, the centralized temporal outlier detection approach requires the collector to store a series of individual metering data over time, which is costly in terms of communication and storage. More importantly, this violates the initial objective of secure in-network aggregation as hiding the fine-grained individual meter readings from intermediate parities including the collector.
group. Similarly, we maintain a time-series data of the overall aggregation result at the collector. Then, we adopt a distance-based outlier detection scheme at the collector. If the final aggregation result is abnormal, we initiate a group-based anomaly detection in groups in a top-down manner, to identify the problematic group(s) and the problematic meter(s). Since anomaly detection requires plaintext data, the collector and the roots of the corresponding groups need to decrypt the time-series data for the outlier detection algorithm. Therefore, we also design a data re-encryption scheme to encrypt the time-series data so that it can be recovered with a temporary key and thus avoid costly system-wide key update. In summary, we make the following contributions in this work:
(1) We present a novel scheme for detecting false data injection in smart grid in-network aggrega-tion. We modify the existing in-network aggregation scheme with dynamic grouping, data re-encryption, and distance-based outlier detection functions to locate abnormal smart meter(s). To the best of our knowledge, this is the first work to integrate distributed anomaly detection with privacy-preserving in-network aggrega-tion, in which smart meter data is protected by additive homomorphic encryption.
(2) We provide a thorough analysis of the security and complexity of the proposed aggregation and verification protocols, and compare the performance of our solution, in terms of storage, computational and communication overhead, to the conventional data aggregation approach.
The rest of the article is organized as follows: we summarize the related work in Section 2, describe network model, threat model and the secure in-network aggregation approach in Section3. Then, we introduce the preliminaries in Section 4 and present the main schemes of our solution in Section 5. We provide the security analysis in Section 6 and evaluate the performance of the proposed solution in Section 7. Finally, we conclude the paper in Section8.
2. Related Work
The mart grids need fine-grained data to efficiently manage power supply and consumption. A large amount of user data needs to be reported to the util-ity company. Therefore, data aggregation is a critical operation in the smart grids to reduce the communica-tion overhead. Motivated by the in-network aggregacommunica-tion solutions for wireless sensor networks, several aggrega-tion protocols using additively homomorphic encryp-tion schemes [16,23,24], have been presented to pro-tect end-to-end data confidentiality and privacy against malicious or “curious” meters en route. However, due to the vulnerability of the wireless network in NANs,
accidental communication errors or external attackers may alter the transmitted metering data, thus, the data integrity was still in risk. Several authentication protocols for smart grid in-network aggregation have been proposed using conventional PKI-based digital signatures [12,34] or short signature schemes based on bilinear maps [21]. However, these solutions are either not compatible with the privacy-preserving in-network data aggregation or introduce excessive hop-by-hop verification overhead. Recently, Li et al. proposed an authentication scheme that supports batch verifica-tion based on a homomorphic signature scheme [22]. However, all these solutions adopt prevention-based approaches, which can detect false data injected by network errors or external attackers without knowledge of the secrets associated with the encryption and signa-ture schemes. Although [22] also proposed a centralized anomaly detection scheme, this scheme introduced a large lose to in-network aggregation. The focus of our work is on a solution for efficient detection of falsified data that are injected into smart grid data aggregation by compromised or malfunctioning meters in a dis-tributed manner.
Research on anomaly detection in the area of smart grids mainly focuses on the detection of abnormal behaviors in the network layer. In [4], Alseiari et al. proposed an intrusion detection system that adopted a mini-batch K-means clustering algorithm to detect abnormal network activities. Following this direction, several anomaly detection schemes based on K-mean clustering have been proposed to identify flooding attacks and denial-of-service in smart grid home area networks [29], and general network attacks against the SCADA industrial control systems [11].
Different from these approaches, our scheme adopts a non-parametric detection algorithm for time-series data to identify abnormal metering readings. Besides, with the fast development of cloud computing platforms, cloud-assisted schemes for enhancing security and privacy of Internet of things (IoT) have become a new trend. Since the cloud-assisted schemes are out of the scope of this paper, interested authors can refer to [6, 17,35].
3. Background and Motivation
3.1. Network Model
Wireless mesh has been widely accepted as a promising communication infrastructure for home area networks (HANs) and neighborhood area networks (NANs) by the majority of US utilities. In this work, we consider a NAN consisting of hundreds of meter nodes (e.g., {N1, N2,· · ·, Nt} in Fig. 1) and a collector node (e.g.,
N0), which further connects to a utility’s wide area
these data to the collector every a certain period. The collector is responsible for collecting data and verifying the data integrity before relaying them to the control center. Similar as the other in-network aggregation approaches for smart grid data collection, a spanning tree (e.g., BFST [23, 24] or MST [21]) is constructed to include all the smart meters in the neighborhood into an aggregation tree. As shown in Fig. 1, when the collector initiates an aggregation query, each smart meter will perform the specified aggregation operation over the inputs from all the child nodes, and then submit the aggregated result to its parent. Finally, the collector obtains the aggregation result and verifies it.
3.2. Secure In-network Aggregation
Privacy-preserving in-network aggregation: In-network aggregation has been widely adopted in wireless sensor networks [10,15,19,26], in which both sensor nodes and aggregation nodes have restricted storage capacity and computational power. It fits in application scenarios where statistical data such as SUM and AVG instead of individual data is of interest, and is proven to be an important primitive to reduce the transmission overhead.
In the smart grids, we consider smart meter not only as measuring tools but also as potential aggregators. Compared with traditional sensors, smart meters are more powerful in terms of storage and computational capability. Compared with conventional data collection scheme that requires each smart meter to directly report to the collector, the in-network aggregation scheme avoids the excessive communication overhead introduced by a large amount of individual multi-hop connection and reduces the computational overhead at the collector for aggregating all the individual readings. As aforementioned, to prevent an intermediate meter from seeing plaintext inputs of its children, homomorphic cryptosystems that support arithmetic operations on the ciphertext domain are employed to encrypt the messages. For most of the aggregation tasks, additive-homomorphism is expected, where the addition of two messages can be obtained by directly performing ciphertext additive operation on the encrypted messages followed by a decryption transformation. For example, Paillier cryptosystem [30] is employed in [23] for privacy-preserving in-network aggregation. It comprises a pair of aggregation keys
< P Kagg, SKagg >, where each meter node encrypts the individual metering data as Ci =Enc(mi, P Kagg) and the collector decrypts the aggregation result (Q
i=1→tCi), which can be represented as an encryption transformation ofP Kagg, with the private aggregation keySKagg.
Signature-based authentication: External adversaries and malicious smart meters can tamper the in-network
aggregation with falsified meter readings. To protect the integrity of the metering data, several signature-based approaches have been proposed [14,21,22]. [22] presented a homomorphic signature algorithm based on a short signature scheme using bilinear pairing. It assumes all the smart meters use a same private signing key SKsig to generate the signature σi, which can be aggregated as Q
i=1→tσi along with the in-network aggregation of the ciphertext messages. In the end, the collector can perform one batch verification to check the integrity of the final aggregation result with the final aggregation signature.
3.3. Challenges and Our Solution
The secure aggregation approaches introduced above can effectively defend against theweak external attackers
who can eavesdrop or alter the transmitted messages without knowing the secrets associated with the encryption or authentication, and thehonest-but-curious internal attackerswho properly follow the protocol with an attempt to sniff confidential data from the relayed messages.
However, when a strong external attacker compro-mises a smart meter, he can take full control of the node. With all the associated secrets, the attacker can inject falsified data or alter the aggregation outputs. Such outputs are properly encrypted with valid sig-natures. Thus, it is extremely difficult, if not impossi-ble, to detect whether the aggregation is polluted by an attacker through the prevention-based approaches which rely on the security of secret keys. Besides, in-network data aggregation is a lossy information com-pression process because all individual meter readings are hidden during hop-by-hop data aggregation. The collector can not tell which meter injects falsified data to the aggregated result. Thus, data aggregation makes it more difficult to identify attack source. Similarly,
malfunctioning meters can generate abnormal readings into the aggregation, which is indistinguishable from the regular readings after being encrypted.
As the goal of the attack is to significantly disrupt the aggregation operations with falsified inputs, it is reasonable to assume that the falsified data transmitted by a compromised or a malfunctioning meter is significantly different from the actual values. Meanwhile, if the attacker only injects a value slightly deviating from the true value to avoid being detected, the falsified data has less impact on the target application.
observations should be highly correlated in time domain. Therefore, we propose an extended kernel density estimator based mechanism to detect falsely injected data as temporal outliers.
Kernel density estimator [32] originally used for anomaly detection in wireless sensor networks (WSN) cannot be directly applied to smart grid in-network aggregation. It is a temporal related anomaly detection technique based on how much the current value deviates from the recent period of historical values. Data in WSN is in the cleartext form and accessible by the detector node (i.e., the sink or neighboring sensor nodes) directly, however in our aggregation scenario, data is encrypted and aggregated from neighbor nodes as well as the intermediate nodes. Moreover, even if the collector is allowed to recover the final aggregation result, it is restricted to see the individual metering data as it is hidden by the aggregation.
Therefore, we design a revised aggregation scheme
to support the transmission and storage of individual metering data at selected verifiers as time-series data for detection while not breaking the security and privacy promises, and a re-encryption scheme to preprocess the encrypted data on-demand for the detector where the kernel density estimator is deployed. To reduce the computation and communication overhead at the collector, we also propose a light-weight dynamic grouping scheme to divide the aggregation tree into connected logical groups and employ the group root as the verifier for each group. To explicitly explain our solution, we define the roles of different nodes: the verifier (root of each group) stores historical data for all group members and verifies the integrity before relaying to-be-examined data to the detector; the
detector uses kernel density estimation based scheme to detect the outlier. Details of the schemes will be explained in Section5.
4. Preliminaries
In this section, we describe the bilinear pairing [7] and proxy re-encryption techniques [5], which are the basis of our solution.
4.1. Bilinear Pairing
For cyclic groupsGand GT of same prime order q, a mape:G×G→GT is a bilinear map if it satisfies the following properties:
1. Bilinear: for all u, v∈G, and a, b∈Z∗q, we have
eua, vb
=e(u, v)ab;
2. Computable: there exists an efficient computable algorithm to compute the map e(u, v) for any
u, v∈G;
3. Non-degeneracy: for the generatorgofG,e(g, g), 1.
4.2. Proxy Re-encryption
Proxy re-encryption scheme allows a proxy to transform a ciphertext computed under Alice’s public key into one that can be decrypted by Bob’s secret key. The proxy re-encryption scheme consists of five algorithms: key generation, encryption, decryption by Alice, encryption and decryption by Bob (here we call it re-decryption):
1. Key Generation: Given bilinear map e:G×G→ GT where g is the generator of G and Z=
e(g, g), Alice and Bob randomly select their private keySKA=a, SKB=bfromZ∗q, and get the corresponding public keyP KA=gaandP KB=gb. Alice is also able to compute the re-encryption key
RKA→B=
gb1/ausing onlySKAandP KB.
2. Encryption: Given a message m∈GT, choose a random numberr∈Z∗q, and the ciphertext can be calculated asCA=Enc(m, P KA) = (Zr ·m, gra).
3. Decryption(Alice): Alice can decrypt the cipher-text asm=Dec(CA, SKA) = Z
r·m e(gra,g1/a) =
Zr·m Zr .
4. Re-encryption: After the proxy receives the re-encryption key generated by Alice, it can transformCAtoCBas
CB=Re_Enc(CA, RKA→B) = (Zr·m, e(gra, RKA→B))
=Zr·m, egra, gb/a
=Zr·m, Zrb.
5. Decryption(Bob): Bob can recover the correspond-ing message as
m=Re_Dec(CB, P KB) = Z r·m
Zrb1/b
.
5. Proposed Solutions
In this section, we propose an efficient and reliable anomaly detection protocol for secure in-network aggregation in smart grid NAN. It consists of a light-weight groupingscheme, a revisedin-network aggregation and in-group incremental verification scheme, adata re-encryptionscheme, and angroup-based anomaly detection
𝑁0
𝑁𝑤 𝑁𝑑 𝑁ℎ
𝑁𝑞
𝑁𝑝
𝑁𝑖
𝑁𝑧 𝑁𝑠
𝑁𝑥 𝑁𝑦 𝑁𝑚 𝑁𝑛
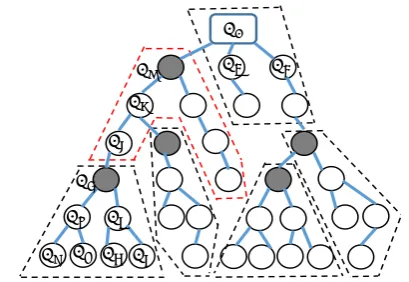
Figure 2. An example of dynamic grouping: the dotted areas are groups and the dark nodes are the root.
5.1. Light-weight Dynamic Grouping
Previous signature-based authentication protocols [14, 22] are centralized approaches in which the collector is assumed to verify the authenticity of the final aggregation result and locate the compromised meter. To do so, the collector has to require each meter’s individual data, which will inevitably increase the computation and communication overhead at the collector, since intermediate aggregation results and individual data are not transmitted to the collector in the aggregation. As such, we employ a light-weight dynamic grouping scheme to divide the aggregation tree into multiple groups, as shown in Fig. 2, for distributed verification and anomaly detection.
The idea is to employ a grouping function F such that each node can calculate its probability of becoming a root with its own topological variables and compare with a pre-defined thresholdTrto decide if it is selected as the root of a group. For example, in Fig. 2, node
Ni calculates Fi > Tr, it then determines itself as the root and all other nodes below itself but not grouped yet as its group members. The grouping decisions are made in a bottom-up fashion. Once the root of a group is determined, an intra-group ID is assigned to each member.
For the grouping, we expect all the groups are of approximately a same size to balance the verification load. To perform on-demand distributed anomaly detection, we will store the historical metering data of all the group members at the root, therefore a small group size is desired. Considering the communication overhead of multihop transmission for historical data collection, although the transmission frequency is much smaller than the aggregation frequency, we still prefer a "short" group (the height of a group is defined as the maximum number of hops from the root to any group member). With all these considerations, we suggest a
grouping function
Fi = 1− 1
e(αθhi+βni) !γ
which takes two positive integers (ni, hi) as inputs and outputs a real number between (0,1), whereni andhi are the number of members and the height of a node
i if node i is the root, respectively.α, β,θ, and γ are the parameters to indicate the impact ofniandhito the grouping decision. For a preferred grouping function,
Fiincreases with the group height and the group size. If a node has largerni andhi, it has higher probability to become a root. Considering the great impact of group height to the communication overhead, we make Fi increases more rapidly withhi. The parameter selection and grouping result will be discussed in Section7.
With the newly constructed logical groups, we expect to distribute the verification and detection load from the collector to the root of the groups. So, the root needs to store time-series individual data for each group member, which will be collected during regular aggregations. Since the data is still encrypted with the public aggregation key, if the root does not collude with the collector (to disclose the data or obtain the secret aggregation key), the privacy of individual metering data is retained. When the root receives a request for verification, it first launches an in-group incremental verification based on the aggregation signatures, similar as in [22]. If the intermediate aggregation result is proven to be valid, it calls for in-group anomaly detection to further examine the input of each member. Before sending the to-be-examined input and the historical data to the selected detector node, the data needs to be preprocessed (i.e., re-encrypted) so that it can be recovered by the detector (we will explain this in section5.3).
5.2. Revised in-network aggregation
Secure in-network aggregation requires both the encryption algorithm and the signature algorithm are additive homomorphic. In the pre-processing of the data for anomaly detection, we further require that the encrypted data supports re-encryption operation to allow the verifier (i.e., the root of the group) to transform the metering data that is originally encrypted under the public aggregation key into a form that can be recovered by the detector’s private key. In this work, we use an ElGamal-based scheme to achieve additive homomorphism, which can also be integrated with the collusion resistant re-encryption scheme based on bilinear maps.
it calculates all required key pairs in our scheme as follows:
1. Select a randoma∈Z∗qto generate the aggregation key pair < SKagg =a, P Kagg =ga>. All meters share P Kagg to encrypt their messages, which supports privacy-preserving data aggregation.
2. Select a randoms∈Z∗q to generate the signature key pair < SKsig =s, P Ksig =gs >. All meters share SKsig =s to sign their messages, which supports the batch verification on the collector.
3. Generate individual key pair for each meter as
< SKd =vi, P Kd =gvi >whichvi ∈Z∗qis a random number. If a meter is a detectordi, this key pair is also used as the detection keys.
4. Generate the re-encryption key RKagg→di =gvi/a, when the group-based anomaly detection is trig-gered.
In the end, the collector securely transmits the system parameters (q, g,G,Gt, e, Z, P Kagg, SKsig) and individual detection keys to each meter node.
Leaf Node Aggregation. We slightly change the in-network aggregation and data signing process in [22] to make it fit into our scenario. Here we briefly illustrate the process with an example: as shown in Fig. 2, the leaf node Nx performs the following steps to generate its ciphertext and signature for its own readingmx∈Z∗q:
1. MapmxtoMx=Zmx∈GT.
2. Generate the ciphertextCx=Enc(Mx, P Kagg).
3. UseSKsig to make a signatureσxas
σx=Sign(mx, SKsig) = (gmxhx)s,
where hx=H(IDx||T S).H() is the hash function and T S is the current time stamp which can prevent the replay attack.
4. Send the tuple< Cx, Cox, σox >to the parent meter
Nz, whereCoxandσoxare the aggregation data and signature which are output by Nx, respectively. Here, as Nx is the leaf node, we have Cox = 1 andσox=σx. In our scheme, each meter needs to send its data to its parent which is responsible for aggregation. Since the data Cx is collected in the aggregation process and stored at the parent node, it faithfully demonstrates the authenticity ofCx, which is precisely the data injected into the aggregation.
Intermediate Node Aggregation. For an intermediate node, say Nz in Fig. 2, has two inputs, e.g., the two to-be-aggregated ciphertexts Cx and Cy as well as the corresponding signatures. First, Nz generates its own ciphertext and signature as a leaf node. Then, it computes the aggregation data and signature as
Coz=Cx·Cox·Cy·Coy
σoz=σz·σox·σoy,
and outputs the tuple < Cz, Coz, σoz >to nodeNi. Note that, for anomaly detection purpose, each intermediate node needs to store its children’s individual data for a pre-defined period. In the example,NzstoresCxandCy for its childNxandNy.
Final Result Reading and Verification. So on so forth, when the collector receives the tuple< Cw, Cow, σow>fromNw and the ones from Nd and Nh, it aggregates them to obtain the final result C and σ, and then checks the integrity as the following steps:
1. Recover the plaintextM =Dec(C, SKagg).
2. Reversely mapMback tom.
3. Generate the hash value for each participant node as
hi =H(IDi||T S)
4. Check the integrity using batch verification as
e(σ , g)=? e(gm·h1·h2· · ·ht, P Ksig)
The correctness of batch verification.
e(σ , g) =e(σ1·σ2· · ·σt, g) =e((gm1h
1)s(gm2h2)s· · ·(gmtht)s, g)
=e(g(m1+m2+···+mt)h
1h2· · ·ht, gs) =e(gmh1h2· · ·ht, P Ksig)
If the batch verification succeeds, the collector will report the final result to the control center. However, if the aggregated result significantly deviates from the normal range, it indicates some falsified data has been injected in the last aggregation round. Thus, it will follow the incremental verification scheme [22] to identify logical groups with invalid outputs.
5.3. Group-based anomaly detection
from each group member. The anomaly detection is
pairwise: it involves the root of the group, serving as the
verifierwhich stores the historical data, and a randomly selected neighbor node with light-weight kernel density estimator installed, serving as thedetectorwhich detects the outlier.
Data collected at the verifier. According to the revised data aggregation scheme, individual metering data of each member node is transmitted to the group verifier, and stored in a fixed-size queue. It creates a random sample set R for the values collected in the recent period of time where the size of R is represented as |R|=t, and will be used as historical data in anomaly detection. Accordingly, the size of the verifier’s dataset
T ist∗gsize, wheregsizeis the group size.
At each aggregation round, it is assumed to update the oldest historical data with the latest value. However, as the metering data is collected at a high frequency, it may not be necessary to update the data frequently. Moreover, per-round update will cause undesired communication overhead that we want to avoid by in-network aggregation. Therefore, we propose a slow update scheme that allows only one member node to submit an update per aggregation round. Hence, only one node is affected per round, whose communication overhead caused by anomaly detection is only doubled (i.e., two output readings at each node) comparing to the original aggregation scheme. In particular, at roundn, every node computes (n modgsize). Only the node whose intra-group ID matches (n modgsize) is allowed to send the update in terms ofCi in the output tuple.
Data Re-encryption. To identify the abnormal data, we need to compare the current reading to the historical data distribution. However, all records are encrypted under the aggregation key. It is absolutely insecure for the collector to share the secret aggregation keyawith the verifier, not only because this will allow the verifier to view all the historical readings of its group members, but more importantly, the verifier can abuse this secret to recover all future encrypted data in the aggregation. Key refreshing may also not be a good solution, as apart from the high cost of key refreshment, it will lead to inconsistency in the encryption form of the historical data (i.e., part of the data is encrypted by P Kagg and part of them is encrypted byP Kaggnew), and further causes difficulty to key management.
Therefore, we propose a data re-encryption scheme: the verifier (with the help of the collector) randomly selects a neighbor node, say Nd, as its detector, and obtains the re-encryption key RKagg→di =gvd/a from the collector. It then performs the aforementioned re-encryption operation over the recent data stream (e.g., data stream ofNp is{Cpt, Cpt−1, ..., Cp1}), and sends the re-encrypted stream to the detector, which can recover
Mp ={mpt, ...mp1}with its private detection keyvd. The
security of individual metering data is guaranteed: for the verifier that stores the data, it will never be chosen as detector and thus it cannot obtain a re-encryption key for itself; for the detector, although it can recover the individual metering data in the lasttrounds, but it doesn’t know to whom the data belongs. Therefore, we believe the security and privacy is well maintained in the re-encryption approach.
Group-based anomaly detection. We consider the meter-ing data in smart grid aggregation as a temporal stream-ing data without spatial correlation. That is, data dis-tribution changes only over time. This assumption is rational because electricity usage is household-sensitive and the similarity in neighboring meters is trivial. We further assume the time when anomaly occurs is unpredictable, that is, we don’t have priori knowledge about data distribution at a given time. Therefore, we need an anomaly detection scheme that can efficiently model distribution for streaming data and effectively approximate an unknown data distribution. It should also be light-weight, which is computationally efficient and requires very small memory.
In this work, we adopt the outlier detection model used in wireless sensor networks [32] and modify it to fit in our scenario. This model uses a distance-based anomaly definition: “a pointpin a datasetT is a(D, r) -anomaly if less thenDpoints inT lie within distancerfrom p.” It approximates the data distribution in dataset T
based on thekernel density estimator, and then computes the density of the data space around the value which needs to be detected. If the number of neighboring data points is less thanD, the distance-based outlier is identified. We briefly introduce the method as follows:
The detector first maps the sample set R=Mp=
mp1,· · ·, mpt
into the interval [0,1]. This requirement can be satisfied easily through normalization. Letkp(x)
be the kernel function for Np, where R01kp(x)dx= 1 for all values inMp. The underlying distributionfp(x) for T can be approximated by the following function according to the values in the sample setMp:
fp(x) =1
t
X
mpj∈Mp
kx−mp j
.
Let us select the Epanechnikov kernel that is easy to integrate as the kernel function, then we have
k(x) =
3 41B
1−x
B 2
, x B <1
0 , otherwise
whereBis the bandwidth of the kernel function. With a similar setting as in [32], we set B as
√ 5σ
Mp
−1 5,
With the distribution functionfp(x) forNp, the detector estimates the number of values that are within the distancerfrommpas
Nmp, r
=|W| Zr
0
fp(x)dx
where|W|is the size of the dataset. In our work, since we aim to identify an outlier in a data stream, the dataset is a sliding window consisting of a number of meter readings within a period. If this number is less than the thresholdD,mpis identified as an outlier.
6. Security Analysis
In this section, we analyze the security of the proposed scheme.
(1)Data of individual meters are aggregated in a privacy-preserving way. In the proposed scheme, each meter encrypts its individual data before reporting it to the parent node. The ciphertext of an individual reading is in the form of (e(g, g)r·m, gra). To obtain the plaintext
m, the adversary needs to find the value of e(g, g)r. However, without knowing the private key a, it is impossible for the adversary to obtain e(g, g)r from the paringe(∗,∗) andgra. This is because the semantic security of the pairing-based ElGamal encryption is equivalent to the infeasibility of the Decisional Bilinear Diffie-Hellman problem (DBDH), which is proven to be very hard to solve.
In the in-network aggregation, an intermediate node receives individual meter readings in the ciphertext form, and performs homomorphic additive aggregation directly over the encrypted data. It can never access the plaintext data of its child nodes. Given two ciphertext messages (e(g, g)r1·m1, gr1a) and (e(g, g)r2·m2, gr2a), the
aggregated result is in the form of (e(g, g)r1+r2·m1·
m2, g(r1+r2)·a), so that the semantic security of the
aggregated ciphertext remains.
The security of the data aggregation depends upon the proxy re-encryption scheme [5] which is based on ElGamal. The semantic security of ElGamal with this re-encryption function is maintained under the Decisional Bilinear Diffie-Hellman Inversion Assumption (DBDHI) which has been proven hard in the generic group model by Dodis and Yampolskiy [13]. Finally, the collector is allowed to recover the final aggregated result. However, it is unable to separate any individual data of a single smart meter from the aggregate result. Therefore, even if an adversary successfully compromises an intermediate node or the collector’s database, he cannot harm individual users’ private data.
(2) The data integrity of all participant meters is protected.In the proposed scheme, signature keySKsig is securely distributed in the system initialization phase, so the external attackers cannot generate valid
signature for his forged data. Any external attacks will be detected by the batch verification scheme only through the final aggregate result and signature, which based on [7,8]. The proposed scheme is secure, since the aggregate signature scheme is proven secure in a gap group where Decisional Diffie-Hellman problem (DDH) is easy, but the Computational Diffie-Hellman problem (CDH) is hard, an adversary is incapable of forging an aggregate signature and thus the data integrity is guaranteed.
(3)The data provided to the detector is faithful. To verify the data of one node, say Nx in Fig. 2, the detector needs to analyze the data (Cx) injected to the aggregation result in the current round. Since the individual metering data of each node is stored and aggregated by its parent nodeNz, a meter can not forge a new data for anomaly detection.
(4)The risk of data leakage in anomaly detection is eliminated. In traditional anomaly detection, a same node works as the role of verifier and detector at the same time. Since the anomaly detection only can be done over plaintexts, the node has the capacity of transforming ciphertexts to cleartexts. In this case, other nodes’ privacy data will be revealed to the detector. However, in our solution, the separation of verifier and detector only allows the verifier to transform data, and the detector to perform anomaly detection. To successfully steal users’ data, an attacker has to arrange two compromised nodes as the verifier and the detector, respectively. The proposed eliminate this risk through making the collector randomly select the detector so that the attacker cannot determine in advance which node will become the detector. Besides, as the verifier is also chosen dynamically in grouping phase, it is difficult to launch a colluding attack to steal users’ private data.
7. Performance Evaluation
In this section, we evaluate the performance of our scheme in terms of grouping result, storage overhead, communication overhead and computation overhead.
7.1. Grouping Result
First, we analyze how the value of the grouping function changes along with the two variables hi and ni and discuss how to set the value of the parameters properly. Given the grouping function Fi = (1− 1
e(αθhi+βni))
γ , we vary the value of group height hi and group size ni at different parameter settings. As shown in Fig. 3 ,
0 1 2 3 4 5 hi (- = 0.3, 3 = 3, . = 6)
0.7 0.75 0.8 0.85 0.9 0.95 1
Fi (ni
= 10, h
i
)
, = 0.02
, = 0.04
, = 0.06
, = 0.08
, = 0.10
(a)Fias the function ofhiwith varyingα
0 5 10 15 20
ni(, = 0.06, 3 = 3, . = 6)
0.2 0.4 0.6 0.8 1
Fi (ni , hi
= 3)
- = 0.1 - = 0.2 - = 0.3 - = 0.4 - = 0.5
(b)Fias the function ofniwith varyingβ
0 5 10 15 20
ni (, = 0.06, - = 0.3, 3 = 3) 0
0.2 0.4 0.6 0.8 1
Fi (ni , hi
= 3)
. = 15
. = 20
. = 25
. = 30
. = 35
(c)Fias the function ofniwith varyingγ
Fi
(n
i
, h
i
)
ni h
i
0 20 0.2 0.4
15 5
0.6
4 0.8
10 3
1
2
5 1
0 0
, = 0.06, - = 0.3, 3 = 3, . = 6
(d)Fias the function ofniandhiwith fixedα,β,θandγ
Figure 3. Fi(ni, hi)changes with α,β andγ.
0 10 20 30 40 50 60 70 80 90
Group ID. 0
5 10 15 20 25
Group Size
Group size
Mean of Group Size
|N|= 500, Area = 1000*1000 ft2, Tran-Range = 100ft,
, = 0.06, - = 0.3, . = 6, 3 = 3, T
r = 72%
(a) Group size
0 10 20 30 40 50 60 70 80 90
Group ID. 1
2 3 4 5 6
Group Height
Group Height
Mean of Group Height
|N|= 500, Area = 1000*1000 ft2, Tran-Range = 100ft,
, = 0.06, - = 0.3, . = 6, 3 = 3, Tr = 72%
(b) Group height
Figure 4. Grouping Result
We then test the grouping scheme in a simulation, where 500 meters with 100 feet transmission range are randomly distributed in an area of 1000×1000f t2. We generate the spanning tree, which is rooted at the collec-tor, using Kruskal’s algorithm [20]. In our simulation, we set the parameters as α= 0.06, β = 0.3, γ= 6, θ= 3, Tr= 72%. The dynamic grouping result is shown in Fig.4. From Fig.4(a), we can see that the size of most groups is small, with a mean of 6. Therefore, the verifi-cation load for most groups is small. This also indicates that the roots of most groups only need a small storage for the time-series data of group members. Similarly, as
shown in Fig.4(b), the height of most groups is also very small, which indicates the multi-hop communication overhead is low.
7.2. Computation Overhead
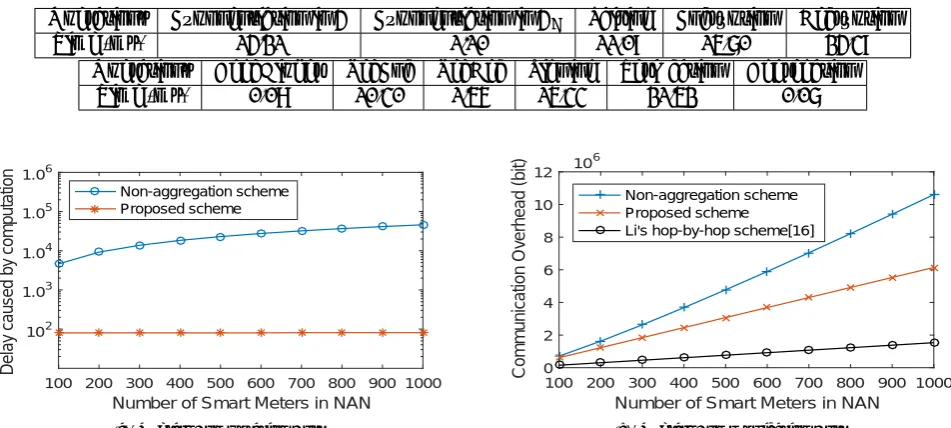
To assess the computational overhead, we conduct the experiment with Java pairing-based cryptography (JPBC) [3] library on a 2.8 GHz processor PC. The implementation chooses a 160-bit order elliptic curve group G based on a supersingular curve y2=x3+x with embedding degree of 2 over a 512-bit finite field. The computation overhead is evaluated in terms of the number of required pairing and exponentiation operations inGandGT. Under the described setting, it costs 14.21 ms to perform an exponentiation operation inG, 1.10 ms for exponentiation operation inGT, and 11.09 ms for the corresponding pairing operation. The average encryption and decryption cost 15.70 ms and 24.39 ms respectively. The measured processing time for each operation is then listed in Table1.
Compared to the non-aggregation scheme, our scheme requires an additional aggregation operation at each intermediate nodes. However, as shown in Table 1, the cost of the aggregation operation is very small. On the contrary, our scheme avoids the expensive operations for decrypting individual meter data and verifying their integrity at the collector. Therefore, our scheme reduces the computational overhead significantly.
To quantify the increased data collection perform in the proposed aggregation scheme, we first define the
end-to-end processing time, which is the delay between the time point when the meters start processing individual data and the time point when the collector completes all the operations and obtains the correct aggregated result in plaintext. It consists of the processing time at nodes (smart meters and the collector), and the communication time. Since we will discuss the communication cost in Section 7.4, here we primarily focus on the delay at intermediate nodes, which can be calculated as:
Delay=Tcollector+Tmeters
Tcollector denotes the time spent by the collector for recovering the expected statistic such as SUM, including signature verification and decryption.Tmeters denotes the time spent by the meters for encryption, signing, and aggregation (only incurred in our scheme) operations.
In particular, at the collector, the cost consists of decryption and signature verification. Our scheme only needs one batch verification and one decryption, so the cost Tcollector is (Tver +Tdec). In contrast, in non-aggregation scheme, since the collector needs to verify and decrypt each individual meter’s report, the cost is P|N|
1 (Tver+Tdec).
For meters, since all the meters can perform encryption and signing simultaneously in the non-aggregation scheme, only one encryption and one signing operation should be included in the overall cost.
Thus, the costTmeters= (Tenc+Tsign). In our scheme, in addition to encryption and signing operations which are conducted by all meter simultaneously, all non-leaf nodes need to perform aggregation over children’s ciphertexts and signatures. Since the aggregation proceeds hop-by-hop along the aggregation tree in a bottom-up manner, the overhead introduced by aggregation is proportional to the height of the spanning tree. For example, in an aggregation tree whose average degree is 3 (e.g., degree=2 represents a binary tree), its height is about log32n and needs 8
aggregations for 3 children in total. Therefore,Tmeters= 8Tagg∗log32n.
As shown in Fig.5(a), we calculate theDelayof our proposed scheme and the one of the non-aggregation approach, with the varying number of meters. We can see that the delay introduced by computation in the traditional non-aggregation scheme increases linearly with the number of smart meters, while the performance of our proposed scheme is much better and negligibly affected by of the network size.
7.3. Storage Overhead
To support distributed group-based anomaly detection, the proposed solution requires the root of each group to store individual data for its members and preprocess the historical data for the detector when necessary. Therefore, we need to evaluate the additional storage overhead that the group-based anomaly detection introduces to the root.
Table 1. Computation Cost
Operations Exponentiation inG Exponentiation inGT Pairing Encryption Decryption
Time (ms) 14.21 1.10 11.09 15.70 24.39
Operations Agg_Cipher Re_Enc Re_Dec Signing Verification Aggregation
Time (ms) 0.08 10.30 1.56 15.33 21.52 0.07
100 200 300 400 500 600 700 800 900 1000 Number of Smart Meters in NAN
102 1.03 1.04 1.05 1.06
Delay caused by computation
Non-aggregation scheme Proposed scheme
(a) Overall Computation Cost
100 200 300 400 500 600 700 800 900 1000 Number of Smart Meters in NAN
0 2 4 6 8 10 12
Communication Overhead (bit)
#106
Non-aggregation scheme Proposed scheme Li's hop-by-hop scheme[16]
(b) Overall Communication Cost
Figure 5. Overall Computation & Communication Overhead
7.4. Communication Overhead
To better analyze the communication overhead, we compare our scheme with Li’s hop-by-hop in-network aggregation scheme [22] and traditional non-aggregation data collection. We consider an aggregation tree of n nodes (including the collector), where the height is h and the average degree of each node is d. We use the number of hops in the aggregation and the messages size as the metric, so the overall communication overhead isC =Hop∗Size. In terms of hops, it is easy to see the communication overhead of hop-by-hop aggregation is
Hhop−by−hop=n−1 =O(n),
while for the no-aggregation approach, the communica-tion overhead is
Hnon−aggregation = h X
i=1 i·di
=hd
(h+2)−(h+ 1)dh+1+d
(d−1)2 =O(n·logn).
The communication in the proposed scheme consists of two parts, communication in data aggregation and communication in anomaly detection. First, we consider the revised aggregation scheme, which causes little extra overhead compared with hop-by-hop aggregation. In the proposed scheme, to ensure the non-repudiation, in addition to the regular aggregation communication
per round, each node transmits its individual data to its parent, which introduces n−1 hops more communication. Besides, to collect historical data, within each group only a member sends its individual reading to the root of the group to update its historical data in each round. Thus, the increase of hops depends on the product (p) of the group number and the average height of each group. From the grouping result, we can see the number of groups is almost16 ofnand the group height is about 3. Thus, this product is less thann, and the communication overhead of the proposed scheme is
Hproposed =n−1 +p <2n.
In this scheme, for a meter node Ni, the message is in the form ofCi||Coi||σoi of size 2560(= 1024 + 1024 + 512) bits in our experiment. Thus, the corresponding communication overhead in data aggregation isCagg = 2560∗Hproposed, which is smaller than 5120n. In the traditional non-aggregation approach and hop-by-hop aggregation approach, each message includes both ciphertext and signature, so the message size is 1536. Thus, the overall communication overhead is 1536nlog nand 1536(n−1), respectively.
Next, we discuss the communication overhead in anomaly detection where the historical data will be transmitted to the detector. If we distribute this overhead to each aggregation round, it indicates a cost of one additional ciphertext from the group root to the detector. Therefore, the overall communication overhead will be
Deviation degree of outlier 0
0.2 0.4 0.6 0.8 1
Recall Precision
[7+<, 7+3<] [7+2<, 7+4<] [7+3<, 7+5<]
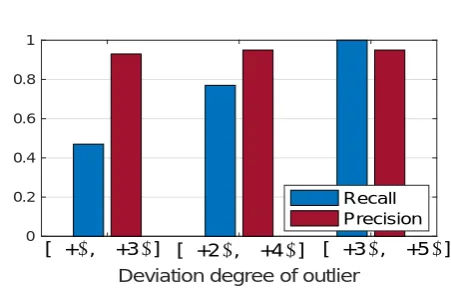
Figure 6. The changes of recall and precision with deviation degree of outlier.
Fig. 5(b) shows that the communication overhead varies with the number of meters. Compared to hop-by-hop aggregation, the proposed scheme has higher communication overhead due to security requirements for ensuring non-repudiation and providing historical data for anomaly detection, but it is still much better than the traditional non-aggregation approach.
7.5. Anomaly Detector Performance
Dataset: In our experiment we used real-life data sets [1] from the Commission for Energy Regulation (CER) who provided the electricity usage data during 2009 and 2010 with over 5,000 Irish homes and busi-nesses participating. All participants had an electricity smart meter installed in their homes/premises, which recorded power consumption every 30 minutes. Typ-ically, most meters contained 25536 data entries that are time sequences in 532 days (48 records per day). All personalized data including meter location informa-tion was removed in order to preserve anonymity. The analysis to the spatial correlation of different meters is impossible, hence a temporal-correlation anomaly detection algorithm is more practical in the real world. In our experiment we considered all records as valid and untampered data and normalized them to fit in the [0,1] interval. We used synthetic data as outliers for each meter which were generated based on the meter’s records and randomly sampled the real values from the original dataset as tested normal values.
Metrics: We used two typical measures as metrics, namelyprecisionandrecall. In our scenario, precision represents the ratio of the number of correctly detected outliers by our algorithm to the number of picked-up items by our algorithm. Recall represents the ratio of the number of correctly detected outliers by our algorithm to the total number of outliers in the data set.
Accuracy: We randomly selected 10 meters from all 5,000 meters, recorded the averages over 20 runs of the
experiment for each meter, and finally, got the average precision and recall of the 10 meters for our evaluation. Each time, we synthesized 100 outliers and randomly sampled 100 real values as normal values from the original dataset. In our experiments, we changed the deviation degree of outliers, that is, how different the outliers are from the normal values. For example, the range of outliers was set as [µ+ 2σ , µ+ 4σ] and [µ+ 3σ , µ+ 5σ], where µ and σ stand for mean and standard deviation of all data entries of a meter, respectively.
We picked up (40, 0.01)-outliers, namely, a value is identified as an outlier if the number of its neighbors within distance of 0.01 is less than 40. Fig.6depicts the changes of precision and recall with deviation degree of outlier. The precision is very stable regardless of how much the outliers deviate from the normal values, indicating there is only very few false positives in our detection scheme. This may because the proposed scheme fit the underlying distribution of readings very well. Another reason of high precision is that, since there exist few extreme values in the original dataset, we have a small chance to pick them into the sample set by randomly sampling normal values from the original dataset.
For recall, when the values of outliers are close to the normal values, the detector achieves a very low recall (around 51%), which means that many low-suspicious outliers are omitted. This is because those low-suspicious outliers are very similar to the normal meter readings with large values in the historical dataset. In contrast, when the outliers remarkably deviate from the normal values, the recall approaches to 100%.
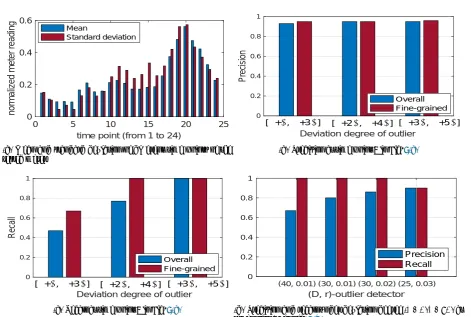
Therefore, to improve the detector performance under the circumstance of a low deviation degree, we consider to use the data at the same time point as the sample. We found that the metering readings at the same time of a day, say 12:00 p.m., are more closer to each other than to the data at a different time point, say 7:00 a.m. So, we randomly picked a meter from the set of 5,000 meters to study, and calculated the mean and standard deviation of its hourly readings (24 hours starting from 1 a.m.) over 532 days.
As shown in Fig 7(a), we can see that the power consumption at different time is very different due to human activities and energy consumption habits. Therefore, anomaly detection using data at the same time may yield better results. For example, when the anomaly detection module is triggered at 12:00 p.m., it is more reasonable for the detector to compare the suspicious value to the data of 12:00 p.m., instead of the entire data. Here, we refer to the previous detection scheme as theoverall detectorand the new scheme as the
0 5 10 15 20 25 time point (from 1 to 24)
0 0.2 0.4 0.6
normalized meter reading
Mean
Standard deviation
(a) Mean and standard deviation of different time points of the tested meter
Deviation degree of outlier
0 0.2 0.4 0.6 0.8 1
Precision
Overall Fine-grained
[7+<, 7+3<] [7+2<, 7+4<] [7+3<, 7+5<]
(b) Precision at time point 5 in Fig.7(a)
Deviation degree of outlier
0 0.2 0.4 0.6 0.8 1
Recall
Overall Fine-grained
[7+<, 7+3<] [7+2<, 7+4<] [7+3<, 7+5<]
(c) Recall at time point 5 in Fig.7(a)
(40, 0.01) (30, 0.01) (30, 0.02) (25, 0.03)
(D, r)-outlier detector
0 0.2 0.4 0.6 0.8 1
Precision Recall
(d) Precision and recall under deviation degree (µ+σ , µ+ 3σ) at time point 20 in Fig.7(a)
Figure 7. The comparison of overall detector and fine-grained detector for a specific meter. Fig7(b)and7(c)compares the performance of (40, 0.01)-outlier detector under different deviation degrees of outliers, where mean and standard deviation are set to the values at time point 5 in Fig 7(a). Fig 7(d) compares performance of different (D, r)-outlier detector under the fixed deviation degree [µ+σ , µ+ 3σ]at time point 20 in Fig7(a).
and then combined 24 outlier sets for 24 hours as the outlier set for the overall detector.
Fig 7 compares precision and recall of the two schemes under different deviation degrees. In Fig7(a), we can see that this randomly selected meter has the least standard deviation at time point 5 (i.e., 5 a.m.), and the largest s.d. at time point 20. Since we want to study how the intrinsic properties of the data affect the detection accuracy, we measure the performance of the (40, 0.01)-detector using data at time point 5 (as shown in Fig7(b)and7(c)) and data at time point 20 (as shown in Fig7(d)).
When the data has a narrow distribution, i.e., with a small standard deviation such as at time point 5, we can see that both schemes achieve a similar high precision. In terms of recall, the fine-grained detector outperforms the overall detector, as expected. Even when the deviation degree of outliers is very small, the fine-grained detector still achieves a higher recall.
Next, we study the data whose values are less consistent, i.e., with a large standard deviation, such as at time point 20. We measure the performance of the
detector with a small deviation degree of outlier ([µ+
σ , µ+ 3σ]) and show its precision and recall in Fig7(d). We can see that the detector achieves a very high recall, but a small precision. To balance the precision and recall, we can adjust the detector setting. When we use a (25, 0.03)-detector, both recall and precision are around 90%. Overall, the fine-grained detector is more stable and provides high precision and recall.
Discussion:The goal of a detector performed by a smart meter is to identify an outlier in a data stream, which is a series of meter readings drawn from an unknown distribution. Since power consumption varies over time and smart meter is a resource-constrained device, the detection algorithm should be light-weight and can adapt to the changes of the data. Distance-based outlier detection, which relies on a light-weight kernel density estimator, is proved to be an efficient scheme to identify an outlier fast and at low cost [32]. Therefore, it is a good option for anomaly detection in the smart grid applications.
be specified accurately. In our experiments, we used a universal setting for detector at different smart meters, since we found that the data points of the tested meters show similar densities over time. Therefore, the simple distance-based outlier detection scheme can achieve a good performance in our experiments. In reality, due to different power consumption patterns in different households, a universal threshold for all meters may not exist. Consider the huge number of individual meters, it is challenging to determine the settings for all meters. In our future work, we will examine other efficient detection approaches that do not require subtle parameter setting, such as local metrics based outlier detection using multi granularity deviation factor [31].
8. Conclusion
Existing prevention-based secure in-network data aggregation mechanism for smart grid systems cannot effectively detect accidental errors and falsified data injection by malfunctioning or compromised meters. In this paper, we first introduce a light-weight anomaly detector based on kernel density estimator to localize false data injected into the aggregation. To reduce the overhead at the collector, we design a dynamic grouping scheme to divide meters into multiple connected groups and distribute the verification and detection load among the root of the groups. A novel data re-encryption scheme based on bilinear mapping is further proposed to transform the data previously encrypted under the aggregation key into a form that can be computed by the detector to ensure the security and privacy of individual metering data, which are critical for anomaly detection. Performance of the anomaly detector is evaluated in terms of the memory usage and communication overhead, and proved to be light-weight for the current smart meter configuration.
References
[1] CER Smart Metering Dataset. http://www.ucd.ie/ issda/data/commissionforenergyregulationcer/. [2] Communications module for electricity meters.
http://www.silverspringnet.com/pdfs/SilverSpring-Datasheet-Communications-Modules.pdf.
[3] JPBC library. http://gas.dia.unisa.it/projects/ jpbc/.
[4] Alseiari, F. A. A., and Aung, Z. Real-time
anomaly-based distributed intrusion detection systems for advanced metering infrastructure utilizing stream data mining. In2015 International Conference on Smart Grid and Clean Energy Technologies (ICSGCE) (2015), IEEE, pp. 148–153.
[5] Ateniese, G., Fu, K., Green, M., and Hohenberger, S. Improved proxy re-encryption schemes with
applications to secure distributed storage. ACM Trans. Inf. Syst. Secur. 9, 1 (Feb. 2006).
[6] Bera, S., Misra, S., and Rodrigues, J. J.Cloud computing
applications for smart grid: A survey. IEEE Transactions
on Parallel and Distributed Systems 26, 5 (2015), 1477– 1494.
[7] Boneh, D., Gentry, C., Lynn, B., and Shacham, H.
Aggregate and verifiably encrypted signatures from bilinear maps. InEUROCRYPT’03.
[8] Boneh, D., Lynn, B., and Shacham, H. Short signatures
from the weil pairing. InASIACRYPT ’01.
[9] Budka, K., Deshpande, J., Hobby, J., Kim, Y.-J., Kolesnikov, V., Lee, W., Reddington, T., Thottan, M.,
White, C., Choi, J.-I., Hong, J., Kim, J., Ko, W., Nam,
Y.-W., and Sohn, S.-Y. Geri - bell labs smart grid research
focus: Economic modeling, networking, and security and privacy. In IEEE SmartGridComm 2010 (oct. 2010), pp. 208 –213.
[10] Chan, H., Perrig, A., and Song, D. Secure hierarchical
in-network aggregation in sensor networks. InACM CCS ’06.
[11] Cruz, T., Rosa, L., Proenca, J., Maglaras, L., Aubigny, M., Lev, L., Jiang, J., and Simoes, P. A cyber security
detection framework for supervisory control and data acquisition systems. IEEE Transactions on Industrial Informatics PP, 99 (2016), 1–1.
[12] Deng, P., and Yang, L. A secure and privacy-preserving
communication scheme for advanced metering infras-tructure. Innovative Smart Grid Technologies, IEEE PES 0(2012), 1–5.
[13] Dodis, Y., and Yampolskiy, A. A verifiable random
function with short proofs and keys. In Public Key Cryptography-PKC 2005. Springer, 2005, pp. 416–431. [14] Fouda, M., Fadlullah, Z., Kato, N., Lu, R., and Shen, X.
A lightweight message authentication scheme for smart grid communications. Smart Grid, IEEE Transactions on 2, 4 (2011), 675–685.
[15] Frikken, K. B., and Dougherty, IV, J. A. An
efficient integrity-preserving scheme for hierarchical sensor aggregation. InWiSec ’08.
[16] Garcia, F. D., and Jacobs, B. Privacy-friendly
energy-metering via homomorphic encryption. InProceedings of the 6th international conference on Security and trust management(2011), STM’10, pp. 226–238.
[17] Kantarci, B., and Mouftah, H. T. Trustworthy sensing
for public safety in cloud-centric internet of things.IEEE Internet of Things Journal 1, 4 (2014), 360–368.
[18] Khurana, H., Hadley, M., Lu, N., and Frincke, D.
Smart-grid security issues. Security & Privacy, IEEE 8, 1 (2010), 81 –85.
[19] Krishnamachari, B., Estrin, D., and Wicker, S. B. The
impact of data aggregation in wireless sensor networks. InICDCSW ’02.
[20] Kruskal, J. B. On the shortest spanning subtree of a
graph and the traveling salesman problem. Proceedings of the American Mathematical society 7, 1 (1956), 48–50. [21] Li, D., Aung, Z., Williams, J. R., and Sanchez, A.
Efficient authentication scheme for data aggregation in smart grid with fault tolerance and fault diagnosis. In Innovative Smart Grid Technologies, 2012 IEEE PES. [22] Li, F., and Luo, B. Preserving data integrity
[23] Li, F., Luo, B., and Liu, P.Secure information aggregation
for smart grids using homomorphic encryption. In SmartGridComm, 2010 First IEEE International Confer-ence on(oct. 2010), pp. 327 –332.
[24] Li, F., Luo, B., and Liu, P.Secure and privacy-preserving
information aggregation for smart grids. Int. J. Secur. Netw. 6, 1 (Apr. 2011), 28–39.
[25] Li, X., Liang, X., Lu, R., Shen, X., Lin, X., and Zhu, H.Securing smart grid: cyber attacks, countermeasures,
and challenges. Communications Magazine, IEEE 50, 8 (2012), 38–45.
[26] Madden, S., Franklin, M. J., Hellerstein, J. M., and Hong, W. Tag: a tiny aggregation service for ad-hoc
sensor networks. SIGOPS Oper. Syst. Rev. 36, SI (2002), 131–146.
[27] McCary, E., and Xiao, Y. Smart grid attacks and
countermeasures.EAI Endorsed Transactions on Industrial Networks and Intelligent Systems 15, 2 (2 2015).
[28] McDaniel, P., and McLaughlin, S.Security and privacy
challenges in the smart grid. Security & Privacy, IEEE 7, 3 (2009).
[29] Menon, D. M., and Radhika, N. Anomaly detection in
smart grid traffic data for home area network. In2016 International Conference on Circuit, Power and Computing Technologies (ICCPCT)(2016), IEEE, pp. 1–4.
[30] Paillier, P.Public-key cryptosystem based on composite
degree residuosity classes. InProceedings of Eurocrypt ’99 (1999), pp. 223–238.
[31] Papadimitriou, S., Kitagawa, H., Gibbons, P. B., and Faloutsos, C. Loci: Fast outlier detection using the
local correlation integral. In Data Engineering, 2003. Proceedings. 19th International Conference on (2003), IEEE, pp. 315–326.
[32] Subramaniam, S., Palpanas, T., Papadopoulos, D., Kalogeraki, V., and Gunopulos, D. Online outlier
detection in sensor data using non-parametric models. InVLDB.
[33] Wood, G., and Newborough, M. Dynamic
energy-consumption indicators for domestic appliances: envi-ronment, behaviour and design.Energy and Buildings 35, 8 (2003), 821 – 841.
[34] Yan, Y., Qian, Y., and Sharif, H. A secure and reliable
in-network collaborative communication scheme for advanced metering infrastructure in smart grid. In Wireless Communications and Networking Conference (WCNC), 2011 IEEE(2011), pp. 909 – 914.
[35] Yang, L., Humayed, A., and Li, F. A multi-cloud
based privacy-preserving data publishing scheme for the internet of things. In Proceedings of the 32nd Annual Computer Security Applications Conference(2016), ACM. [36] Ye, F., Qian, Y., and Hu, R. Q. A security protocol
for advanced metering infrastructure in smart grid. In 2014 IEEE Global Communications Conference(Dec 2014), pp. 649–654.
[37] Ye, F., Qian, Y., and Hu, R. Q. Hibass: hierarchical