Gummadi Sridhar Babu et al. J Sci Res Pharm, 2017;6(9):95-99
World Inventia Publishers
J
ournal of
S
cientific
R
esearch in
P
harmacy
http://www.jsrponline.com/
Vol. 6, Issue 9, 2017 ISSN: 2277-9469
USA CODEN: JSRPCJResearch Article
ANALYTICAL METHOD DEVELOPMENT AND VALIDATION OF LOPINAVIR BY RP HPLC METHOD
Gummadi Sridhar Babu 1*, PS. Malathi 2
* 1 Professor, Department of Pharmaceutical analysis, Sri Shivani College of Pharmacy,Warangal, Telangana, INDIA. 2Associate Professor,Department of Pharmacology, Sri Shivani College of Pharmacy,Warangal, Telangana, INDIA.
Received on: 23-08-2017; Revised and Accepted on: 11-09-2017
ABSTRACT
A
new method was established for estimation of lopinavir by RP-HPLC method. The chromatographic conditions were successfully developed for the separation of lopinavir by using Kromosil C184.5×150 mm 5.0 µm, flow rate was 0.8ml/min, and mobile phase ratio was 65:35% v/v methanol:water, detection wavelength was 265nm. The instrument used was Waters HPLC Auto Sampler, Separation module 2695, photo diode array detector 996, Empower-software version-2. The retention times were found to be 2.482 mins. The % purity of lopinavir was found to be 99.87%.The system suitability parameters for lopinavir such as theoretical plates and tailing factor were found to be4146, 1.23, the. The analytical method was validated according to ICH guidelines (ICH, Q2 (R1)). The linearity study of lopinavirwas found in concentration range of 30µg-150µgand correlation coefficient (r2) was found to be 0.997, % recovery was found to be 100.4%, %RSD for repeatability was 0.5, % RSD for intermediate precision was 1.0. The precision
study was precision, robustness and repeatabilty.LOD value was 2.97 and LOQ value was 9.92.Hence the suggested RP-HPLC method can be used for routine analysis of lopinavir in API and Pharmaceutical dosage form.
KEYWORDS: Kromosil C18, Lopinavir, RP-HPLC.
INTRODUCTION
T
he chromatography was discovered by Russian Chemist and botanist Micheal Tswett (1872-1919) who first used the term chromatography (colour writing derived from Greek for colour – Chroma, and write – graphein) to describe his work on the separation of coloured plant pigments into bands on a column of chalk and other material such as polysaccharides, sucrose and insulin.“Chromatography is a method in which the components of a mixture are separated on an adsorbent column in a flowing system".
The adsorbent material, or stationary phase, first described by Russian scientist named Tswett in 1906, has taken many forms over the years, including paper, thin layers of solids attached to glass plates, immobilized liquids, gels, and solid particles packed in columns. The flowing component of the system, or mobile phase, is either a liquid or a gas. Concurrent with development of the different adsorbent materials has been the development of methods more specific to particular classes of analytes. In general, however, the trend in development of chromatography has been toward faster, more efficient.
“In his early papers of Tswett (1906) stated that chromatography is a method in which the component of a mixture are separated on an adsorbent column in a flowing system. Chromatography has progressed considerably from Tswett’s time and now includes a number of variations on the basic separation process”.
“Chromatography is a physical method of separation in which the component to be separated are distributed between two phases of which in stationary while other moves in a definite direction (IUPAC)”.
*Corresponding author:
Gummadi Sridhar BabuProfessor,
Department of Pharmaceutical analysis, Pragathi Pharmacy College, Janagaon, Telangana, INDIA.
* E-Mail: [email protected]
Chromatographic Process:
Chromatographic separations are based on a forced transport of the liquid (mobile phase) carrying the analyte mixture through the porous media and the differences in the interactions at analytes with the surface of this porous media resulting in different migration times for a mixture components. In the above definition the presence of two different phases is stated and consequently there is an interface between them. One of these phases provides the analyte transport and is usually referred to as the mobile phase, and the other phase is immobile and is typically referred to as the stationary phase. A mixture of components, usually called analytes, are dispersed in the mobile phase at the molecular level allowing for their uniform transport and interactions with the mobile and stationary phases. High surface area of the interface between mobile and stationary phases is essential for space discrimination of different components in the mixture. Analyte molecules undergo multiple phase transitions between mobile phase and adsorbent surface. Average residence time of the molecule on the stationary phase surface is dependent on the interaction energy. For different molecules with very small interaction energy difference the presence of significant surface is critical since the higher the number of phase transitions that analyte molecules undergo while moving through the chromatographic column, the higher the difference in their retention. The nature of the stationary and the mobile phases, together with the mode of the transport through the column, is the basis for the classification of chromatographic methods.
Types of Chromatography:
High Performance Liquid Chromatography (HPLC):
The acronym HPLC, coined by the Late Prof. Csaba Horvath for his 1970 Pittconpaper, originally indicated the fact that high pressure was used to generate the flow required for liquid chromatography in packed columns. In the beginning, pumps only had a pressure capability of 500 psi [35 bars]. This was called high pressure liquid chromatography, or HPLC. The early 1970s saw a tremendous leap in technology. These new HPLC instruments could develop up to 6,000 psi [400 bars] of pressure, and incorporated improved injectors, detectors, and columns. With continued advances in performance during this time [smaller particles, even higher pressure], the acronym HPLC remained the same, but the name was changed to high performance liquid chromatography.
High Performance Liquid Chromatography is now one of the most powerful tools in analytical chemistry. It has the ability to separate, identify, and quantitative the compounds that are present in any sample that can be dissolved in a liquid. Today, compounds in trace concentrations as low as parts per trillion (ppt) may easily be identified. HPLC can be, and has been, applied to just about any sample, such as pharmaceuticals, food, nutraceuticals, cosmetics, environmental matrices, forensic samples, and industrial chemicals.
MATERIALS AND METHODS
Materials:
Ortho phosphoric acid, Acetonitrile for HPLC, Lopinavir, KH2PO4,K2HPO4,Water and Methanol for HPLC.
Methodology:
HPLC Method Development:
The chromatographic method development for the estimation of lopinavir was optimized by several trials for various parameters as different column, flow rate and mobile phase; finally the following chromatographic method was selected for the separation and quantification of lopinavir in API and pharmaceutical dosage form by RP-HPLC method.
Method Validation:
Specificity:
The system suitability for specificity was carried out to determine whether there is any interference of any impurities in retention time of analytical peak. The specificity was performed by injecting blank
Linearity:
10 mg of Lopinavir working standard was accurately weighed and were transferred into a 10ml clean dry volumetric flask, add about 7 ml of diluent and sonicate to dissolve it completely and make volume up to the mark with the same solvent.
Accuracy:
10 mg of Lopinavir standard was accurately weighed and transferred into a 10ml clean dry volumetric flask add about 7ml of
diluent and sonicate to dissolve it completely and make volume up to the mark with the same solvent (Stock solution). Further pipette out 0.9 ml of the above stock solution into a 10ml volumetric flask and was diluted up to the mark with diluent.
Precision:
Repeatability: 10 mg Lopinavir working standard was accurately
weighed and transferred into a 10ml clean dry volumetric flask add about 7 ml of diluent and sonicate to dissolve it completely and make volume up to the mark with the same solvent. Further pipette out 0.9 ml of the above stock solution into a 10ml volumetric flask and was diluted up to the mark with diluent
Intermediate Precision / Ruggedness:To evaluate the intermediate
precision (also known as ruggedness) of the method, precision was performed on different days by using different make column of same dimensions.
Limit of Detection:
LOD’s can be calculated based on the standard deviation of the response (SD) and the slope of the calibration curve (S) at levels approximating the LOD according to the formula. The standard deviation of the response can be determined based on the standard deviation of y-intercepts of regression lines.
Limit of Quantification:
LOQ’s can be calculated based on the standard deviation of the response (SD) and the slope of the calibration curve (S) according to the formula. Again, the standard deviation of the response can be determined based on the standard deviation of y-intercepts of regression lines.
Robustness:
As part of the robustness, deliberate change in the flow rate, mobile phase composition was made to evaluate the impact on the method.
a)The flow rate was varied at 0.8 ml/min to 1.2 ml/min. Standard solution 90 ppm of Lopinavir prepared and analysed using the varied flow rates along with method flow rate.
b)The organic composition in the mobile phase was varied from 75% to 55% standard solution 90 µg/ml of Lopinavir was prepared and analysed using the varied mobile phase composition along with the actual mobile phase composition in the method.
System Suitability:
10 mg of Lopinavir standard was accurately weighed and transferred into a 10ml clean dry volumetric flask and add about 7 ml of diluent and sonicate to dissolve it completely and make volume up to the mark with the same solvent (Stock solution).Further pipette out 0.9 ml Lopinavir the above stock solution into a 10ml volumetric flask and was diluted up to the mark with diluent.
RESULTS
Table No. 1: Optimizedchromatographic conditions for estimations of lopinavir by RP-HPLC method
Instrument used Waters HPLC with auto sampler and PDA ordetector
Column Thermosil C184.5×150 mm 5.0 µm
Column temperature Ambient
pH 3.0
Wavelength 265 nm
Mobile phase ratio 65:35% v/v methanol: water
Flow rate 0.8 min/ml
Auto sampler temperature Ambient
Injection volume 20µl
Fig. 1: Optimized Chromatogram of Lopinavir
Observation: The retention of peak was good, resolution was good, tailing factor was less than 2, theoretical plates were more than 2000, and this trial was taken as optimized method.
Validation Parameters:
Linearity:
Table No. 2: Showing the results for the linearity
Name RT Area
Lopinavir
2.428 1608152 2.422 2592905 2.430 3778327 2.426 5170038 2.433 6249400
Co efficient of correlation (R2) 0.997
Accuracy:
Table No. 3: Showing results for Accuracy 50%
S. No. Peak Name RT Area
1
Lopinavir 2.431 1046104
2 2.429 1049450
3 2.430 1049306
Mean 1048287
Std. Dev. 1891.6
% RSD 0.18
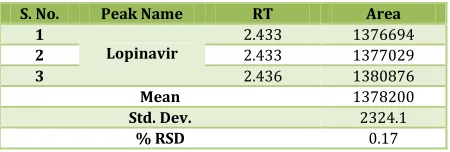
Table No. 4: Showing results for Accuracy 100%
S. No. Peak Name RT Area
1
Lopinavir
2.433 1376694
2 2.433 1377029
3 2.436 1380876
Mean 1378200
Std. Dev. 2324.1
% RSD 0.17
Table No. 5: Showing results for Accuracy 150%
S. No. Peak Name RT Area
1
Lopinavir 2.439 1714604
2 2.439 1714196
3 2.441 1717641
Mean 1715480
Std. Dev. 1882.1
Table No. 6: Showing Accuracy results for Lopinavir
% Concentration
(at specification level) Average Area Amount added (mg) Amount found (mg) % Recovery recovery Mean 50% 1048287 5 5.14 100.2%
100.4%
100% 1378200 10 10.01 98.8%
150% 1715480 15 15.2 96.5%
Precision:
Table No. 7: Showing the results for precision
S. No. Peak Name RT Area
1
Lopinavir
2.423 693078
2 2.424 693338
3 2.424 695080
4 2.424 694843
5 2.423 695336
Mean 694335
Std. Dev. 1047.5
% RSD 0.15
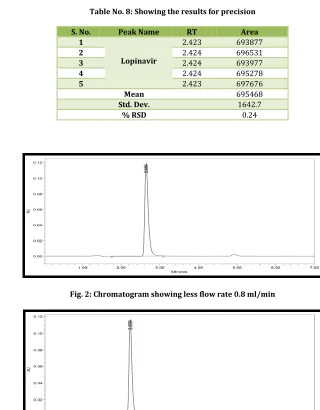
Ruggedness (Intermediate Precision):
Table No. 8: Showing the results for precision
S. No. Peak Name RT Area
1
Lopinavir
2.423 693877
2 2.424 696531
3 2.424 693977
4 2.424 695278
5 2.423 697676
Mean 695468
Std. Dev. 1642.7
% RSD 0.24
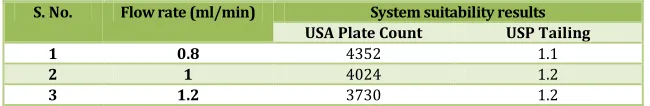
Variation in Flow:
Table No. 9: Showing system suitability results for Lopinavir
S. No. Flow rate (ml/min) System suitability results USA Plate Count USP Tailing 1 0.8 4352 1.1
2 1 4024 1.2
3 1.2 3730 1.2
Table No. 10: Showing system suitability results for Lopinavir
S. No. Change in organic composition in
the mobile phase USA Plate Count System suitability results USP Tailing
1 10% less 4331 1.2
2 * Actual 4024 0.87
3 10% more 3693 1.26
SUMMARY AND CONCLUSION
A
new method was established for estimation of lopinavir by RP-HPLC method. The chromatographic conditions were successfully developed for the separation of lopinavir by using Kromosil C18 4.5×150mm 5.0 µm, flow rate was 0.8ml/min, and mobile phase ratio was 65:35% v/v methanol: water, detection wavelength was 265nm. The instrument used was Waters HPLC Auto Sampler, Separation module 2695, photo diode array detector 996, Empower-software version-2. The retention times were found to be 2.482 mins. The % purity of lopinavir was found to be 99.87%.The system suitability parameters for lopinavir such as theoretical plates and tailing factor were found to be4146, 1.23, the. The analytical method was validated according to ICH guidelines (ICH, Q2 (R1)). The linearity study of lopinavir was found in concentration range of 30µg-150µgand correlation coefficient (r2) was
found to be 0.997, % recovery was found to be 100.4%, %RSD for repeatability was 0.5, %RSD for intermediate precision was 1.0. The precision study was precision, robustness and repeatabilty. LOD value was 2.97 and LOQ value was 9.92. Hence the suggested RP-HPLC method can be used for routine analysis of lopinavir in API and Pharmaceutical dosage form.
REFERENCES:
1. Beckett A.H and Stenlake JB. Text book of pharmaceutical chemistry 4th Edn, part 2 CBS publishers and Distriburots, New Delhi, 1998;278,307.
2. Douglas Skoog A, James Hollar F. and Timothy Nieman A. Principles of Instrumental Analysis. 5th ed., Thomson Learning
Inc. Singapore, 1998;110,300.
3. Sethi PD. Quantitative Analysis of Drugs in Pharamceutical Formulation, 3rd ed., CBS Publishers and Distributors, 1997
;1-29,50-64.
4. Mendham RC, Denny JD, Barnis M. and Thomas JK. Vogel”s Text Book of Quantitative Chemical Analysis, 6th ed., Pearson
Education, 2003;1,676.
5. Sharma BK. Instrumental method of Chemical Analysis, 24th ed.,
GOEL Publishing House, Meerut, 2005;46,68.
6. Chatwal GR. and Anand KS. Instrumental methods of chemical analysis, 5th Edn, Himalaya Publishing House, Mumbai, 2002
;2-149.
7. Munson JW. Modern Methods of Pharmaceutical Analysis, Medical book distributors, Mumbai, 2001;17-54.
8. Willard HH, Merritt LL, Dean JA and settle FA. Instrumental Methods of analysis, 7th Edn, CBS Publishers and Distributors,
New Delhi, 1988;436-439.
9. Synder KL, Kriklad JJ and Glajch JL. Practical HPLC Method Development, 2nd Edn, Wiley-Interscience Publication, USA,
1983;1-10.
10. Bently and Drivers. Text book of pharmaceutical chemistry, 8th
Edn, O’Brein, Oxford university press, 1985;1-3.
11. International conference on harmonization: “Validation of analytical procedures Methodology”, 14, Federal Register,
1996;1-8.
12. Indian pharmacopeia, 2007;1:715. 13. British pharmacopeia, 2007;1:136.
14. Madhukar A et al. Simple and Sensitive Analytical Method Development and Validation of Lopinavir Bulk drug by RP-HPLC. Der Pharma Chemica 2011;3(6):494-499.
15. Ponnilavarasan et al. RP-HPLC Method for Simultaneous Estimation of Antiretroviral drugs Lopinavir and Ritonavir in Tablet dosage form. Digest J Nanomaterials & Biostructures
2010;5(3):771.
16. Anusha Tiyyagura et al. Method Development and Validation for the Simultaneous Estimation of Atazanavir and Ritonavir in Pharmaceutical dosage form by RP-HPLC. Ijpcbs 2012 ;3(1):44-54.
How to cite this article:
Gummadi Sridhar Babu, PS. Malathi. ANALYTICAL METHOD DEVELOPMENT AND VALIDATION OF LOPINAVIR BY RP HPLC METHOD. J Sci Res Pharm 2017;6(9):95-99.
Conflict of interest: The authors have declared that no conflict of interest exists.