INTRODUCTION
Iron (Fe) and manganese (Mn) are elements commonly present in the aquatic environment [Kaleta et al. 2007, Czaplicka et al. 2017]. While mainly natural in origin, they can also derive from anthropogenic sources, especially in surface wa-ters [Grochowska and Tandyrak 2009, Molenda 2013]. Equally, the concentrations in bottom sedi-ments are typically many times higher than those in waters as such, given occurrence of these ele-ments in the form of salts that are only sparingly soluble. Both elements act to render phosphate inactive, in this way limiting processes of eutro-phication [Bartoszek and Tomaszek 2011]. The effect is highly dependent on the oxidation and reduction of the coupled pairs Fe(II)/Fe(III) and Mn(II)/Mn(IV), which result either in precipita-tion or dissoluprecipita-tion – commonly with phosphate [Gantzer et al. 2009, Naeher et al. 2013, Dunalska
et al. 2015]. A further connected result may be in-tensification of the processes by which autochtho-nous organic matter is first produced and then de-composes, and the latter process may in turn give rise to oxygen deficits in the near-bottom zone.
Equally, as internal loading with phosphates is the cause of progressive degradation in many ecosystems of both natural and artificial bodies of water [Kowalczewska-Madura et al. 2010, Zeleňáková et al. 2013], the dynamics to the oxi-dation and reduction of Fe and Mn can be assumed to exert an indirect influence on the process, pre-sumably in line with the concentrations of the lat-ter that are actually present in bottom sediments [Bartoszek and Tomaszek 2008]. In fact, the pro-cess may have yet-further consequences, not least impairment of the quality of water for use and/or the emission of greenhouse gases and odours to the atmosphere [Grabas et al. 2011, Gruca-Rokosz et al. 2011, Gruca-Rokosz and Tomaszek 2015].
Published: 2018.09.01
Volume 19, Issue 5, September 2018, pages 180–185
https://doi.org/10.12911/22998993/89823
Influence of Sedimentary Fe and Mn on the Oxygenation
of Overlying Waters in Dam Reservoirs
Piotr Koszelnik
1*,
Lilianna Bartoszek
11 Department of Environmental Engineering and Chemistry Rzeszów University of Technology, al. Powstańców
Warszawy 6, 35-959 Rzeszów, Poland
* Corresponding author’s e-mail: [email protected]
ABSTRACT
This paper reports the work to determine the impact that concentrations of manganese (Mn) and iron (Fe) in the
bottom sediments of shallow dam reservoirs exert upon the dissolved oxygen concentrations of overlying wa
-ters. Specifically, the work was conducted in the period of 2013–2014 in six shallow artificial reservoirs located in SE Poland. The waters of all the reservoirs studied are relatively well oxygenated, though both supersatura
-tion and anoxic condi-tions are observed seasonally across the 50–150% range. The reported reac-tions of bottom
sediments were between pH 7.7 and 8.2, while the mean concentrations of Mn and Fe were found to vary widely
from site to site (Mn from 0.068 to 1.48 g/kg d.w. and Fe from 2.48 to 24.0 g/kg d.w.). It was not possible to
demonstrate any direct relationship between sediment Fe and Mn concentrations, the Mn/Fe ratio or pH on the
one hand and the oxygenation of reservoir waters on the other. However, multiple regression analysis did allow for the identification of a significant influence of both Mn content and sediment pH on the oxygen concentration
in reservoir waters. In simple terms, both an increase in Mn and a decrease in pH can be said to result in more fully aerobic conditions in waters.
The work described in this paper has con-cerned the impact the Mn and Fe concentrations in the bottom sediments of shallow dam reser-voirs are able to exert on the dissolved oxygen concentrations in overlying waters. Given that the elements under study increase the retention po-tential of bottom sediments against phosphates, they may serve as an intermediate indicator of ecosystem resistance. The knowledge on this will therefore prove useful, given the interest in try-ing to safeguard such aquatic ecosystems against eutrophication.
STUDIED SITES AND METHODS USED
The samples of bottom sediment were taken at 15 sampling sites in 6 artificial reservoirs located in SE Poland. The characteristics of the reservoirs and sites studied are as shown in Table 1. The sediment was collected nine times through the 2013–2014 period, using a gravity sediment corer (KC Kajak of Denmark). The top (0–5 cm) layer was used in chemical analysis following drying. Microwave mineralization (HNO3, 2–4.5 MPa) was applied to allow for Mn and Fe determina-tions using an ICP spectrometer (Integra, GBC). The results were calculated as g of element vs. kg dry weight of sediment. The pH of deionized water extracts was also measured in the labora-tory, while dissolved oxygen (O2) and tempera-ture were recorded in situ using a portable multi-meter (MultiLine WTW). All statistical analysis was performed in Statistica software package.
RESULTS
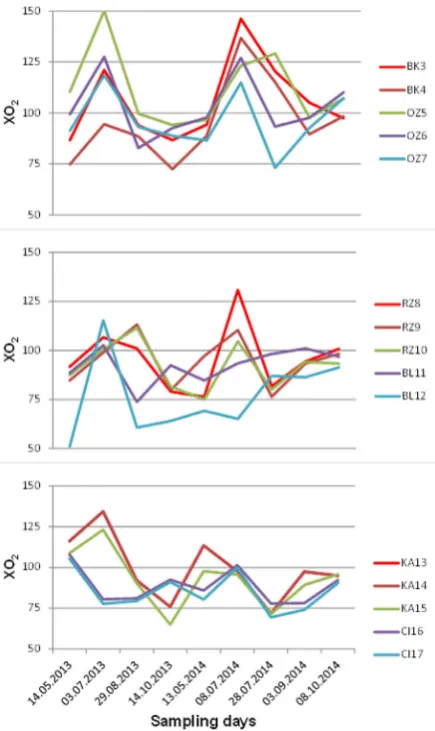
The waters under study were found to be rela-tively well-oxygenated, with the average O2 con-centration in the range 7.38 mg/L (BL12) to 10.20 mg/L (OZ6). The analysis of seasonal variation in water saturation with oxygen (XO2) indicates that for most of the sites tested, values were in the 75–100% range (Fig. 1). Equally, some of the sites at Brzóza Królewska, Ożanna and Rzeszów reservoirs were characterized by supersaturation, mainly during summer periods. In turn, Cierpisz and Blizne reservoirs reported a high degree of hypoxia, given the figures for saturation below 60% (Fig. 1). The supersaturation of water with oxygen can be observed in eutrophic, shallow ecosystems, in the summer, when the processes
of photosynthesis can outpace the oxygen con-sumption. The deficiencies may in turn indicate high oxygen consumption within bottom sedi-ments, in the absence of any possibility for these shortages to be made good from sources other than the atmosphere [Stańczykowska-Piotrowska 1990, Wójcik 2016].
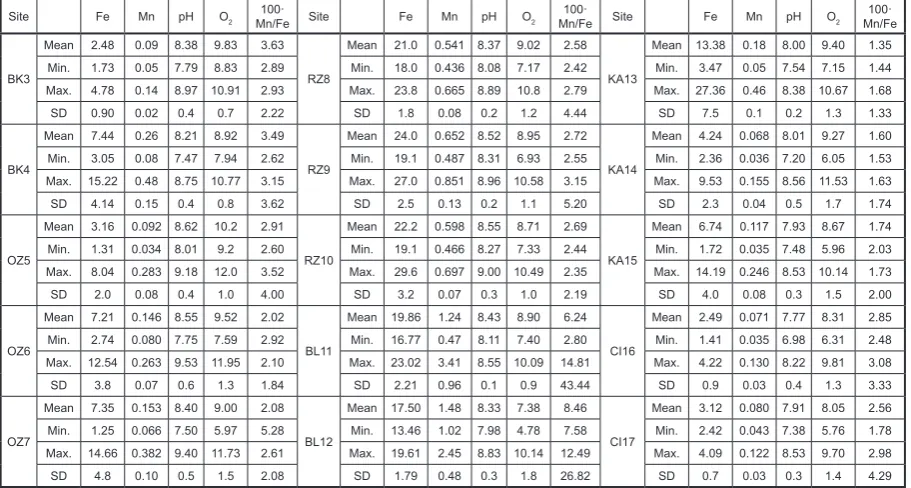
Table 2 compiles statistics that present the re-sults obtained. The Fe content was found to vary across a wide range. In Rzeszów and Blizne res-ervoirs, as well as some sites in Kamionka reser-voir, the values were in the range of 13.38–24.00 g/kg. The other reservoirs were in turn character-ized by the values in the 2.48–7.35 g/kg range. In Blizne reservoir, a Mn concentration over 1.2 g/kg was measured, while the correspond-ing figure for Rzeszów reservoir was of about 0.5 g/kg d.m. Elsewhere, the values were below 0.2 g/kg. The concentrations of the two elements studied were correlated (r2 = 0.5517, p = 0.0015). The sediments were of alkaline reaction, with
me-Fig. 1. Seasonal variability of percent oxygen
dian pH values in the 7.77–8.62 range. The calcu-lated values for the 100·Mn/Fe ratio varied from 1.35–1 (KA13) to 8.46–1 (BL12) and depended slightly on the Mn concentration in sediments (r2 = 0.3296, p = 0.0252). However, no depen-dence on Fe was observed.
The analysis of the influence of the indepen-dent variables (Fe, Mn, pH and Mn/Fe) on the dependent variable (O2) is reported in Table 3. In practice, no significant relationships were found that would describe an impact of analyzed param-eters describing bottom sediment on the dissolved oxygen concentrations in the waters studied.
Equally, the analysis of the influence of vari-ables on the value of O2 using multiple regression found that the value of the required independent variable in relation to the remaining dependent variables was best described by the function:
O2 = –4.7427 + 1.1880Mn – 1.7099pH (1) The summary of the regression in relation to O2 (Table 4) shows how the above-mentioned model can account for 65% of the variability not-ed for the dependent variable. Incorporation of additional dependent variables does not improve the parameters of the model significantly, and, as
Table 1. Characteristics of studied reservoirs (own data)
Reservoir dinateCoor- (Stream)River Volume Depth mean (max.)
Res. area
Hydraulic retention time
Catchment
area Urban Forestry Agricul-ture meadowsPasture, Studied
site Site depth
103 m3 m ha day km2 % % % % m
Brzóza
Królewska 50
o14’N
22o19’ E Tarlaka 50 0.7(1.5) 7.05 2.5 30.4 10 30 40 20
BK3 1.2
BK4 1.2
Ożanna 5022oo17’N 31’ E Złota Rzeka 275 1.4(3.7) 20 3.5 136.3 8 36 28 28
OZ5 1.2
OZ6 1.3
OZ7 1.5
Rzeszów 5021oo00’N 59’ E Wisłok 1800 0.6(4.9) 68.2 0.8 2025 10 20 55 15
RZ8 1.0
RZ9 1.0
RZ10 1.0
Blizne 4922oo44’N 00’ E Łądzierz 137 1.6(3.9) 8.66 18.0 12.0 2 27 53 18
BL11 1.2
BL12 1.3
Kamionka 5021oo08’N 40’ E Tuszymka Duża 105 1.5(3) 7 4.8 84.8 12 35 30 23
KA13 1.3
KA14 1.6
KA15 1.7
Cierpisz 5021oo09’N 43’ E Tuszymka Duża 22 0.9(1.5) 2.3 1.2 54.5 8 43 35 14
CI16 1.2
CI17 1.2
Table 2. Variability of studied bottom sediment parameters
Site Fe Mn pH O2 Mn/Fe100· Site Fe Mn pH O2 Mn/Fe100· Site Fe Mn pH O2 Mn/Fe100·
BK3
Mean 2.48 0.09 8.38 9.83 3.63
RZ8
Mean 21.0 0.541 8.37 9.02 2.58
KA13
Mean 13.38 0.18 8.00 9.40 1.35
Min. 1.73 0.05 7.79 8.83 2.89 Min. 18.0 0.436 8.08 7.17 2.42 Min. 3.47 0.05 7.54 7.15 1.44
Max. 4.78 0.14 8.97 10.91 2.93 Max. 23.8 0.665 8.89 10.8 2.79 Max. 27.36 0.46 8.38 10.67 1.68
SD 0.90 0.02 0.4 0.7 2.22 SD 1.8 0.08 0.2 1.2 4.44 SD 7.5 0.1 0.2 1.3 1.33
BK4
Mean 7.44 0.26 8.21 8.92 3.49
RZ9
Mean 24.0 0.652 8.52 8.95 2.72
KA14
Mean 4.24 0.068 8.01 9.27 1.60
Min. 3.05 0.08 7.47 7.94 2.62 Min. 19.1 0.487 8.31 6.93 2.55 Min. 2.36 0.036 7.20 6.05 1.53
Max. 15.22 0.48 8.75 10.77 3.15 Max. 27.0 0.851 8.96 10.58 3.15 Max. 9.53 0.155 8.56 11.53 1.63
SD 4.14 0.15 0.4 0.8 3.62 SD 2.5 0.13 0.2 1.1 5.20 SD 2.3 0.04 0.5 1.7 1.74
OZ5
Mean 3.16 0.092 8.62 10.2 2.91
RZ10
Mean 22.2 0.598 8.55 8.71 2.69
KA15
Mean 6.74 0.117 7.93 8.67 1.74
Min. 1.31 0.034 8.01 9.2 2.60 Min. 19.1 0.466 8.27 7.33 2.44 Min. 1.72 0.035 7.48 5.96 2.03
Max. 8.04 0.283 9.18 12.0 3.52 Max. 29.6 0.697 9.00 10.49 2.35 Max. 14.19 0.246 8.53 10.14 1.73
SD 2.0 0.08 0.4 1.0 4.00 SD 3.2 0.07 0.3 1.0 2.19 SD 4.0 0.08 0.3 1.5 2.00
OZ6
Mean 7.21 0.146 8.55 9.52 2.02
BL11
Mean 19.86 1.24 8.43 8.90 6.24
CI16
Mean 2.49 0.071 7.77 8.31 2.85
Min. 2.74 0.080 7.75 7.59 2.92 Min. 16.77 0.47 8.11 7.40 2.80 Min. 1.41 0.035 6.98 6.31 2.48
Max. 12.54 0.263 9.53 11.95 2.10 Max. 23.02 3.41 8.55 10.09 14.81 Max. 4.22 0.130 8.22 9.81 3.08
SD 3.8 0.07 0.6 1.3 1.84 SD 2.21 0.96 0.1 0.9 43.44 SD 0.9 0.03 0.4 1.3 3.33
OZ7
Mean 7.35 0.153 8.40 9.00 2.08
BL12
Mean 17.50 1.48 8.33 7.38 8.46
CI17
Mean 3.12 0.080 7.91 8.05 2.56
Min. 1.25 0.066 7.50 5.97 5.28 Min. 13.46 1.02 7.98 4.78 7.58 Min. 2.42 0.043 7.38 5.76 1.78
Max. 14.66 0.382 9.40 11.73 2.61 Max. 19.61 2.45 8.83 10.14 12.49 Max. 4.09 0.122 8.53 9.70 2.98
is clear from the above, the changes in the pH of reservoir bottom sediments have the greatest in-fluence on the values recorded for O2.
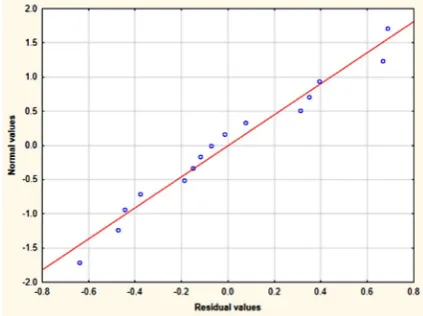
The validity of the model was further demon-strated by analyzing the correlations between the sampled values for O2 and theoretical values (de-riving from Eq. 1) (Fig. 2). Further confirmation is offered by the distribution of residuals close to the normal distribution (Fig. 3).
DISCUSSION
The observed concentrations of Fe and Mn in the bottom sediments of the reservoirs studied were lower than those obtained for other ecosys-tems in southern Poland. Czaplicka et al. [2017] reported the Fe concentrations in Czorsztyn, Dobczyce, Goczałkowice and Rybnik reservoirs of approx. 30 g/kg, with Mn in the 1.33–3.27 g/kg range. The differences may result from the nature
and management of the catchment areas exam-ined, e.g. reflecting slope or various potential ori-gins of the elements [Karwacka et al. 2015].
The mobility of Mn reflects the occurrence in various forms under different redox conditions. Where anoxia is present, releases of Mn and Fe from the sediment into overlying water are ob-served, and this should theoretically dampen any growing deficiency of oxygen in overlying wa-ters [Hou et al. 2013]. Given the lack of any sig-nificant relationship between the 100·Mn/Fe ratio and oxygen deficits arising in waters, there may be confirmation of the idea that both are released into the water column with similar efficiency. Nevertheless, the oxidation of Fe(II) is known to proceed more rapidly than that of Mn(II) [Naeher et al. 2013], while the involvement of numerous interdependent transformation processes leads to a complex pattern describing the presence of the redox-sensitive trace metals.
However, the Fe present in waters is not nec-essarily there on account of redox-related remobi-lization, as it can also be a tracer for terrigenous sources [Neaher 2012]. In light of this, the ob-served lack of a correlation with oxygen content in waters that was found to characterize the con-centration of Fe in the sediment (and indirectly the release of that element from sediment) may indicate the diverse ways in which this element is transformed. In turn, the contribution of Mn to the multiple correlation model may confirm the
Table 3. Influence of bottom sediment parameters on water oxygen content expressed as Pearson coefficient (R)
Parameters Fe Mn pH Fe/Mn
O2 0.36586 0.31225 -0.49837 0.294298
Table 4. Summary of the multiple regression analysis
Statistics Value
R of multiple correlation 0.8093
R2 of multiple correlation 0.6549
Corrected R2 0.5608
F(3.11) 6.9588
P 0.0068
Error of the estimation 0.4618
Fig. 3. Multiple regression results: the distribution of residuals close to the normal distribution
predominance of Mn release into overlying water in association with phosphates, with the result of the presence of the latter being decreased oxygen content [Bryant et al. 2011]. Furthermore, while this impact is significant statistically (Table 4), it is less so in quantitative terms. From the model (Eq. 1), it appears that an increase in the concen-tration of Mn in sediments by 1.18 g/kg d.m. (or in fact a reduced release of such a charge), en-riches water by 1 mg/L of oxygen. However, the Mn concentrations in sediments are only about one-tenth as high, so an analogous proportion of the influence of the independent variable on the dependent should be assumed.
In addition, the model (Eq. 1) implies that a lowering of the pH value of the sediment by 1.70 units again enriches water in oxygen, by 1 mg/L, with the proportions similar to those above again being maintained. Nevertheless, an inverse pro-portional effect of pH on the oxygen content in the supernatant is in fact reported widely [Hou et al. 2013, Wu et al. 2013].
CONCLUSIONS
1. The waters of the reservoirs studied are rela-tively well-oxygenated, though both super-saturation and anoxic conditions are observed seasonally, perhaps indicating the presence of autochthonous organic matter.
2. Bottom sediments are alkaline, and the concen-trations of Mn and Fe varied between the stud-ied sites across a wide range of values, albeit with the latter still lower than in other reser-voirs of this geographical zone.
3. No direct impact of bottom-sediment Fe or Mn content, Mn/Fe ratio or pH on oxygen condi-tions in the reservoir waters could be detected. 4. Multiple regression analysis nevertheless al-lowed for the identification of a significant in-fluence of the Mn content and sediment pH on the oxygen concentration in the waters studied. In essence, an increase in the Mn content and a reduction in pH both result in more favorable aerobic conditions in waters.
Acknowledgements
The research was funded by the Polish Na-tional Science Center in the framework of the re-search project No. 2011/03/B/ST10/04998.
REFERENCES
1. Bartoszek L., Tomaszek J. 2008. Relationships between phosphorus distribution and major com-ponents in the bottom sediments of the Solina-My-czkowce reservoirs. Archives of Environmental
Protection, 34, 151–161.
2. Bartoszek L., Tomaszek J.A. 2011. Analysis of the spatial distribution of phosphorus fractions in the bottom sediments of the Solina-Myczkowce dam
reservoir complex. Environment Protection Engi -neering, 37(3), 5–15.
3. Bryant L.D., Hsu-Kim H., Gantzer P.A., Little J.C. 2011. Solving the problem at the source: control-ling Mn release at the sediment-water interface
via hypolimnetic oxygenation. Water Research, 45(19), 6381–6392.
4. Czaplicka A., Ślusarczyk Z., Szarek-Gwiazda
E., Bazan S. 2017. Spatial distribution of iron and manganese in bottom sediments of the
Goczałkowice Reservoir. Ochrona Środowiska, 3, 47–54 (in Polish).
5. Dunalska J.A., Grochowska J., Wiśniewski G.,
Napiórkowska-Krzebietke A. 2015. Can we restore badly degraded urban lakes?. Ecological
Engineer-ing, 82, 432–441.
6. Gantzer P.A., Bryant L.D., Little J.C. 2009. Con-trolling soluble iron and manganese in a
water-supply reservoir using hypolimnetic oxygenation. Water Research, 43(5), 1285–1294.
7. Grabas M., Tomaszek J.A., Czerwieniec E.,
Zamorska J., Kukuła E., Masłoń A., Gruca-Rokosz R. 2011. Noxiousness of odours and properties of
wastewater sludge processing with bioprepara-tion. Environment Protection Engineering, 37(3), 17–25.
8. Grochowska J., Tandyrak R. 2009. The influence
of the use of land on the content of calcium,
mag-nesium, iron and manganese in water, exemplified
in three lakes in the Olsztyn vicinity. Limnological Review, 9(1), 9–16.
9. Gruca-Rokosz R., Tomaszek J.A. 2015. Methane
and Carbon Dioxide in the Sediment of a Eutrophic Reservoir: Production Pathways and Diffusion Fluxes at the Sediment–Water Interface. Water,
Air, and Soil Pollution, 226(2), 2268–2268. 10. Gruca-Rokosz R., Czerwieniec E., Tomaszek J.A.
2011. Methane emission from the Nielisz Reser-voir. Environment Protection Engineering, 37(3), 101–109.
11. Hou D., He J., Lü C., Sun Y., Zhang F., Otgonbayar
K. 2013. Effects of Environmental Factors on Nu -trients Release at Sediment-Water Interface and Assessment of Trophic Status for a Typical
12. Kaleta J., Puszkarewicz A., Papciak D. 2007. Re-moval of iron, manganese and nitrogen compounds from underground waters with diverse physical and chemical characteristics. Environment Protec-tion Engineering, 33(3), 5–13.
13. Karwacka A., Niedzielski P., Staniszewski R. 2015. Status assessment of the bottom sediments of
selected lakes of Poznań district. Rocznik Ochrona Środowiska, 17(2), 1684–1698 (in Polish).
14. Kowalczewska-Madura K., Gołdyn R., Donda -jewska R. 2010. Phosphorus release from the
bot-tom sediments of Lake Rusałka (Poznań, Poland). Oceanological and Hydrobiological Studies, 39(4), 135–144.
15. Molenda T. 2013. Iron (Fe) and manganese (Mn)
as mining water pollution indicators (on the exam -ple of objects from the Upper Silesian Coal Basin). Journal of Civil Engineering, Environment and Ar-chitecture, 60(3), 69–78 (in Polish).
16. Naeher S., Gilli A., North R.P., Hamann Y., Schu-bert C.J. 2013. Tracing bottom water oxygenation
with sedimentary Mn/Fe ratios in Lake Zurich, Switzerland. Chemical Geology, 352, 125–133.
17. Naeher S., Smittenberg R.H., Gilli A., Kirilova E.P., Lotter A.F., Schubert C.J. 2012. Impact of recent lake eutrophication on microbial commu-nity changes as revealed by high resolution lipid biomarkers in Rotsee (Switzerland). Organic
Geo-chemistry, 49, 86–95.
18. Stańczykowska-Piotrowska A. 1990. Ecology of
our waters. Wydawnictwa Szkolne i Pedagogiczne
(in Polish).
19. Wójcik M. 2016. Seasonal changes in physico-chemical and microbiological parameters of water in the gravel pit lake used for recreation. Journal of Civil Engineering, Environment and Architecture, 63(2/I), 387–399 (in Polish).
20. Wu Y., Wen Y., Zhou J., Wu Y. 2014. Phosphorus
release from lake sediments: effects of pH, temper
-ature and dissolved oxygen. KSCE Journal of Civil
Engineering, 18(1), 323–329.
21. Zeleňáková M., Čarnogurska M., Šlezingr M., Słyś
D., Purcz P. 2013. A model based on dimensional analysis for prediction of nitrogen and phosphorus
concentrations at the river station Ižkovce, Slovakia.