Forestry & Natural-Resource Sciences Last Correction: Aug. 28, 2009
IMPACTS OF MANAGEMENT INTENSITY AND HARVESTING
PRACTICES ON LONG-TERM FOREST RESOURCE
SUSTAINABILITY IN GEORGIA
Shangbin Liu
1, Chris J. Cieszewski
21Biostatistician, Premier Research Group Limited, Ph./FAX: (678)279-4848/4880 2Professor, University of Georgia, Ph./FAX: (706)542-8169/8356
Abstract. Using a spatially explicit forest management model called OPTIONS simulation analyses
are conducted to investigate the impact of intensive management practices, rotation age, and harvest level on long-term wood production, harvest opportunities, and resource sustainability. The initial forest inventory is compiled from datasets of the USDA Forest Service Forest Inventory Analysis Unit, various GIS data, Landsat thematic mapper imagery, and simplified assumptions about the spatial distribution of different forest cover types. The parameters of the model are determined from published and unpublished literature, and from interviews with experts in the area of forest management in the Southeastern US. The sensitivity analyses reveal the impacts of various combinations of rotation age, harvest level and percentage of land put into intensive management and of the interaction of these factors on the sustainability of the forest resource production under the condition of a 4% net reduction in the forestland area. The results of the analyses suggest that IMP acreage and rotation length are key factors in sustaining an increased harvest level. The volume available for harvest increases with an increasing rate of transition to intensively managed pine plantations (IMP rate) for each harvest level and rotation age. Even a reduced forest land base (4% net reduction) in Georgia can easily sustain the current level of harvest with the current level of intensive pine plantation management for short and medium rotation ages. Increased pine plantation management intensity could lead to sustainable or even increased future wood production despite a decline in the forest land base and an increased wood demand. Timber growth would exceed removals in most of each of the projection periods. Throughout the projections the distribution of the harvestable volume by species group shows that the traditionally managed pine plantations (PSOF) contribute to the largest share of the total harvestable volume. The distribution of the harvest by species group indicates that the harvest come mainly from PSOF and IMP. The merits of definitions of the scenarios in this study are discussed and compared with those used in the subregional timber supply (SRTS) modeling.
Keywords: Intensive management practices; forestland; harvest level; rotation age; sustainability; simulation; OPTIONS; SRTS
1
Introduction
The forest products industry in Georgia is one of the most important contributors to the state’s economy with an estimated total annual impact of $28.5 billion in output, 141,155 jobs, and $6.7 billion in compensa-tion to employees and proprietors (Riall 2008). In ad-dition to the direct economic benefit, Georgia’s forests provide other indirect benefits, such as hunting, fish-ing, hikfish-ing, and other outdoor recreational opportuni-ties. The forests help to maintain a clean water sup-ply, conserve soil and provide habitat for many fish and
wildlife species, some of which are presently endangered.
Current projections show an increasing demand on wood and wood products, while the areas of commer-cial forests are decreasing due to fast population growth and subsequent urban expansion and other development uses. While some agricultural areas have been converted to forestry use, as the state becomes more populated, ur-ban/suburban expansion will result in fewer acres avail-able for forestry production. At the same time, as the population of the state increases the demand for clean water and other non-timber forest uses such as hiking and camping will be increasing. This will further reduce
Copyright c2009 Publisher of the International Journal ofMathematical and Computational Forestry & Natural-Resource Sciences
the number of acres available for production forestry. Various possible regulatory constraints, such as man-dated streamside management zones and road beautify-ing buffers may contribute to reduction of the commer-cial land base. Most of the projected net reduction is in the Southeast region, especially around fast-growing areas such as the Atlanta (Ahn et al. 2001, Dangerfield and Hubbard 2001, Ahn et al. 2002, Alig et al. 2002, Prestemon and Abt 2002, Wear and Greis 2002a,b, Alig et al. 2003, Alig and Butler 2004).
Forest management in the South has been intensify-ing over the past two decades, settintensify-ing a trend that is expected to continue (Siry et al. 2001, Siry 2002). In the face of urban expansion and environmental pressure to reduce the numbers of acres dedicated to plantation forestry, the implementation of intensive management practices in pine plantations provides more production due to significantly increased growth rates (Sedjo and Botkin 1997, Daniels 1999, Borders and Bailey 2001, Alig et al. 2002, Martin and Shiver 2002).
Thus, a compelling question in this changing environ-ment is whether Georgia’s forests can sustain the needed production of forest products in the state while exclud-ing a substantial part of the resource from non-forest industry related uses. Towards that end Cieszewski et al. (2004) proposed a simulation-based approach for analysis of the impact of various management practices and regulatory constraints on the resource and produc-tion sustainability. Based on limited data, simplified species groups and site index classification, arbitrarily selected harvest levels and basic assumptions of manage-ment regimes, Zasada et al. (2002) performed a study on the impacts of IMP on long-term sustainability of for-est resources in Georgia. Liu et al. (2009) conducted a simulation study on long-term fiber supply assessment, which was based on detailed species group, site index, and rotation age classification and comprehensive har-vest levels and management regimes, while the forest-land base was kept unchanged and at the current level throughout the entire simulation period. In this study, the sensitivity analysis is performed with respect to im-pacts of rotation age, transition rate to IMPs, and har-vesting limits on long-term forest resource sustainabil-ity of Georgia under the condition of a reduction in the forest land base, along with the application of updated yield tables of IMPs and different harvesting priorities.
2
Data
The initial forest inventory is compiled from datasets of the USDA Forest Service Forest Inventory Analysis Unit, various GIS data, Landsat thematic mapper im-agery, and simplified assumptions about the spatial dis-tribution of different forest cover types. The database
creation process and advantages of using Landsat im-agery for landscape analysis were described in Liu et al. (2009).
3
Methods
A conceptual framework was proposed for analysis of various management practices and regulatory con-straints and their impacts on resource and harvest sus-tainability (Cieszewski et al. 2004). Using the principles of this methodology, and applying them with compre-hensive information on the related factors, such as im-pacts of the rotation ages, IMP rates, and harvest levels on the long-term fiber supply in Georgia we continue the investigation under the reduced forestland base assump-tion.
3.1 Simulator, Species Group, Site Index Class, and Management Regime The simulator, definitions of species group and site index class, and management regimes for each species group are the same as in Liu et al. (2009). In brief, a spatially explicit forest estate model called OPTIONS from DR Systems Inc. is used to determine impacts of various forest management ac-tivities at the forest and stand levels. The simulation lengths are 200-years. The six broad species groups are natural pine stands, traditionally managed pine stands, intensively managed pine stands, upland and bottom-land hardwoods, and oak-pine forests, abbreviated as NSOF, PSOF, IMP, UWDS, BHWD, and OAKP re-spectively. The seven site index classes are extremely low, very low, low, medium, high, very high, and ex-tremely high, abbreviated as ELOW, VLOW, LOW, MED, HIGH, VHIG, EHIG respectively. A management regime is composed of combinations of individual silvi-cultural treatments, such as regeneration, fertilization, thinning, genetically improved stock, etc.
3.2 Yield Table for IMP and Management
Regime after Harvest The yield tables for NSOF, PSOF, UWDS, BHWD, and OAKP at each site index class are the same as in Liu et al. (2009). The yield tables for IMP are significantly different from in Liu et al. (2009), in which the IMP growth is assumed 2 times higher than in unmanaged stands. In this study, a state-of-the-art individual stand growth simulator called SiMS from ForesTech International, LLC is used to gen-erate the yield tables of IMP (SiMS 2003). These ta-bles consider the responses from genetically improved seedlings and fertilization, which are defined for man-agement regimes of IMP. The responses from thinning are considered in OPTIONS as a part of the definition of scenarios.
har-vest is almost the same as in Cieszewski et al. (2004), i.e. 90% of NSOF, 50% of OAKP, 10% or 40% UHWD, and 10% of BHWD are converted to PSOF after harvesting, with a revision to manage as BHWD for BHWD stands with a site index class below MED, as per an unpub-lished report (Goetzl 1998).
3.3 Harvest Priorities Harvest priorities are set for wood types and species group. For priorities of wood types, the following assumptions are used: thinning should be performed as the first priority, the over-mature stands should be cut next, and the mature stands should be cut last. The definition of the harvest priority by species group is the same as in Cieszewski et al. (2004), i.e. in the order of IMP, PSOF, NSOF, OAKP, UHWD, and BHWD.
A minimum volume from thinning, which is equal to the initially qualified thinning volume from IMP, is set to ensure the qualified IMP stands will be thinned. Con-sequently the minimum harvest from IMP is the same as what we wished to thin from the IMP. The minimum harvesting volumes are set to ensure certain minimum wood supply for species groups with a lower priority in harvest (e.g., BHWD, UHWD, NSOF, and OAKP). The minimum volume that has to be cut is based on results of the recent FIA reports for Georgia (Thompson, 1998).
3.4 Land Base Losses The land base loss is defined as the percentage of the projected net forestland reduc-tion to all forestland acreage in a given region. The estimates of an average of 4% forestland loss for Georgia (see the discussion section in this paper for the details) are based on the recent national Renewable Resources Planning Act [RPA] (Haynes et al. 2001, Haynes 2003) and the Southern Forest Resource Assessment Consor-tium (SOFAC) findings (Prestemon and Abt 2002). In this study, simulations are run based on 96% of the area of current forestland in Georgia.
4
Investigated Factors
4.1 Rate of Transition to IMP The rate of transi-tion to IMP is the proportransi-tion of stands to be artificially regenerated that will fall into intensive management. To test the potential impact of increasing the scale of inten-sive management on Georgia forestry and wood supply, 11 rates of transition to IMP, are considered (0 to 100% increments of 10%). Current IMP acreage is about 30% of all plantations. P0 means maintaining the current sta-tus of all plantations. P30 means that 30% regenerated plantation is managed as IMP, which is a scenario that is most likely (Goetzl 1998). As an extreme case, P100 assumes that all newly planted pine stands would be managed as IMP. P10, P20, P40, P50, P60, P70, P80,
and P90 mean that 10%, 20%, 40%, 50%, 60%, 70%, 80%, and 90% of regenerated plantation is managed as IMP, respectively.
4.2 Harvest Level For the projections six harvest levels are considered, which is based on 0 to 50% harvest increases over limits at current level in increment of 10%. The current harvest level of removals in Georgia is ap-proximately 42.5 mm3/yr [million m3per year]
(Thomp-son 1998). H0 means keeping the current annual harvest during the entire simulation period. On the other hand, H40, the most likely case in practice (Haynes et al. 2001, Prestemon and Abt 2002, Haynes 2003), means harvest-ing 40% more than the current harvest by 2050, i.e., 59.5 mm3/yr, and then holding it constant. H10, H20,
H30, and H50 mean harvesting 10%, 20%, 30%, and 50% more than the current harvest by 2050 and then holding it constant, respectively. The period between 2000 and 2050 is evenly divided into 10 intervals. The increase in the harvest between two adjacent intervals is one-tenth of the total harvest increase.
4.3 Rotation Age Three types of rotation ages, short (S), medium (M), and long (L), are defined for each site/species group combination based on the similar research as what are used to define the yield tables. Val-ues of rotation age are the same as in Liu et al. (2009). With respect to the short rotation age, the medium and long rotation ages are 5 and 10 years longer for NSOF, OAKP, UHWD, BHWD, and 2 and 5 years longer for PSOF and IMP.
4.4 Execution of the Simulations The 198 simula-tions are run for all combinasimula-tions (scenarios) of different levels of three factors: the IMP rate, rotation age, and harvest level. The model generates outputs that con-tain the volume inventory, forested area, volume avail-able for harvest, and harvest by species group and by wood type at each year of the period of projection. The OPTIONS outputs are presented in figures illustrating potential trends in long-term fiber supply in Georgia.
5
Results
For convenience a scenario is denoted by the combi-nation of any different levels (abbreviated) of the three investigated factors: harvest level, IMP rate, and ro-tation age. For example, H0-P0-S means a scenario of keeping the current harvest level (42.5 mm3/yr),
of stands to be artificially regenerated falling into inten-sive management, and use of a short rotation age class. H40-S means a scenario of 40% more than the current harvest level by 2050 and then holding it constant, and the use of a short rotation age class.
5.1 Impacts from Three Factors and Their In-teractions on the Forest Resource Sustainabil-ity Volume available for harvest, or harvestable volume, which is the volume represented by stands at ages equal to or older than the harvest ages, shows similar trends over time for all scenarios. That is, the harvestable vol-ume would initially decrease during the first two to three decades followed with an increase. After reaching a max-imum, over the next century the volume available for harvest would remain steady at a level slightly lower than its peak (Fig. 1 and 2). Although 198 scenarios are modeled in this analysis, only parts of them are shown in the paper. However the trends shown in the paper are common to all scenarios.
To investigate the impacts on the sustainability of the fiber supply from the IMP rate and harvest level, the results from the short rotation age are used. Under the short rotation age the harvestable volume increases with an increasing IMP rate for different harvest levels. On average over the entire projection period, with H0-S applied, the volume available for harvest would vary from 952 to 1740 mm3 with an increment of about 6%
for each IMP increase as IMP rate changes from P0 to P100 (Fig. 1a). Under H40-S it would vary from 560 to 1274 mm3 with a 9% increment (Fig. 1b). Under
certain harvest levels the minimum harvestable volume comes early with the increase of the IMP rate. For ex-ample, under H40-S the years to reach the minimum harvestable volume change from 21 to 31 years as IMP rate changes from P100 to P0.
As expected, the total harvestable volume decreases with the increase of the harvest level for any given level of IMP rate (Fig. 1a,b,c). For example, with P30-S ap-plied, the volumes available for harvest are 1116, 729, and 629 mm3, on average, for H0, H40, and H50
respec-tively. With the increase of the harvest level, it takes much more time to reach the minimum harvestable vol-ume for any given level of IMP rate. For example, with P0 applied, the years to reach the minimum harvestable volume are 23 and 31 years for H0 and H40 respectively. Even in the presence of a declining forestland (e.g. 4% net reduction) Georgia can easily sustain the cur-rent harvest (Fig. 1a) and would sustain the increasing harvests (Fig. 1b,c) with the different levels of intensive management. With H0-P0-S applied, the harvestable volume is larger than its initial level, 621 mm3, for most
of the simulation period except for the first three decades when it initially decreases to 199 mm3and then increases
to reach its initial level. Beyond 2060 it would remain steady at twice its initial level (Fig. 1a, the square la-beled line). Under H40-P0-S the harvestable volume de-creases to 132 mm3 in the first three decades, and then takes two decades to come back to its initial level. Af-ter that the volume would be stable at its initial level (Fig. 1b, the square labeled line). At H50-P0-S har-vestable volume is lower than its initial level throughout the projections, at a level of about 454 mm3 for most
of the simulation period, which is about 30% lower than its initial level (Fig. 1c, the line labeled with squares). Thus, to keep the initial level of the harvestable volume beyond year 2050, at least 30% (Fig. 1c, the line labeled with short dashes) of new plantations would have to be converted to intensive management.
Changes in rotation ages impact the volume available for harvest in a similar way, but with different magni-tudes (Fig. 2, the lines labeled with hollow symbols). Throughout the simulation, the harvestable volume of the short rotation is larger than those of the medium and long rotations since the volume available for har-vest is defined as the volume represented by stands at ages equal to or older than the rotation ages. Under the long rotation the forestland in Georgia cannot sustain the current harvest with the current IMP level (Fig. 2a, the line labeled with hollow triangles). With an increas-ing harvest level applied, even with part of the stands to be artificially regenerated being converted to inten-sive management, sustainability in the fiber supply can-not be assured (Fig. 2b,c, the hollow-triangle labeled lines). Even though the harvestable volumes are differ-ent among three rotation age classes, the total volume inventory (Fig. 2, lines labeled with solid symbols) shows no significant differences in magnitude among them. At the beginning of the projections the total volume of the short rotation is equal to or slightly larger than those of the medium and long rotations, while beyond a cer-tain year, which depends on the harvest level and IMP rate, the total volume of the long rotation would be the largest and that of the short rotation would be the small-est. Despite the initial decrease in volume available for harvest, the total volume shows a very slight decrease in the first decade and follows a steady increase for three to four decades. After that it would slowly level off.
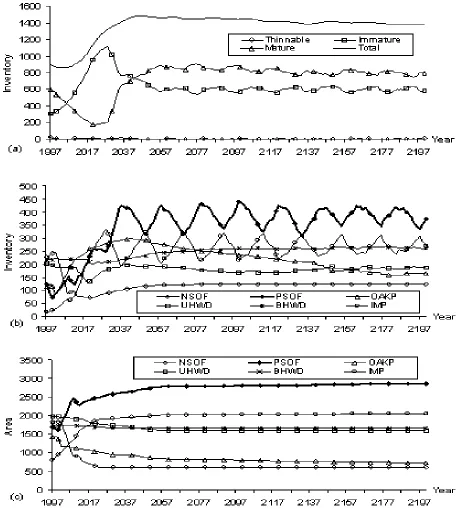
Figure 2: Volumes available for harvest and standing total inventory over time for scenarios of (a) keeping the current harvest level (42.5 mm3/yr) and current level of IMP (30% of all pine plantation areas in Georgia) during the entire
simulation period (H0-P0); (b) 40% more than the current harvest level by 2050 (59.5 mm3/yr) and then holding
from IMP rate and harvest level, H0-P0-S can be con-sidered as a “control” in the experiment.
The increased pine plantation management intensity could lead to sustainable or even increased future wood production despite a decline in the forest land base and an increased wood demand (Fig. 3, 4, 5 and 6). Such productivity increases could prevent timber shortages, at least for pulpwood.
With H40-P30-S, a scenario that most likely will oc-cur, in the first several years of the projection the re-movals slightly exceed growth. Then the timber growth is projected to exceed removals till 2050. After that they would be close to each other (Fig. 3). The vol-ume available for harvest would quickly decrease from 621 to 185 mm3 during the first two decades, and then
rapidly increase in the next 15 years to reach its initial level. After this quick increase, it would gradually reach the maximum of 910 mm3 around 2070. After
reach-ing the maximum, it would remain steady at a level of about 820 mm3, which is about 30% larger than its
ini-tial level (Fig. 5a,b). Correspondingly, under H0-P0-S the harvestable volume shows an almost identical pat-tern as H40-P30-S in the first three decades. After that it reaches a higher maximum of 1196 mm3 by the end of this century. Over the next century it would remain steady at a level of about 1107 mm3, which is about twice its initial level (Fig. 4a,b).
The portions of the volume available for harvest by wood type vary between different simulations. With H40-P30-S applied the portions of mature and over-mature volume start out initially at about 325 and 268 mm3 respectively. After dropping in the first three decades, the mature volume becomes 5 times that of the over-mature volume, on average 511 and 102 mm3 respectively, in the following two decades. After that the two volumes would remain steady at on average 412 mm3, moderately larger than their initials (Fig. 5a).
With H0-P0-S applied the mature volumes are larger than the over-mature volumes throughout the projec-tions except for the first several years. Overall, the mature volume is nearly twice that of the over-mature volume, 599 and 349 mm3 respectively, for the entire
projection period (Fig. 4a).
On the other hand, the harvestable volume by species group shows a similar pattern for two investigated sce-narios, with differences in magnitude (Fig. 5b and 4b). Under H0-P0-S the harvestable volume of PSOF, which is the largest share of the total harvestable vol-ume, shows a typical decrease-increase-constant pattern throughout the projections (Fig. 5b and 4b, thick di-amond labeled lines). However, with H40-P30-S ap-plied it is much lower than that under H0-P0-S beyond 2035. The shares of PSOF are 29% and 51% of the to-tal harvestable volume for H40-P30-S and H0-P0-S
re-spectively. Throughout the projection the harvestable volume of IMP fluctuates at a low level compared with those of other species groups. Since the IMP has the first priority in harvest, any mature volume in this type of stand is always harvested once it becomes available (Fig. 5c and 4c), which is quite common in real for-est management practices. The harvfor-estable volume of IMP under H40-P30-S is much higher than that under H0-P0-S. Over the entire projection period, 66% of the years have harvestable volumes of IMP between 20 and 40 mm3 under H40-P30-S (Fig. 5b). While under
H0-P0-S 82% of the years have harvestable volumes of IMP less than 20 mm3 (Fig. 4b). Since 30% of stands to
be artificially regenerated will fall into intensive man-agement, there is an increase in the harvestable volume in IMP under H40-P30-S. With H40-P30-S applied, the harvestable volumes of NSOF, UHWD, and OAKP show a decrease-increase-level off pattern. The availability of harvestable volume in BHWD remains unchanged dur-ing the whole simulation period (Fig. 5b).
The distribution of the harvest (cut volume) by species group indicates that the harvest comes mainly from the pines, which includes IMP, PSOF, and NSOF. Overall 79% (45% from IMP, 31% from PSOF, and 3% from NSOF) and 71% (24% from IMP, 44% from PSOF, and 3% from NSOF) of the harvest would be harvested from the pine stands for H40-P30-S (Fig. 5c) and H0-P0-S (Fig. 4c) respectively. The harvests from hardwoods (UHWD and BHWD) and OAKP account for 20% and 8% of the total harvest in H0-P0-S respectively. With H40-P30-S hardwoods contribute 15% of the total har-vest and OAKP make up the rest of 6%.
Different from the harvestable volume, which is a part of total volume, the total volume by maturity indicates that with H40-P30-S the mature (including the mature and over-mature mentioned in the analysis of the vol-ume available for harvest by wood type) initially is about twice of the immature, 593 vs. 308 mm3. During the
Figure 3: OPTIONS model projections of timber growth and removals volumes in the state of Georgia, 1997 to 2200, under H40-P30-S assumptions of 40% more than the current harvest level by 2050 (59.5 mm3/yr) and then holding it
constant, 30% of stands to be artificially regenerated falling into intensive management, and use of a short rotation age.
from 22% to 14%), and BHWD (decreases from 24% to 19%). Similar to the volume changes by species group, the area (Fig. 6c) also changes the most in the planted and natural pines. The areas of PSOF and IMP increase from about 18% and 8.5% to 30% and 21.5% of the total area respectively. The area of NSOF drops from 20% to 6%. The area of OAKP decreases from 15% to 8% and UHWD decreases from 21% to 17%. The area of BHWD remains unchanged throughout the simulation.
6
Discussion
The goal of this study is to investigate the potential impacts of the individual factors, intensive pine planta-tion management, rotaplanta-tion age, and harvest level, and the interaction of these factors on the production and sustainability of forest resources in Georgia. There are certain necessary simplifications and uncertainties in the assumptions that could affect the results. The reliabil-ity of such projections becomes progressively lower as the time projected into the future increases. Yet the general trends revealed in this study are based on state-of-the-art analysis and are correct and conclusive.
The assumption that the intensive management plan-tations are introduced in the mid-eighties (see Liu et al. 2009 for the definition of IMP) implies that these plantations are still not available for harvest. Since the intensive plantations produce most of the harvested vol-ume in the study area, all simulations are characterized by an initial reduction of available volumes.
6.1 Increased Wood Demand and Declining
Forestland Base Current projections show an
increas-ing demand on wood and wood products from decreas-ing areas of commercial forests due to fast population growth and subsequent urban expansion and develop-ment uses. The most recent RPA predicted that under assumptions regarding economic trends through 2050, U.S. timber harvest would increase 38% (Haynes et al. 2001, Haynes 2003). Meanwhile the timberland area is projected to decline by 3 percent. The SOFAC made projections for the South independently from RPA pro-jections by using the subregional timber supply (SRTS) model (Adams and Haynes 1996, Abt et al. 2000). In aggregate, harvests from private lands were projected to increase by 53% (56% and 49% for softwoods and hard-woods respectively) and private timberland will decrease by 1% between 1995 and 2040 under the base scenario, abbreviated as IH for inelastic demand-high plantation growth rate increase (Prestemon and Abt 2002). Har-vests from private lands and land losses were projected to change unevenly across the South. State-level pro-jected harvests and land losses in private timberland un-der the IH showed that the harvests would increase from 38.6 to 51.0 mm3 or by 32% (33% and 30% for
2003, Alig and Butler 2004), which project that most of the projected net reduction was in the Southeast region, especially around fast-growing areas such as Atlanta.
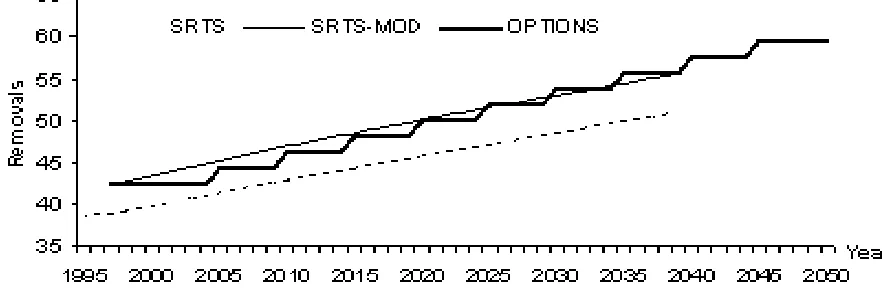
The assumption of the harvest and net reduction on the forest land base for the state of Georgia is consistent with the above projections done for this study, espe-cially for the investigated case H40-P30-S. The 4% net reduction in the forest land base is set by considering the variation in five Forest Inventory Analysis survey units. Compared with the projection of the SOFAC, which pro-jected a 32% increase on harvest between 1995 and 2040 by using the SRTS model, a scenario is investigated with a 40% increase to the current harvest by 2050. The har-vests are compiled in the simulator, OPTIONS, and are very close to the modified SRTS values (Fig. 7, SRTS-MOD). Since the differences between the projected har-vest at 1997 by the SRTS model and those estimated at 1997 by FIA (Thompson 1998) are 38.9 and 42.5 mm3
respectively, the harvest is modified to keep the same rate as SRTS. If the harvest projected by SRTS occurs, the conclusions on sustainability of forest resources are still valid, or even stronger, since a higher level of harvest is utilized in the OPTIONS than in SRTS.
6.2 Pine Plantation Management Intensity For-est management in the South has been intensifying over the past two decades, setting a trend that is expected to continue (Siry et al. 2001, Siry 2002). Recent declines in harvest on public lands in the West have significantly de-viated from historic growth/removal patterns and have placed more pressure on eastern forests that are predom-inantly in private ownership (Smith et al. 2004). The Southeast, with its shorter rotation and a greater pos-sibility to augment growth and yield through intensive management practices, represents a region with the po-tential to retain a portion of the market share lost by timber producers in the West (Alig 1990, Garcia and Abt 1997, Cubbage et al. 1998, Joyce and Birdsey 2000, USDA 2001, Adams 2002, Haynes 2002, Mills and Zhou 2003).
The simulation results in this study suggest that the reduced (4%) timberland in Georgia can easily sustain the current level of harvest (H0) with the current level of intensive management (P0) for different choices of the rotation age classes. While with an increased harvest, the sustainability of the wood supply would depend on the rotation ages and also on an increase in IMP. The results of the analysis also indicate that the minimum harvestable volume is closer to the annual harvest with the harvest level increase. It would imply that part of new plantations would have to be converted to intensive management to assure sustainability of forest resources under an increasing harvest scenario. The higher the harvest level, the more plantations would have to be
converted.
The results of the analysis show that the increased harvest could be supplied by increasing intensive pine plantation management. By comparison of the cases of keeping the current harvest level and IMP rate (H0-P0-S), and of applying an increasing harvest level and an in-creasing IMP rate (H40-P30-S), the majority of harvest comes from PSOF and IMP. The different patterns be-tween them should be that the proportions of the harvest from PSOF and IMP are reversed, that is, the main part of the harvest comes from PSOF (44%) under H0-P0-S (Fig. 4c). While with H40-P30-S applied IMPs (45%) account for the major part of the harvest (Fig. 5c). In both cases of H40-P30-S and H0-P0-S the harvests from PSOF are similar, mainly varying from 5 to 30 mm3.
While under H40-P30-S the harvest from IMP is much higher than that under H0-P0-S. Compared with the harvest from IMP in H0-P0-S, which changes from 0 to 31 mm3, the harvest from IMP in H40-P30-S changes
from 20 to 47 mm3. For the total 204 years, the
per-centages of the years with a harvest larger than 20 mm3 are 79% and 25% for H40-P30-S and H0-P0-S respec-tively. According to Goetzl (1998) the current average IMP rate should be between 25% and 50%, which would assure sustainable wood supply in Georgia even under an increased harvest scenario (Fig. 1). The fact that 66% of the years had a harvestable volume of IMP between 20 and 40 mm3under H40-P30-S suggests that with an
as-sumption that 30% of newly regenerated stands would convert to IMP, the sustainable harvest level could rise beyond 59.5 mm3/yr, i.e., 40% more than the current
harvest level by 2050, and then hold constant (Fig. 5b).
Figure 7: Harvests used in OPTIONS and projected by SRTS model.
by ownership, 75% by 2040 for the forest industry and 37.5% for the non-industry private forest (NIPF), was considered in SRTS.
6.4 Future Directions and Related Studies A
meaningful sustainability analysis is an ongoing process. In fact, most analyses show that forest management in-tensities on pine plantations will be the key in determin-ing inventory, harvest and price levels for softwoods in the South in the future. To obtain better and more reli-able results the method of assigning acres of intensively managed plantations to records of the database need to be revised and possibly some differences in management as relates to physiographic regions should be introduced.
So far, the intensively managed pine plantations have been mainly concentrated on the forestland owned by forest industries. The NIPF owner does not yet apply the intensive management practices but may in the fu-ture (Goetzl 1998, Moffat et. al 1998). On the other hand, the dramatic land ownership change is currently in progress, i.e. Timberland Investment Management Organizations and Real Estate Investment Trust own-erships are taking industry stands. Will they main-tain/decrease/increase acres of IMP? To obtain better and more reliable results the ownership of the forested land needs to be considered since it causes significant differences in decisions on the future management and intensity of management.
Since pine pulpwood has such low value and paper-making capacity has been dramatically reduced in the South over the past few years, more emphasis is now placed on sawtimber production. For a complete un-derstanding of the impacts of rotation ages on forest re-sources sustainability, a type of rotation age much longer than those used here needs to be investigated.
Acknowledgements
We are grateful for helpful comments provided by the editor and three anonymous referees.
Literature Cited
Abt, R. C., F. W. Cubbage, and G. Pacheco. 2000. Southern forest resource assessment using the sub-regional timber supply (SRTS) model. For. Prod. J. 50 (4), 25–33.
Adams, D. M. and R. W. Haynes. 1996. The 1993 timber assessment market model: structure, pro-jections, and policy simulations. Gen. Tech. Rep. PNW–GTR–368. Portland, OR: USDA Forest Ser-vice Pacific Northwest Research Station. 58 p.
Adams, D. M. 2002. Solid wood products: rising con-sumption and imports, modest price growth. J. For., 100(2):14-19.
Ahn, S., A. J. Plantinga, and R. J. Alig. 2001. His-torical trends and projections of land use for the South-Central United States. Res. Pap. PNW-RP-530. Portland, OR: USDA Forest Service Pacific Northwest Research Station. 20 p.
Ahn, S., A. J. Plantinga, and R. J. Alig. 2002. Deter-minants and projections of land use for the South-Central United States. South. J. Appl. For.. 26(2):78–84.
Alig, R. J., J. R. Mills, and B. J. Butler. 2002. Pri-vate timberlands: growing demands, shrinking land base. Journal of Forestry. 100(2): 32–37.
Alig, R. J., A. J. Plantinga, S. Ahn, and J. D. Kline. 2003. Land use changes involving forestry in the United States: 1952 to 1997, with projections to 2050. Gen. Tech. Rep. PNW-GTR-587. Port-land, OR: USDA Forest Service Pacific Northwest Research Station. 92 p.
Alig, R. J. and B. J. Butler. 2004. Area changes for for-est cover types in the United States, 1952 to 1997, with projections to 2050. Gen. Tech. Rep. PNW-GTR-613. Portland, OR: USDA Forest Service Pa-cific Northwest Research Station. 106 p.
Borders, B. E. and R. L. Bailey. 2001. Loblolly pine - pushing the limits of growth. South. J. Appl. For.25(2): 1-6.
Borders, B. E., W. M. Harrison, Y. Zhang, B. D. Shiver, M. L. Clutter, C. J. Cieszewski, and R. F. Daniels. 2004. Growth and yield models for second rota-tion loblolly pine plantarota-tions in the piedmont/upper coastal plain and lower coastal plain of the South-eastern U.S. PMRC Tech. Rep. 2004. Planta-tion Management Research Cooperative. Daniel B. Warnell School of Forest Resources. University of Georgia. Athens, GA. 63p.
Cieszewski, C. J., M. Zasada, B. E. Borders, R. C. Lowe, J. Zawadzki, M. L. Clutter and R. F. Daniels. 2004. Spatially Explicit Sustainability Analysis of Long-term Fiber Supply in Georgia, USA. Forest Ecology and Management. 187(2-3): 349-359.
Cubbage F. W., J. P. Siry, R. C. Abt, D. N. Wear, and S. Moffat. 1998. Forest productivity and timber supply modeling in the South. In: Proceedings of conference “Improving Forest Productivity for Tim-ber. . . A Key to Sustainability” held in Duluth, MN, December 1-3, 1998.
Dangerfield, C. W. and W. H. Hubbard. 2001. Forestry Situation and Outlook In the U.S. South, 2001. Center For Forest Business. Warnell School of For-est Resources. Athens, GA. Research Note No. 7.
Daniels, R. F. 1999. Sustainability and forest indus-try: growing more wood than ever before. In: Proc. 1998 SAF Natl. Conv. Society of American Foresters, Bethesda, MD, USA. 75-80.
Goetzl, A. 1998. AF&PA southern forest management intensity survey: Data summary and survey results. Unpublished report. Washington, DC: American Forest and Paper Association.
Harrison W. M., and B. E. Borders. 1996. Yield Pre-diction and Growth Projection For Site-prepared Loblolly Pine Plantations in the Carolinas, Geor-gia, Alabama and Florida. PMRC Tech. Rep. 1996-1 Plantation Management Research Coopera-tive. Daniel B. Warnell School of Forest Resources. University of Georgia. Athens, GA. 64p.
Haynes, R. W., D. M. Adams, R. J. Alig, and oth-ers. 2001. Projections of the U.S. timber supply and demand situation to 2050: draft findings from the USDA Forest Service 2000 RPA Timber Assess-ment. Proceedings of the 2000 Society of Ameri-can Foresters national convention, Washington, DC, November 16-20, 2000. Bethesda, MD: Society of American Foresters, 2001: Pages 451-453.
Haynes, R. W. 2003. An analysis of the timber situa-tion in the United States: 1952 to 2050. Gen. Tech. Rep. PNW-GTR-560. Portland, OR: USDA Forest Service Pacific Northwest Research Station. 254p.
Joyce, L. A., and R. Birdsey. 2000. The impact of cli-mate change on America’s forests. Gen. Tech. Rep. RMRS-GTR-59. Fort Collins, CO: USDA Forest Service Rocky Mountain Research Station. 133p.
Liu, S., C. J. Cieszewski, R. C. Lowe, and M. Zasada. 2009. Sensitivity analysis on long-term fiber supply simulations in Georgia. South. J. Appl. For. 33:81-90.
Martin, S. W. and B. D. Shiver. 2002. Impacts of vegetation control, genetic improvement and their interaction on loblolly pine growth in the southern United States-age 12 results. South. J. Appl. For. 26:37-42.
Mills, J. R. and X. Zhou. 2003. Projecting national forest inventories for the 2000 RPA timber assess-ment. Gen. Tech. Rep. PNW-GTR-568. Port-land, OR: USDA Forest Service Pacific Northwest Research Station. 58p.
Moffat S., F. W. Cubbage, A. Cascio, and R. Sheffield. 1998. Estimations of future forest management in-tensity on NIPF lands in the South: Results of the Southern State Foresters’ Survey. Working Paper Series, SOFAC Report 14. Research Triangle Park, NC: Southern Forest Resource Assessment Consor-tium.
Prestemon, J. P. and R. C. Abt. 2002. Chapter 13 (TIMBR-1): Timber Products Supply and De-mand. In: The Southern Forest Assessment Fi-nal Technical Report. Gen. Tech. Rep. SRS-53. USDA Forest Service, Southern Research Station, Asheville, NC.
Riall, W. B. 2008. Economic Benefits of the Forestry Industry in Georgia: 2007. Report of the Georgia Tech Research Corporation, Atlanta, GA, prepared for the Georgia Forestry Commission.
Sedjo R. A. and D. Botkin. 1997. Using Forest Planta-tions to Spare Natural Forests. Environment. Vol. 39, Issue 10: 15-20, 30.
Smith, W. B., P. D. Miles, J. S. Vissage, and S. A. Pugh. 2004. Forest Resources of the United States, 2002. General Technical Report NC-241. St. Paul, MN: U.S. Dept. of Agriculture, Forest Service, North Central Forest Experiment Station.
SiMS. 2003. ForesTech International, LLC. http://www.forestech.us
Siry, J. P., F. W. Cubbage, and A. J. Malmquist. 2001. Potential impacts of increased management inten-sities on planted pine growth and yield and timber supply modeling in the South. Forest Prod. J. 51 (3): 42-48.
Siry, J. P. 2002. Chapter 14 (TIMBR-2): Intensive Timber Management Practices. In: The Southern Forest Assessment Final Technical Report. Gen. Tech. Rep. SRS-53. USDA Forest Service, South-ern Research Station, Asheville, NC.
Thompson M. T. 1998. Forest Statistics for Georgia, 1997. Resource Bulletin SRS-36. Asheville, NC: USDA Forest Service Southern Research Station. 92p.
USDA Forest Service. 2001. 2000 RPA Assessment of forest and range lands. Publication FS-687. Wash-ington, DC: U.S. Department of Agriculture, Forest Service. 78p.
Wear, D. N. and J. G. Greis. 2002a. Southern forest resource assessment: summary of findings. Journal of Forestry. 100(7): 6–15.
Wear, D. N. and J. G. Greis. 2002b. Southern forest resource assessment: summary report. Gen. Tech. Rep. SRS-54. Asheville, NC: USDA Forest Service Southern Research Station. 103p.