Received: April 21, 2019 Accepted: June 12, 2019
Derling Mendoza Velazco
(Corresponding author) Doctor in Education, Research Professor, National University of Education, Ecuador. E-mail: [email protected]
Website: https://orcid.org/0000-0001-8275-3687
Irma Abrigo Córdova Doctor in Accounting and Business Sciences, Research Professor, International University of Ecuador, Loja, Ecuador.
E-mail: [email protected]
Janela Romero Chávez Master in International Business and Foreign Trade Management, Professor, International University of Ecuador, Ecuador.
E-mail: [email protected]
Fredy Cueva Bravo Master of Business, Educational Research, International University of Ecuador, Ecuador.
E-mail: [email protected]
Magda Francisca Cejas Researcher and Teacher of the Department of Economic, Administrative and Trade Sciences, University of the Armed Forces (ESPE), Ecuador.
E-mail: [email protected]
ON PERCEPTION OF COMPUTER ALGEBRA
SYSTEMS AND MICROSOFT EXCEL BY
ENGINEERING STUDENTS
Natalia M. Mezhennaya, Oleg V. Pugachev Bauman Moscow State Technical University, Russia E-mail: [email protected], [email protected]
Abstract
This research presents the analysis of image of the popular program packages: CAS (Computer Algebra Systems) Matlab, Mathcad, Mathematica, and the spreadsheet ‘Microsoft Excel’ among students of engineering specializations studying in Bauman Moscow State Technical University (BMSTU). The research has explored perception of program packages by all students (N=164), and by male students (N=110) and female students (N=54) separately. Image of the program packages, convenience of their interfaces, usage scenarios, and applicability for solution of tasks of certain types have been explored via questioning the students. Moreover, the students assessed likelihood of using the programs in the future. It was established that all the program packages under consideration can be successfully used in the process of education, but some of them (Matlab and Mathematica) require additional lessons to learn their interface and peculiarities. Gender differences in perception of the program packages do not determine the education outcomes. The differences of perception of the programs are mainly caused by their popularity and the students’ skills of using certain programs. The following gender differences have been detected: in the female students’ sample, the programs Mathcad and Excel are leading, Matlab is performed a little worse; Matlab is associated with the statement “difficult / inconvenient interface”. In the male students’ sample, the three programs Matlab, Mathcad, and Microsoft Excel got nearly equal grades. Female students estimate future usage of Microsoft Excel higher than male students do. The CAS Mathematica takes the lowest places for both samples; as a possible cause of such result, it has been found that Mathematica is not widespread as compared to the other programs under consideration. Keywords: computer algebra system, education statistics, engineering education, mathematical education, Mathcad, Mathematica, Matlab, Microsoft Excel.
Introduction
Students in contemporary universities have to study in large and very heterogeneous
classes. Differences between students may grow quite substantial, due to short time of education (e.g., during completing master’s degree) and saturation of education programs. Hence it is necessary to elaborate teaching means purposed to eliminate these differences and adapted for students having trained up to different levels and having various motivation and interests. Moreover, one should design the teaching means to make them convenient for students’ independent work.
Vol. 77, No. 3, 2019
380 The basic reason why teaching of engineering disciplines is more expensive as compared
to other subjects, e.g., humanitarian disciplines, is the necessity of labs. Experiment analysis teaches the practical aspects of the course and gives students the experience of collecting and real-time analysis of empiric data. Nowadays the majority of education institutes use computer modeling instead of expensive maintaining of labs (Erokhin, Sadikova, Zhdankina, Korzhuev, & Semenov, 2018).
One of possible didactic methods purposed to solve the stated problems is usage of specialized computer packages: programming languages (Peng et al., 2014); CAS – Computer Algebra Systems (Buteau, Jarvis, & Lavicza, 2014; Mezhennaya & Pugachev, 2018; Särvari, 2005); spreadsheets (Neuwirth, 1995; Haspekian, 2005; Ibrahim, 2009; Sanford, 2018); program packages for mobile devices (Harrison & Lee, 2018), e.g., GeoGebra (Albano & Dello Iacono, 2018; Jacinto & Carreira, 2017), Wolfram Alpha (Weisstein, 2014), etc.
The research (Buteau et al., 2014) has explored the attitude of the modern scientific society to CAS and established that STEM specialists (STEM – Science, Technology, Engineering, and Mathematics) regard CAS as an integral part of research methods of modern mathematics; therefore, one of the main drivers of penetration of CAS in education is their usage in future research work. Hereby the research (Buteau et al., 2014) has revealed that CAS are used in the education process mainly as a means of solving tasks, and quite rarely as a means of current and final control; the decision to use CAS and/or to use a certain type of CAS is mainly a teacher’s individual initiative. Many researchers describe the methods of penetration of CAS in the education process, see e.g. (Särvari, 2005). The didactic aspects of using CAS in teaching certain mathematical disciplines is the topic of discussion in (Mezhennaya & Pugachev, 2018; Vasilieva, 2011).
The research (Cretchley, Harman, Ellerton, & Fogarty, 2000) has dealt with university first year students’ attitude to usage of Matlab-based teaching means. The research has established that it is possible to overcome the difficulties of primary study of the interface and syntax system rather quickly. They have compared the students’ attitude to the Matlab-based teaching materials and the students’ skills in the beginning and in the end of a half-year term. They have found significant positive influence of penetration and usage of the education technique, due to the growth of the students’ interest in the process of education. Hereby they have detected certain gender differences in attitude to and usage of Matlab. In (Durán et al., 2007) the attitude of students of electro-technical specialization to Matlab-based materials has been researched, general positive influence of these materials on education outcomes and contentedness of students has been detected. The research (Barkatsas, Gialamas, & Orellana, 2016) has evaluated students’ attitude to education with using CAS in general; the results of the research demonstrate positive influence of using CAS on achieving education outcomes and satisfaction of students with the education process. Usage of CAS establishes the balance between the students’ assessment of their skill of computer-assisted or analytical task solution and the real level of their training in mathematics; this factor (Morán-Soto & Benson, 2018) increases the level of education outcomes.
Another advantage of CAS is the possibility to create interactive templates (Mezhennaya & Pugachev, 2018; Mezhennaya & Pugachev, 2019) used by both students and teachers, saving time of independent work, composition and renovation of task banks (Vlasova, Popov, & Pugachev, 2016), checking and discussing the tasks fulfilled. Moreover, due to CAS usage, students are active participants of the education process.
Vol. 77, No. 3, 2019
381
any student, it is difficult to provide a necessary level of mastering a certain program package in a large collective of students.
In order to overcome the difficulties described, it is possible to use teaching means based on spreadsheets, e.g. the widespread program package Microsoft Excel. Such packages installed in the majority of display rooms are accessible for students, and their basic usage is taught already in the last school years (Gorbacheva, Smirnova, & Potekhin, 2008). In (Beare, 1991) it was established that usage of Microsoft Excel-based teaching materials makes the education process problem-oriented and therefore leads to its general activation.
The research (Malone, Schunn, & Schuchardt, 2018) has established that education based on the use of spreadsheets should not be uniform for all students, it is necessary to consider their previous training levels. Namely, for students having lower level of primary computer training, education outcomes would be better if they study spreadsheets before studying mathematical subjects. In converse, for the students having trained with computers very well, one should hold both courses in parallel.
The research (Mezhennaya & Pugachev, 2018) has described a possible technique of using CAS in teaching the course of probability theory. The Mezhennaya & Pugachev have established that the demonstration materials created by teachers with usage of interactive templates in Wolfram Mathematica are well comprehensible for students; the education outcomes of the students taught with the CAS appeared significantly higher as compared to the students who had not used these supplementary materials. At the same time, students considered usage of the templates as quite difficult. There were two possible reasons: a) some students were not motivated to master and modify the template files suggested, b) the system Wolfram Mathematica was not widespread among engineering students. Hence it is necessary to carry out a research of students’ attitude to popular program packages, including the purpose to detect resemblances and differences between students whose native language is Russian and foreign students having learned Russian.
In elaboration of teaching materials, it is also necessary to consider possible gender differences of their apprehension and usage. In (Ivaniushina et al., 2016) gender differences in
learning a university course “Data analysis” have been researched; the Ivaniushina, Alexandrov, & Musabirov have noticed that men are more self-assured, but the difference of education outcomes of men and women is not statistically significant. The research (Tikhomirova, 2017) of spatial thinking of students with different levels of mathematical training has established that a respondent’s gender has practically no influence on the amount of correct answers.
On the other hand, gender differences in apprehension and usage of teaching materials are possible. For example, (Davidovitch & Yavich, 2018) have found gender differences in students’ perception of tablets used in education. Namely, male students attribute more weight to tablets in both cognitive and emotional aspects of their application.
The research (Zeldin & Pajares, 2000) has revealed that verbal influence and indirect experience were basic factors of women’s self-confidence to work in STEM-subjects; assumable importance of these sources of self-effectiveness can be stronger for women in men-oriented spheres than in other women’s activities.
Vol. 77, No. 3, 2019
382 The aim of the present research was to study popularity, perception and usage scenarios
(and possible gender differences in them) of several widespread program packages (Matlab, Mathcad, Mathematica, Microsoft Excel) among students. The research has included engineering students of the 3-rd and 4-th years completing bachelors’ degree and of the 1-st year completing master’s degree. All the students studied in Bauman Moscow state technical university (BMSTU). The first factor determining the choice of programs is the set of program packages installed in display rooms in the University; it is also important which of them teachers use in education in various specializations, and which licenses are available for students. The image of program packages was under research by questioning in two groups of male and female students. The results obtained have undergone analysis and comparison.
Research Methodology
General Background
The present research has dealt with popularity, perception and usage scenarios of several program packages often used in education: Matlab, Mathcad, Mathematica, and Microsoft Excel, among engineering students taught in BMSTU in the autumn term of the 2018-2019 year. Moreover, the researchers analyzed similarities and differences between male and female students. For this purpose, the researchers have carried out an anonymous questioning of the students, in order to clarify their attitude to the program packages mentioned. After that, they have proceeded a statistical analysis of the data obtained. The presented results can be useful for the choice of engineering students’ education strategies based on using one or several program packages. The research has included the data collected in December 2018, the statistical analysis has been carried out in January–March 2019.
Sample
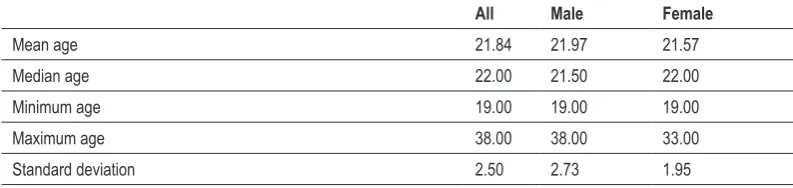
The researchers have questioned students taught in the faculty of Special Machine-building of BMSTU in the 3-rd and 4-th years completing bachelors’ degree and in the 1-st year completing master’s degree. All the students have studied in the autumn term in 2018. The group under research consisted of 164 students (110 male and 54 female students); each of them had used at least one of the program packages Matlab, Mathcad, Mathematica, or Microsoft Excel during their study (in audience or in independent work). The research included the questioning during the first two weeks of December 2018. Table 1 presents the demographical data of the sample. Figure 1 shows the histogram of age distribution in each group.
Table 1. Demographical data of the whole sample and of male and female samples separately.
All Male Female
Mean age 21.84 21.97 21.57
Median age 22.00 21.50 22.00
Minimum age 19.00 19.00 19.00
Maximum age 38.00 38.00 33.00
Vol. 77, No. 3, 2019
383
Figure 1. Proportions of the students of each age category of male and female.
Of the total amount of 250 questionnaires, 182 came back. The data of 164 questionnaires satisfying the given criterion have undergone statistical analysis.
Instruments and Procedures
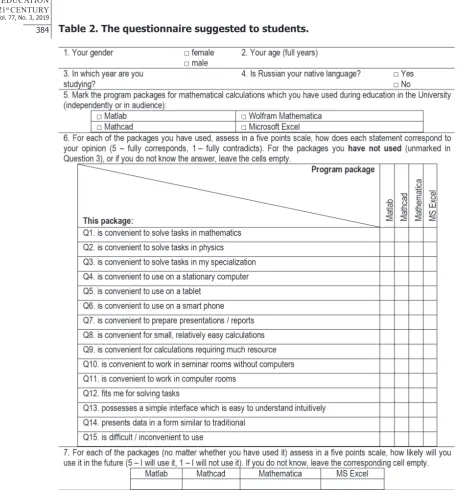
The questionnaire shown in Table 2 was used as a research tool. The questionnaire included the standard demographical block and several special questions about the usage of computer programs in education. The special questions included the block (Question 5) asking which program packages the student had used in education and the block about their usage scenarios (Question 6). The questionnaire suggested the students to assess convenience of using each of the packages for the following purposes:
a) Solution of tasks in mathematics, physics, and special subjects. b) Preparing presentations.
c) Using on mobile devices (smart phones and tablets).
d) Using in display rooms (or rooms equipped with stationary computers) and in ordinary
lecture halls and seminar rooms.
e) Interface friendliness and applicability of the program packages for solving problems requiring much resource.
Vol. 77, No. 3, 2019
384 Table 2. The questionnaire suggested to students.
An anonymous survey of students with special questionnaires described in detail further was carried out. If a student has used no one of the program packages, the research excluded his/her questionnaire.
Vol. 77, No. 3, 2019
385
Data Analysis
The filled questionnaires were carefully processed and checked whether the students had filled them correctly. Questions 1-4 should be answered and contain no empty items; Question 5 should contain at least one mark; Question 6 should be filled only in concern with the program packages mentioned in Question 5, so it might contain empty cells. The answer to Question 7 was independent on the previous questions and could contain empty cells too. The questionnaires not satisfying at least one of the demands listed have been excluded from the
research.
The standard methods of statistical analysis (descriptive methods of statistics, analysis of contingency tables, correspondence analysis) have been applied to the sample of 164 questionnaires. The programs Statistica 12.0, Mathematica 11.3, and Microsoft Excel 2016 were used in the analysis.
Research Results
Usage of the Programs
Table 3 shows the percentage of students having used each of the packages, and the p-values calculated from comparison of the proportions in the two groups.
Table 3. Percentages of students having used each of the program packages, for the groups of male and female students, and the corresponding p-values calculated for the difference between the two proportions (in the corresponding column).
Matlab Mathcad Mathematica MS Excel Total
Male 78.18 88.18 19.09 90.91 110
Female 59.26 81.48 27.78 90.74 54
p-value .0113 .2456 .2064 .9717
Table 3 shows that the most popular among both male and female students is MS Excel. The second is Mathcad and the third is Matlab. The CAS Mathematica was the least popular.
To the researchers’ opinion, the possible reasons why almost all students of both genders used Microsoft Excel are the following:
a) It is widespread.
b) The education program includes many tasks, which students cannot solve without using a personal computer. For their solution teachers often choose Microsoft Excel as the most simple and acceptable software.
c) Usually it is not required to install Microsoft Excel specially, since it is presented in the majority of display rooms; moreover, it is compatible with other freeware spreadsheets which students can use in their independent work.
d) The basis of working with Microsoft Excel has been taught in many schools. The package Mathcad is not far behind Microsoft Excel.
The research has revealed a significant (at level 5%) difference only in the percentages of male and female students using Matlab. The ratio between the percentages of male and female students using this package is approximately 4 to 3.
Vol. 77, No. 3, 2019
386 In order to analyze possible gender differences in perception of the program packages
and their usage scenarios, the researchers have performed further statistical analysis. For this purpose, for each program package and each statement in Question 6, the quantities of students having marked 4 or 5 (meaning that they agreed with the statement) in the groups of male and female students were calculated.
The next subsection presents the classical correspondence analysis of the data (Greenacre, 1984), used as exploratory method for determining possible gender differences and common students’ attitude to the program packages.
Correspondence Analysis for Groups of Male and Female Students
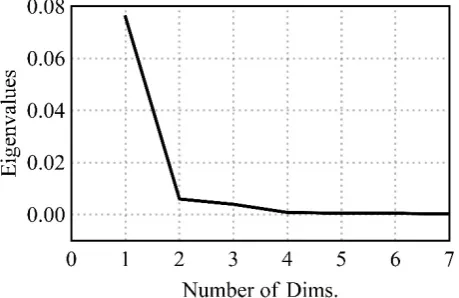
The correspondence analysis begins with analyzing the graph of eigenvalues shown in
Figure 2.
Figure 2. Graph of eigenvalues; percentage of inertia in axes: axis 1 – 86.36%; axis 2 – 6.81%; axis 3 – 4.49%; axis 4 – .91%; axis 5 – .60%, axis 6 – .55%, axis 7 – .26%.
Vol. 77, No. 3, 2019
387
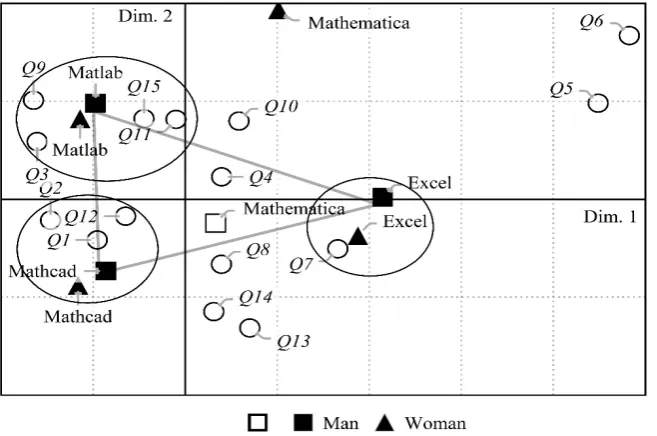
Figure 3. The correspondence map for male (square marks) and female (triangle marks) samples.
The round marks denote the statements of Question 6; the quality of projection onto the plane is ≥ .5 for all points. The marks corresponding to the program packages are squares for the male sample and triangles for the female sample. Unsatisfactory quality of projection (< .5) appears only for the point corresponding to Mathematica in the male sample; hence, its mark is not fully colored.
For all the statements Q1–Q15 from Question 6, the quality of projection onto the plane appeared good: ≥ .52 for the points Q10, Q11, and Q15; ≥ .79 for the points Q4, Q7, and Q14; ≥ .85 for the rest points. For all the program packages (except for Mathematica in the group of men), the quality of projection appeared good as well: .53 for Mathematica in the female sample; ≥ .90 for the rest points. The map in Figure 3 explains 93.17% of dispersion of the points. Hence, the map presents the situation of the points in the original 7-dimensional space quite exactly. The present research will not include the position of the point corresponding to
Mathematica in the male sample.
One can remark an interesting fact: the positions of points corresponding to Matlab, Mathcad, and Microsoft Excel, are practically the same in both male and female samples. Therefore, attitude to these program packages is mainly the same, and hence the outcomes of education with methods using one or several program packages would have assumedly no significant gender differences.
Let us proceed to a more detailed analysis of the map. The positions of points for Matlab, Mathcad, and Microsoft Excel form a triangle (marked with gray lines on the map). Hence, these program packages oppose to each other in certain parameters. For Mathcad and Matlab, this is a surprise. Microsoft Excel is more associated with usage on mobile devices (the statements Q5 and Q6) than any other CAS. This is also unexpected, because there is a free mobile version of Matlab with an interface analogous to the desktop version of the program. Therefore, either students are not aware of this, or they regard the mobile version as non-convenient. This fact requires additional data collection and research.
Vol. 77, No. 3, 2019
388 usage of programs on tablets and smart phones. The statements Q13, Q14 (downside), and Q6
(upside) load the axis Dim.2.
The program packages and the statements on the map Figure 3 form three clusters marked with black lines. The first cluster consists of the points corresponding to Microsoft Excel in both groups and the statement Q7. Such situation is natural since the program contains a large amount of inbuilt functions for convenient visualization of data. However, each CAS possesses such kind of functions. Hence, there are two possible reasons (or combination of both reasons) of the phenomenon observed: either the students are not sufficiently trained to use graphical possibilities of the CAS’s under consideration, or students regard the interface of Microsoft Excel, which does not require to write a script, as more convenient. The linkage between the program package and the statement is stronger in the group of women.
The points corresponding to the CAS Mathcad in both groups, and the statements Q1, Q2, and Q12, form the second cluster. It has turned out that Mathcad is more convenient for solving tasks in mathematics and physics, and even general engineering tasks, than any other program package. There are two possible reasons of such perception: a) the education program of a part of the students contained compulsory subjects including usage of Mathcad; b) peculiarities of the program interface of Mathcad. The male sample has shown a stronger linkage between the program package and the statements.
The points of the third cluster correspond to the CAS Matlab for both samples and the statements Q3, Q9, and Q15. Students regard the CAS Matlab as suitable to solve engineering tasks including those demanding computation, but the interface of Matlab is difficult or not convenient. For the last opinion, a possible reason is the lack of knowledge of the program package in whole. Students’ attitude to Matlab is positive in general, but in order to use it in education successfully, a stronger training in its interface and language is necessary. The map indicates no gender differences in apprehension of Matlab.
The CAS Mathematica in the female group stands aside from other program packages and statements. One of possible causes is small propagation of the program among engineering students, and small amount of its usage does not allow estimating its convenience.
The statements Q8, Q13, and Q14 equally associate with Microsoft Excel and Mathcad. As to convenience of usage in seminar rooms without computers (the statement Q10), the students did not prefer any one of the program packages. Therefore, the research has revealed that usage of mobile versions of the program packages was not widespread among the students taking part in the survey.
Analysis of Future Usage of Program Packages
In order to estimate general experience of the program packages, let us proceed to analyze students’ plans of their future usage of programs and consider male and female samples side by side with the whole sample. One would expect that the students having used one of the programs would estimate it to be better than the other ones. The following research indicates whether it is true.
The CAS Mathematica has appeared worse than the other program packages; it has received the average mark 2.44 from the male students and 2.51 from the female students (in a 5-points scale). Even those who have used Mathematica estimate its reusability by 3.29 (men) and 3.15 (women). The CAS Mathematica has appeared unsatisfactory, hence the analysis of only three other program packages is considered in this section.
Vol. 77, No. 3, 2019
389
Figure 4. Average grades of reusability of each program package by male (square marks) and female (triangle marks) students for the whole sample, and for the samples of users of each program.
The estimates calculated from the whole sample are slightly different for male and female students. The average estimate given by male students is nearly the same for all programs, whereas female students estimated Matlab worse than the other programs, but average estimates of Mathcad and MS Excel by female students are higher.
The male Matlab users expectedly considered Matlab as the best for future use, the next were Mathcad and Excel. Conversely, the female students who had used Matlab estimated its future usage lower than other programs. Hence, women regarded this program package as less convenient than the other ones. However, the average estimate of Matlab was quite high. This phenomenon can be explained by women’s lack of knowledge of this program and peculiarity of the tasks they had considered during education. It is interesting to note that, whatever program package had female students used, they considered Matlab as less reusable than Mathcad and Excel.
The male users of Mathcad and Excel gave almost equal average grades of reusability to all the three program packages, although both groups estimated Mathcad slightly higher. Hence, the possibilities of MS Excel in some tasks are not sufficient. Generally, male students in all groups, except the Excel users, estimate Excel as weaker than other programs. In the corresponding samples of women, the situation was different: the estimates differ from each other. The female Mathcad users estimated future reference of Mathcad higher than other programs, this result was expectable. The situation for the female students having used Microsoft Excel is analogous: they gave the highest grade to Microsoft Excel.
The Mathematica users of both genders surprisingly estimate future reference of this program package lower than usage of the other ones. A possible reason is that engineering students study the CAS Mathematica only in their free will in their independent work, since their education program contains no compulsory courses including usage of Mathematica.
For quantitative analysis of differences of estimates in the samples under consideration, Mann–Whitney U-test was applied. There was significant difference at the level 5% between the estimates given to Mathcad by female and male Mathcad users (Z-statistic = -2.23; p-value
Vol. 77, No. 3, 2019
390 by the Matlab users of different genders (Z-statistic= -1.65; p-value = .0998), between the
estimates of Microsoft Excel between male and female students in the whole sample (Z-statistic
= -1.75; p-value = .0796), and among Microsoft Excel users (Z-statistic = -1.95; p-value =
.0515).
To sum up, in the female students sample the programs Mathcad and Excel are leading, Matlab is performed a little worse. As noted in the previous subsection, Matlab is associated with the statement Q15 “difficult / inconvenient interface”. In the male sample, the three programs got nearly equal grades. Female students estimate future reference of Microsoft Excel
higher than male students do.
Discussion
The students were suggested to assess several program packages with the following respects: solution of tasks in mathematics, physics, and special subjects; preparing presentations; usage on mobile devices and in display rooms; and interface friendliness. The last question asked which program packages the students were going to use in the future.
The main purpose of this research was to answer the following three questions:
1) With respect to Microsoft Excel: Is it the most popular? What is the students’ attitude to its usage for solution of tasks concerned with teaching STEM-subjects?
2) With respect to the CAS Matlab, Mathcad, and Mathematica: Are there differences in comprehension of these CAS (by all students or by males/females separately)? Which of the CAS are more suitable for teaching students in large heterogeneous classes?
3) With respect to the programs adapted for mobile devices: Do the students prefer them to desktop program packages?
MS Excel appeared the most popular among both male and female students (91%). The second was Mathcad (used by 88% of male and 81% of female students) and the third was Matlab (78% and 59%, respectively). The CAS Mathematica was the least popular; only 19% of male and 28% of female students used it. Almost all students of both genders use Microsoft Excel since it is widespread (it is presented in the majority of display rooms), it is the most simple and acceptable software for solution of students’ tasks, and the basis of working with Microsoft Excel has been taught in many schools (Beare, 1991), (Gorbacheva et al., 2008). This confirms the conclusion made in (Broley et al., 2018) about significant segmentation of students with respect to the choice of CAS and levels of mastering them. In the same time, the situation with Microsoft Excel is the reverse; the results obtained agree with the research (Mezhennaya, 2019) which has established that Microsoft Excel could be used in teaching engineering students from the beginning of the University course, without assigning additional lessons for its learning.
Microsoft Excel is more associated with the usage on mobile devices than any CAS, although there exists, e.g., a free mobile version of Matlab with an interface analogous to its desktop version. Therefore, either students are not aware of this, or they regard the mobile version as non-convenient. This fact requires additional data collection and research.
Thus, a surprising result is established: students of both genders do not choose aps for their convenience for using on mobile devices but choose them for convenience of task solution. This situation can be partially explained by the fact that mobile versions of the programs do not work well enough for solution of complicated engineering tasks.
Vol. 77, No. 3, 2019
391
programming skills, or they are strictly segmented in languages used (Broley et al., 2018).
Moreover, the programming languages are not always adapted to solution of mathematical
tasks. In the other hand, there are a lot of languages elaborated for teaching mathematics (e.g., Logo (Hoyles & Sutherland, 1989), Scratch (Swanier, Seals, & Billionniere, 2009), etc.), but their usage in large classes without assigning supplementary lessons for learning them would lead to much difficulties. Therefore, often it is necessary to penetrate more popular CAS into education. Besides, this is a necessary factor of students’ competition within their future work (Buteau et al., 2014).
Proceed to the CAS considered in this research. It has turned out that Mathcad is more
convenient for solving tasks in mathematics and physics, and general engineering tasks as well, than any other program package. There are two possible reasons: the education program of a part of the students had contained compulsory subjects including usage of Mathcad; some peculiarities of the program interface of Mathcad are more convenient.
Students regard Matlab as suitable for solution of engineering tasks including those demanding computation (Cretchley et al., 2000), but the interface of Matlab is difficult or not convenient. For the last opinion, a possible reason is the lack of knowledge of the program package in whole. In order to use Matlab in education successfully, a stronger training in its interface and language is necessary.
The CAS Mathematica stands aside from other program packages. One of possible causes is the scarce propagation of this program among engineering students. This does not allow estimating its convenience.
The research has revealed a significant difference in the percentages of male and female students using Matlab, certain gender differences in usage of Matlab were detected already by (Cretchley et al., 2000). The ratio between the percentages of male and female students using this package is approximately 4 to 3. With respect to CAS Mathematica, the situation is the opposite. Female students use it more frequently than male students (the ratio of the shares is about 3 to 2).
It should be remarked that the attitude to Matlab, Mathcad, and Microsoft Excel by male and female students is practically the same. Hence, the outcomes of education with methods using one or several program packages would have assumedly no significant gender differences. This agrees with the results (Ivaniushina et al., 2016), (Tikhomirova, 2017), where no gender differences in education outcomes were detected either. However, there are possible gender differences in the cognitive and emotional aspects of apprehension of these programs (analogous to those detected with respect to tablets in (Davidovitch & Yavich, 2018)), which were not considered in this research. Hence, it is necessary to carry out an additional research, in order to find such differences, and to use them effectively in designing new teaching materials, especially for independent work.
In order to estimate general experience of the program packages, the researchers have analyzed students’ plans of their future reference. Expectedly, the students having used one of the programs would estimate it higher than other ones, except CAS Mathematica. A possible reason is that engineering students study the CAS Mathematica only in their free will, since their education program contains no compulsory courses including usage of Mathematica.
To sum up, in the female students sample the programs Mathcad and Excel are leading, Matlab is performed a little worse. Matlab is associated with the statement “it is difficult / has inconvenient interface”. In the male sample, the three programs got nearly equal grades. Female students estimate future usage of Microsoft Excel higher than male students do.
Vol. 77, No. 3, 2019
392 choice of the program package to use in composing teaching materials ought to be considered,
which of the program packages had the students learned earlier. If the university education did not include the courses of program packages, then the teacher has no basis to choose one of another system. Therefore, it is necessary to elaborate the most flexible teaching materials, which would be possible to adapt to any platform.
In concern with modern engineering problems and scientific research methods (Buteau et al., 2014) it is necessary to penetrate CAS since the first half-year term of education. Hereby, the education program should not be oriented on a certain program package, but on studying the basic principles of work with such systems. Students should understand that the choice of a program package for solution is often determined by other factors than the student’s will (the tasks to solve, equipment available, the instructor’s decision, etc.). Moreover, in the future engineering practice they have to adapt quickly to any system. The purpose of education is to train students to use almost any CAS. One of the methods is usage of interactive templates (Mezhennaya & Pugachev, 2018) prepared by the teachers and used in students’ independent work. In the future practice, students can either receive analogous templates in their firms or find suitable solutions in Internet independently.
Another possible strategy of education is endowing the students with the right to choose a certain program package. Hereby it is necessary to consider the increase of teachers’ work and the necessity to explain the students the criteria of choice of suitable program packages (Harrison & Lee, 2018). For example, many students use various on-line calculators providing sufficient accuracy of solution of simple tasks, e.g., systems of linear equations with few variables, but such tools are not suitable for calculations requiring much resource.
In the present research, it was not explored what reasons induce students to choose a certain program package. There are several possible reasons: friends’ advice, a teacher’s instruction, availability of a license, usage in the work. For example, in (Buteau et al., 2014) it was found that the choice of a certain program package is often determined by the teacher’s decision depending on his/her personal preference and on availability of technical possibilities. The question of students’ choice of program packages requires a new research.
Another interesting problem is the linkage between using the program packages by junior and major students. In the present research, this question was not explored since there were too few students having long interruption in education. But since many major students are employed on jobs requiring usage of certain program packages chosen without the students’ opinion, the differences between the first-year and the major students can be significant. It is worth to conduct an additional research, in order to establish the basic factors influencing the choice of program packages to learn.
In the sample of students taking part in the survey, there were 29 foreign students. They had a different situation depending on previous experience. They had an additional difficulty in studying programming in Russian, side by side with difficulty of programming itself. Hence it is necessary to proceed to the research of possible difficulties concerned with teaching foreign students, and to consider possible difficulties of spreading program packages between Russian-speaking and foreign students.
Vol. 77, No. 3, 2019
393
Conclusions
The present research deals with popularity, perception and usage scenarios of several program packages often used in education: Matlab, Mathcad, Mathematica, and Microsoft Excel, among engineering students of Bauman Moscow State Technical University in the autumn term of the 2018-2019 year. Hereby possible gender differences in the aforementioned respects were analyzed. It has been found that almost all of the systems considered can be successfully used in education, but some of them (Matlab and Mathematica) require additional lessons to learn their interface and peculiarities. Gender differences in perception of the program packages do not determine the education outcomes. The differences of perception of the programs are mainly caused by their popularity and the students’ skills of using certain program packages.
The results presented indicate that, in the choice of strategies of computer-assisted education, the teachers ought to consider the students’ previous experience of mastering certain program packages, and the education purposes stated. Often sharp segmentation of students causes the necessity to assign supplementary lessons for learning a certain type of CAS. The present research has established the peculiarities of apprehension of program packages (in both male and female groups) which can be used by other researchers and teachers during elaboration of teaching materials, taking gender structure of the groups of students, their previous experience, and education purposes into account.
Acknowledgements
The researchers are grateful to Markelov G.E. for his help in collecting the statistical data, and to all the students of BMSTU who have taken part in the survey.
References
Albano, G., & Dello Iacono, U. J. (2018). GeoGebra in e-learning environments: a possible integration in mathematics and beyond. Journal of Ambient Intelligence and Humanized Computing, 9 (1), 1-13. doi: 10.1007/s12652-018-1111-x.
Barba, P. G., Kennedy, G. E., & Ainley, M. D. (2016). The role of students’ motivation and participation in predicting performance in a MOOC. Journal of Computer Assisted Learning, 32 (3), 218-231. doi: 10.1111/ jcal.12130.
Barkatsas, T., Gialamas, V., & Orellana, C. (2016). Secondary students’ attitudes toward learning mathematics with computer algebra systems (CAS). In: Barkatsas T., Bertram A. (Eds.), Global Learning in the 21st Century. Global Education in the 21st Century Series. SensePublishers, Rotterdam. doi: 10.1007/978-94-6300-761-0_8.
Beare, R. (1991). A system to exploit the spreadsheet ‘Excel’ for enhancing learning in science. Research in Science Education, 21 (1), 20-29. doi: 10.1007/BF02360453.
Broley, L., Caron, F., & Saint-Aubin, Y. (2018). Levels of programming in mathematical research and university mathematics education. International Journal of Research in Undergraduate Mathematics Education, 4 (1), 38-55. doi: 10.1007/s40753-017-0066-1.
Buteau, C., Jarvis, D. H., & Lavicza, Z. (2014). On the integration of computer algebra systems (CAS) by Canadian mathematicians: Results of a national survey. Canadian Journal of Science, Mathematics and Technology Education, 14 (1), 35-57. doi: 10.1080/14926156.2014.874614.
Cretchley, P., Harman, C., Ellerton, N., & Fogarty, G. (2000). MATLAB in early undergraduate mathematics: An investigation into the effects of scientific software on learning. Mathematics Education Research Journal, 12 (3), 219-233. doi: 10.1007/BF03217086.
Vol. 77, No. 3, 2019
394 Davidovitch, N., & Yavich, R. (2018). The impact of mobile tablet use on students’ perception of learning
processes. Problems of Education in the 21st Century, 76 (1), 29-42.
Durán, M. J., Gallardo, S., Toral, S. L., Martínez-Torres, R., & Barrero, F. J. (2007). A learning methodology using Matlab/Simulink for undergraduate electrical engineering courses attending to learner satisfaction outcomes. International Journal of Technology and Design Education, 17 (1), 55-73. doi: 10.1007/s10798-006-9007-z.
Erokhin, S. V., Sadikova, A. R., Zhdankina, J. S., Korzhuev, A. V., & Semenov, S. V. (2018). Moodle e-learning platform as a resource for improving the quality of technical education. Novosibirsk State Pedagogical University Bulletin, 6, 138-154. doi: 10.15293/2226-3365.1806.09.
Gorbacheva, A. N., Smirnova, A. N., & Potekhin, N. V. (2008). Solution of tasks for modeling in Microsoft Excel. Informatics and Education, 3, 34-40.
Greenacre, M. J. (1984). Theory and applications of correspondence analysis. Academic Press, London. Harrison, T. R., & Lee, H. S. (2018). iPads in the mathematics classroom: Developing criteria for
selecting appropriate learning apps. International Journal of Education in Mathematics, Science and Technology (IJEMST), 6 (2), 155-172. doi:10.18404/ijemst.408939.
Haspekian, M. (2005). An “Instrumental Approach” to study the integration of a computer tool into mathematics teaching: the Case of spreadsheets. International Journal of Computers for Mathematical Learning, 10 (2), 109-141. doi: 10.1007/s10758-005-0395-z.
Hoyles, C., & Sutherland, R. (1989). Logo mathematics in the classroom. New York, NY: Routledge. Ibrahim, D. (2009). Using the Excel spreadsheet in teaching science subjects. Procedia – Social and
Behavioral Sciences, 1 (1), 309-312. doi: 10.1016/j.sbspro.2009.01.058.
Ivaniushina, V. A., Alexandrov, D. A., & Musabirov, I. L. (2016). The structure of students’ motivation: Expectancies and values in taking data science course. Educational Studies Moscow, 4, 229–250. doi: 10.17323/1814-9545-2016-4-229-250.
Jacinto, H., & Carreira, S. (2017). Mathematical problem solving with technology: The Techno-mathematical fluency of a student-with-GeoGebra. International Journal of Science and Mathematics Education, 15 (6), 1115-1136. doi: 10.1007/s10763-016-9728-8.
Kalyar, M. N., Ahmad, B., & Kalyar, H. (2018). Does the teacher’s motivation influence the student’s motivation? The mediating role of a teacher’s professional behavior. Educational Studies Moscow, 3, 91-119. doi: 10.17323/1814-9545-2018-3-91-119.
Malone, K. L., Schunn, C. D., & Schuchardt, A. M. (2018). Improving conceptual understanding and representation skills through Excel-based modeling. Journal of Science Education and Technology, 27 (1), 30-44. doi: 10.1007/s10956-017-9706-0
Mezhennaya, N. M. (2019). On the perception of the ‘Microsoft Excel’ software program by engineering students. Science for Education Today, 9 (2), 140-155. doi: 10.15293/2658-6762.1902.10. Mezhennaya, N. M., & Pugachev, O. V. (2018). On the results of using interactive education methods in
teaching Probability Theory. Problems of Education in the 21st Century, 76 (5), 678-692. Mezhennaya, N. M., & Pugachev, O. V. (2019). Advantages of using the CAS Mathematica in a study of
supplementary chapters of Probability Theory. European Journal of Contemporary Education, 8 (1), 4-24. doi: 10.13187/ejced.2019.1.4.
Morán-Soto, G., & Benson, L. (2018). Relationship of mathematics self-efficacy and competence with behaviors and attitudes of engineering students with poor mathematics preparation. International Journal of Education in Mathematics, Science and Technology (IJEMST), 6 (3), 200-220. doi: 10.18404/ijemst.428165.
Neuwirth, E. (1995). Visualizing formal and structural relationships with spreadsheets. In: diSessa A.
A., Hoyles C., Noss R., Edwards L. D. (eds) Computers and Exploratory Learning. NATO ASI
Series (Series F: Computer and Systems Sciences), vol 146. Springer, Berlin, Heidelberg. doi: 10.1007/978-3-642-57799-4_9.
Ozan, C., Gundoglu, K., Bay, E., & Celkan, H. Y. (2012). A study on the university students’ self-regulated learning strategies skills and self-efficacy perceptions in terms of different variables. Procedia – Social and Behavioral Sciences, 46, 1806-1811. doi: 10.1016/j.sbspro.2012.05.383.
Vol. 77, No. 3, 2019
395
Sanford, J. (2018). Introducing computational thinking through spreadsheets. In: Khine M. (eds) Computational Thinking in the STEM Disciplines. Springer, Cham. doi: 10.1007/978-3-319-93566-9_6.
Särvari, C. (2005). CAS integration into learning environment. ZDM, 37 (5), 418-423. doi: 10.1007/ s11858-005-0031-3
Swanier, C., Seals, C., & Billionniere, E. (2009). Visual programming: A programming tool for increasing mathematics achievement. iManager’s Journal of Educational Technology, 6 (2), 1-5. doi: 10.26634/jet.6.2.784.
Tikhomirova, T. (2017). Spatial thinking and memory in Russian high school students with different levels of mathematical fluency. Procedia – Social and Behavioral Sciences, 237, 1260-1264. Vasilieva, L. N. (2011). Using Matlab package in the course of studying differential equations. Pedagogical
Informatics, 4, 67-73.
Vlasova, E. A., Popov, V. S., & Pugachev, O. V. (2016). Creating the fund of assessment tools in the study of linear algebra with using MATLAB. Bulletin of Moscow Region State University. Series: Physics and Mathematics, 4, 77-85. doi: 10.18384/2310-7251-2016-4-77-85.
Weisstein, E. (2014). Computable data, Mathematics, and digital libraries in Mathematica and Wolfram Alpha. In: Watt S. M., Davenport J. H., Sexton A. P., Sojka P., Urban J. (Eds.), Intelligent computer mathematics. Lecture notes in computer science, vol 8543. Springer, Cham. doi: 10.1007/978-3-319-08434-3_3.
Zeldin, A. L., & Pajares, F. (2000). Against the odds: Self-efficacy beliefs of women in mathematical, scientific, and technological careers. American Educational Research Journal, 37 (1), 215-246. doi: 10.3102/00028312037001215
Zhan, Z., Fong, P., Mei, H., & Liang, T. (2015). Effects of gender grouping on students’ group performance, individual achievements and attitudes in computer-supported collaborative learning. Computers in Human Behavior, 4, 587-596. doi: 10.1016/j.chb.2015.02.038.
Received: February 27, 2019 Accepted: June14, 2019
Natalia M. Mezhennaya
(Corresponding author) Candidate of Physics and Mathematics, Associate Professor, Department of Applied Mathematics, Bauman Moscow State Technical University, 2-nd Baumanskaya Street, 5, Moscow 105005, Russian Federation.
E-mail: [email protected] ORCID iD: 0000-0003-1426-3613
Oleg V. Pugachev Doctor of Physics and Mathematics, Professor, Department of Applied Mathematics, Bauman Moscow State Technical University, 2-nd Baumanskaya st., 5, Moscow 105005, Russian Federation.