Evaluation of the resistance of trussed slabs with steel formwork in
cold formed U profile
Lucas Fadini Favaratoa*
Adenilcia Fernanda G. Calenzania
Juliana C. Vianna Piresa
Elisabeth Jungesa
Johann A. Ferraretob
a Departamento de Engenharia Civil, Universidade Federal do Espírito Santo, Vitória, Espirito Santo, Brasil. E-mail: [email protected], [email protected], [email protected], [email protected] b ArcelorMittal, Serra, Espirito Santo, Brasil. E-mail: [email protected]
*Corresponding author
http://dx.doi.org/10.1590/1679-78255304
Abstract
In the last decades, the modernization in structural engineering has increased the use of steel-concrete composite and hybrid systems for slabs, when the adherence in the interface of the materials is present or not, respectively. In addition to the traditional steel deck, a similar solution for precast trussed slabs has been used for small constructions, in which a cold formed U profile acts as steel formwork before the concrete curing, resisting to self-weight of the concrete and to the construction overload. After this period, the steel profile gets incorporated to the concrete element, allowing the composite behavior of the structure, system that usually goes without additional reinforcements. This slab includes, besides concrete, a light filling material between ribs, cold formed profiles and the trussed reinforcement. Once this technology has just arrived to the construction market, there is a gap of knowledge related to its design procedure. In this context, this study aims to present a methodology to analyze the limit-states that govern the design of these slabs. A computational tool was developed to evaluate the resistance through data entry related to geometry, service loads and materials, which grants to conduct a parametric study with pre-defined geometries to obtain, as result, spans and loads. Conclusions about the maximum span without shoring and general data are also discussed.
Keywords
Steel-concrete composite slabs, trussed slabs, cold formed U profile, design procedure.
1 INTRODUCTION
Since the beginning of XX century, the design solutions based on steel and steel-concrete composite structures have gained technical and economic competitiveness when compared to common design solutions, as pure reinforced concrete. According to Carvalho et al. (2014), this is owed to several factors, as steel lightness, simple and quick structural assembly and to the quality of the final product.
(2015) also states that the major advantage in the use of this structural technology is related to the fabrication process: thin plates, with small resistance in its original shape, are stiffened where buckling can occur. Hence, the folding procedure changes steel original mechanical properties, leading to highest yield and ultimate strengths. Otherwise, residual stresses may come up, reducing the ductility of the material.
Whereas rolled and welded steel profiles are more suitable for medium and large constructions, cold-formed ones are commonly used in small and medium constructions to compose roof structures, composite slabs and beams, mezzanines, popular houses, small warehouses and up-to-four-storey buildings. In addition, many cross sections are available for design, as C, Z, L and hat, doubled or not, stiffened or not (Silva et al., 2014).
One important application of cold formed steel profiles in structural engineering, as presented previously, is in composite slabs. It gets incorporated to concrete after curing, allowing the composite behavior, and works as reinforcement, usually sparing additional ones. Besides, it’s necessary to verify the structural safety before concrete curing, in which the steel formwork acts as a single steel beam and must resist to all ultimate limit states that can occur in construction stage. It’s also important to state that in the composite phase the ultimate limit state which governs the design is the longitudinal shear in the interface of the materials, causing slipping in that region.
In the literature there are numerous articles that present design procedures for composite slabs, including numerical and experimental analyses. Takey (2001) has evaluated the resistance of composite slabs with ribs filled with light material, the same of that used in precast concrete slabs. In a first moment, the optimum geometry of the profile has been determined for three different thicknesses (1.52, 2.00 and 3.00 mm) and then full-scale tests were conducted to assess the ultimate limits and the longitudinal shear resistance as well. The results were satisfactory and the research concluded that this system for slabs is competitive. Vianna (2005) proposed a new geometry for the cold formed steel section, using other different plate thicknesses (0.80, 1.00 and 1.20 mm). Full-scale tests were also conducted to determine ultimate load, deflections, stiffness during concreting and modes of failure. The results were also satisfactory when compared to theoretical results. Sieg (2015) suggested the use of a trapezoidal formwork, the profile MD55, with two different thicknesses (0.80 and 1.20 mm). The experimental program was preceded by the analysis of the profile, resisting to its self-weight and overloads before concrete curing. Then, fourteen prototypes of composite slabs have been tested to evaluate the ultimate resistance. As a result, the m-k design equation has been estimated based on the ultimate limit state of longitudinal shear. Grossi (2016) evaluated the influence of additional reinforcements in composite slabs against the increase of plate thickness to reach big spans. A mathematical formulation for design has been suggested to contemplate additional reinforcements and, then, full-scale tests were conducted, confirming the efficiency of this system and validating the proposed methodology.
Furthermore, there are also numerous papers in the literature where numerical procedures for buckling analysis in CFS elements are detailed as well as pertinent recommendations for linear instability or buckling problems are made. Kankanamge and Mahendran (2012) proposed a finite element numerical study to investigate the lateral-torsional buckling behavior of CFS stiffened channel sections simply supported beams uniformly bent about the axis of major inertia. The numerical results were calibrated with available numerical and experimental data. After comparing the moment capacity to normative prescriptions, Eurocode 3 Part 1.3 (2006) was considered conservative while AS/NZS 4600:2005 was not considered conservative. Then, the authors proposed modifications in the design codes. Ibrahimbegovic et al. (2013) used the von Karman strain measure to propose an original procedure to evaluate critical buckling loads of elements that experience extreme mechanical or thermomechanical conditions, providing a special format to the tangent stiffness matrix. The procedure efficiency was confirmed after performing the validation examples, in special when compared to a computational alternative base upon finite strain elasticity as well as a model using frame elements. Cheng et al. (2013) assessed the influence of combined bending and compression in the buckling modes of CFS lipped channel sections bent about both main axes. He stated that a non-symmetric pre-buckling stress distribution appears when the element is bent about the minor inertia axis, the critical compression load is reduced when the lips undergo a compressive stress. Ngo et al. (2014) developed a thermo-mechanical model, its discrete approximations and a solution algorithm to deal with nonlinear instability problems of combined material instability due to softening and geometric instability at large displacements. Simulations were presented to prove the high performance of the method. Finally, Glauz (2017) investigated the buckling behavior of CFS point-symmetric and non-symmetric sections as well as sections oriented to non-principal axes, developing a general formulation to predict the critical bending moments of beams under lateral-torsional buckling, equation that actually covers all CFS cross sections.
information about slipping resistance in the steel-concrete interface. Before concrete curing, the steel formwork in cold formed profile resists to all loads of construction and self-weight. Then, once no interaction is still provided, only the concrete resists to ultimate overloads. The design procedure was based on National Brazilian Codes ABNT NBR 14762 (ASSOCIAÇÃO BRASILEIRA DE NORMAS TÉCNICAS, 2008, 2009, 2010, 2014, 2016), ABNT NBR 8800 (2008), ABNT NBR 6118 (2014) and ABNT NBR 14859-2 (2016).
2 PROPOSED DESIGN PROCEDURE
Consider, in the first moment, the geometry and structure of this slab, as indicated in Figure 1. It’s composed by the cold formed U profile, bent about the minor inertia axis, the steel truss coupled to the steel formwork, additional reinforcements when necessary, light filling material and a concrete layer.
Figure 1: Cross section of trussed slab with steel formwork in cold formed U profile.
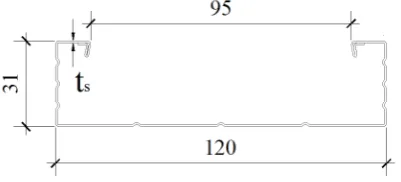
The size of the cold formed profile cross section is predefined, as indicated in Figure 2. There are also three stiffeners in each flange and three in the web, with edge and additional stiffeners as well. The thickness is indicated as ts and assumes the values of 0.65, 0.80 and 1.08 mm.
Figure 2: Cross section of cold formed U profile (mm).
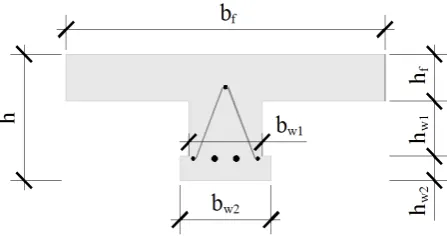
The dimensions of the concrete T cross section, in cm, are related to the geometry of the light filling material (bb indicates the width and hb the height of the blocks), steel section and concrete layer height (hc), according to Equation 1 and Figure 3.
𝑏𝑏𝑓𝑓=𝑏𝑏𝑏𝑏+ 9.5
ℎ=ℎ𝑏𝑏+ℎ𝑐𝑐
ℎ𝑓𝑓=ℎ𝑐𝑐
𝑏𝑏𝑤𝑤1= 9.5 (1)
𝑏𝑏𝑤𝑤2= 12.0
ℎ𝑤𝑤1=ℎ𝑏𝑏−3.1
Figure 3: Concrete T cross section.
The design of these slabs considering ultimate and serviceability limit states involves two steps. First of all, it’s necessary to analyze the concrete after curing resisting to bending and shear, and also controlling the maximum total deflection, which includes the effects of creep and shrinkage, and maximum crack width. For a given span, L, it’s possible to calculate the overload, in kg/m2, that leads to the first limit state considering the appropriate load combination for each one.
Then, with the previous result of span, the steel formwork should be verified for the limit states before concrete curing, which are instabilities caused by bending moment, web buckling caused by shear force and excessive deflection. It’s important to state that no interaction is provided, once there’s no data available from full-scale tests, reason why it’s called hybrid system. Besides, each rib is analyzed as a single beam.
In the sequence, all the input needed data are listed: dimensions and specific weight of light filling material; concrete layer thickness; concrete compressive strength; model of chosen steel truss; size, quantity and yield strength of reinforcements when needed; yield strength of steel used in the truss; environmental aggressiveness class according to ABNT NBR 6118 (2014); maximum deflection allowed before concrete curing according to ABNT NBR 6118 (2014); maximum deflection allowed after concrete curing according to ABNT NBR 8800 (2008); and span.
2.1 Design after concrete curing
The design of concrete beams to bending moment and shear force may guarantee the structural safety by preventing concrete collapse and excessive deformation of reinforcements. In this sense, standard proceedings proposed a methodology based on some assumptions, as the Bernoulli’s Hypothesis and the replacement of a non-linear stress distribution by a constant one, whose amplitude is λx, in which x represents the depth of the neutral axis, measured from the top of the cross section, and λ=0.8 when fck ≤ 50 MPa, and whose value is 85% of design compressive strength (fcd).
In general terms, the design should be done in the 3rd domain of deformations, where the relative depth of neutral axis, x/d (d is the distance from the center of gravity of tensioned reinforcements set to the top of the section), may varies between 0.259 and 0.628. Although, in order to guarantee the ductile behavior, the neutral axis depth is restrained to 0.45d when fck≤ 50 MPa.
2.1.1 Resistance to bending moment
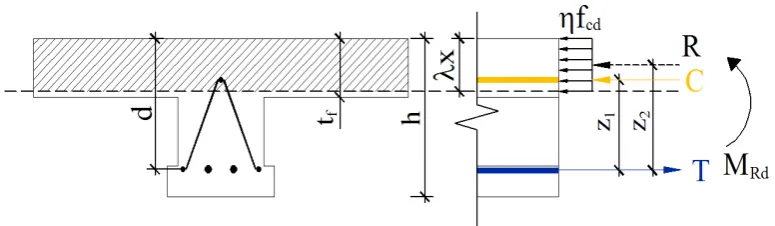
Figure 4: Distribution of stresses and forces in the concrete T cross section.
Considering the neutral axis crosses the flange, the equilibrium is expressed as follows:
−𝜂𝜂𝑓𝑓𝑐𝑐𝑐𝑐𝑏𝑏𝑓𝑓𝜆𝜆𝜆𝜆+𝐸𝐸𝑠𝑠𝜀𝜀𝑠𝑠𝑡𝑡𝐴𝐴𝑠𝑠,𝑐𝑐𝑡𝑡+𝑓𝑓𝑦𝑦𝑐𝑐�𝐴𝐴𝑠𝑠,𝑡𝑡𝑡𝑡+𝐴𝐴𝑠𝑠,𝑡𝑡𝑡𝑡�= 0 (2)
𝜆𝜆𝜆𝜆 ≤ 𝑡𝑡𝑓𝑓 (3)
where bf is the flange width, Es is the steel Young’s Module, εst is specific deformation (also depends on x) and As,ct is the area of the upper truss reinforcement, fyd is yield strength of steel, As,tt is the area of lower truss reinforcement and As,ta is the area of additional ones. If the value obtained with Equation 2 does not satisfy Equation 3, then the neutral axis crosses the web and its depth may be calculated using Equation 4.
−𝜂𝜂𝑓𝑓𝑐𝑐𝑐𝑐�𝑏𝑏𝑓𝑓− 𝑏𝑏𝑤𝑤1�ℎ𝑓𝑓− 𝜂𝜂𝑓𝑓𝑐𝑐𝑐𝑐𝑏𝑏𝑤𝑤1𝜆𝜆𝜆𝜆+𝐸𝐸𝑠𝑠𝜀𝜀𝑠𝑠𝑡𝑡𝐴𝐴𝑠𝑠,𝑐𝑐𝑡𝑡+𝑓𝑓𝑦𝑦𝑐𝑐�𝐴𝐴𝑠𝑠,𝑡𝑡𝑡𝑡+𝐴𝐴𝑠𝑠,𝑡𝑡𝑡𝑡�= 0 (4)
𝜆𝜆𝜆𝜆>𝑡𝑡𝑓𝑓 (5)
where bw1 is the web thickness, according to Figure 3, and hf is the flange thickness. The value now may satisfy Equation 5. Once the force distribution is now known, the distances z1 and z2 from the action lines of T to those of C and R, respectively, the resistant bending moment in the concrete section, MRd,c, is easily accounted by:
𝑀𝑀𝑅𝑅𝑐𝑐,𝑐𝑐=𝐶𝐶𝑧𝑧1+𝑅𝑅𝑧𝑧2 (6)
2.1.2 Resistance to shear force
Araújo (2010) reports two ultimate limit states in concrete beams due to shear. The first one involves concrete crushing in the direction of compressive principal stress, which is called diagonal compressive collapse. The second one is the crash due to diagonal tension that, in accordance with ABNT NBR 6118 (2014), is resisted by two mechanisms. While a portion of the action force is absorbed by the concrete, the other fraction is resisted by the transverse reinforcements. The diagonal steel belonging to the truss (Figure 5) in these slabs is responsible to shear resistance after concrete curing.
The resistant shear force in concrete beams, VRd,c, should be taken as the smallest of the following values:
𝑉𝑉𝑅𝑅𝑐𝑐,𝑐𝑐≤ �
𝑉𝑉𝑅𝑅𝑐𝑐2= 0.54�1−250𝑓𝑓𝑐𝑐𝑐𝑐� 𝑓𝑓𝑐𝑐𝑐𝑐𝑏𝑏𝑤𝑤1𝑑𝑑 𝑠𝑠𝑠𝑠𝑠𝑠2𝜃𝜃(𝑐𝑐𝑐𝑐𝑡𝑡𝑐𝑐𝛼𝛼+𝑐𝑐𝑐𝑐𝑡𝑡𝑐𝑐𝜃𝜃)
𝑉𝑉𝑅𝑅𝑐𝑐3= 0.6𝑓𝑓𝑐𝑐𝑡𝑡𝑐𝑐𝑏𝑏𝑤𝑤1𝑑𝑑+ 1.8𝐴𝐴𝑠𝑠𝑠𝑠𝑠𝑠𝑑𝑑(𝑐𝑐𝑐𝑐𝑡𝑡𝑐𝑐𝛼𝛼+𝑐𝑐𝑐𝑐𝑡𝑡𝑐𝑐𝜃𝜃)𝑠𝑠𝑠𝑠𝑠𝑠 𝛼𝛼 𝑠𝑠𝑠𝑠𝑠𝑠 𝛽𝛽 𝑓𝑓𝑦𝑦𝑐𝑐
(7)
where θ is inclination of concrete rods, α is inclination of transversal reinforcements, β is inclination of transversal reinforcements in its plane, d is the distance from the center of gravity of tensioned reinforcements set to the top of the section, fctd is the concrete design resistance to tension, Asw is the total area of transversal reinforcements, s is the distance between successive transversal reinforcements and fyd is yield strength of steel.
2.1.3 Control of maximum deflection
The total deflection in a concrete slab may be controlled as well, including the effects of creep and shrinkage. In this sense, ABNT NBR 6118 (2014) restricts its maximum displacement to L/350, where L is the effective span, based on a visual criterion that takes in account the sensory acceptability of users.
This kind of slab, as assumed before, can be analyzed as several juxtaposed T beams. Thus, the calculation of deflection can be done assuming the structural arrangement as simply supported beams. The maximum deflection (𝑓𝑓𝑒𝑒)
occurs in the mid span, according to Equation 8.
𝑓𝑓𝑒𝑒= 5𝑞𝑞𝑞𝑞𝑞𝑞𝐿𝐿 4
384𝐸𝐸𝑐𝑐𝑠𝑠𝐼𝐼1 (8)
where qqp is the uniformly distributed load for almost permanent load combinations, L is the span, Ecs is the concrete secant modulus of elasticity and I1 is the second moment of area calculated in the stage I, including the contribution of reinforcements.
Then, comparing the bending moment (Mqp) to resistant moment where cracking begins (Mr), adjusts may be done in the moment of inertia to consider the effects of cracking in concrete, which reduces the flexural stiffness. As soon as Mqp is increased and overpasses Mr, more cracked will be the concrete section and less will be the contribution of the cracked portion to bending resistance. Hence, a cubic interpolation is done to consider this effect:
𝐼𝐼𝑒𝑒 =�
𝐼𝐼1 𝑀𝑀𝑞𝑞𝑞𝑞≤ 𝑀𝑀𝑟𝑟
�𝑀𝑀𝑟𝑟 𝑀𝑀𝑞𝑞𝑞𝑞�
3
𝐼𝐼1+�1− �𝑀𝑀𝑀𝑀𝑞𝑞𝑞𝑞𝑟𝑟� 3
� 𝐼𝐼2 𝑀𝑀𝑞𝑞𝑞𝑞>𝑀𝑀𝑟𝑟 (9)
where Ie is the Branson’s effective inertia moment and I2 is the inertia moment in the stage II (linear distribution of stresses in concrete, discarding tensioned area of the section).
Finally, the total deflection can be calculated using Equation 10:
𝑓𝑓𝑡𝑡 =𝑓𝑓𝑒𝑒𝐼𝐼𝐼𝐼1𝑒𝑒�1 +𝛼𝛼𝑓𝑓� ≤350𝐿𝐿 (10)
where αf is a coefficient that considers the effects of creep. The maximum deflection may be, at most, equals to L/350. Values greater than this indicate the necessity to reduce the overload first assumed.
2.1.4 Restrictions to crack width
The tensile stresses in concrete lead to the appearance of small openings, the cracks, which can be hazardous once they allow the entrance in structure of aggressive agents, causing several damages to concrete and reinforcements. Thus, crack width should be controlled according to the environment where the structure will be built. In the design of these slabs, mostly used for residential buildings, class II was chosen, according to which the maximum crack width (wk,max) is 0.3 mm.
𝑤𝑤𝑘𝑘≤ � 𝜙𝜙 12.5𝜂𝜂1
𝜎𝜎𝑠𝑠 𝐸𝐸𝑠𝑠
3𝜎𝜎𝑠𝑠 𝑓𝑓𝑐𝑐𝑐𝑐𝑐𝑐 𝜙𝜙
12.5𝜂𝜂1 𝜎𝜎𝑠𝑠 𝐸𝐸𝑠𝑠�
4 𝜌𝜌𝑟𝑟+ 45�
(11)
𝑤𝑤𝑘𝑘≤ 𝑤𝑤𝑘𝑘,𝑚𝑚á𝑥𝑥
where ϕ is the diameter of the biggest steel bar, η1 is the adhesion coefficient, Es is the steel Young’s Module, fctm is the average concrete tensile strength, ρr is the passive adherent reinforcement ratio and σs is stress on reinforcements in stage II.
2.2 Design before concrete curing
Before the concrete curing, the cold formed steel beam must guarantee structural safety, resisting to bending moment and shear force due to self-weight of concrete, steel beam, light filling material, steel truss and construction overload, taken as 1 kN/m2. Due to high slenderness of cold formed members, plastic analysis is not allowed as in rolled and welded steel. In this sense, the design procedures, according to ABNT NBR 14762 (2010), are based on elastic regime, where all stresses are below the yield strength of the material.
2.2.1 Ultimate limit state of resistance to combined bending and shear
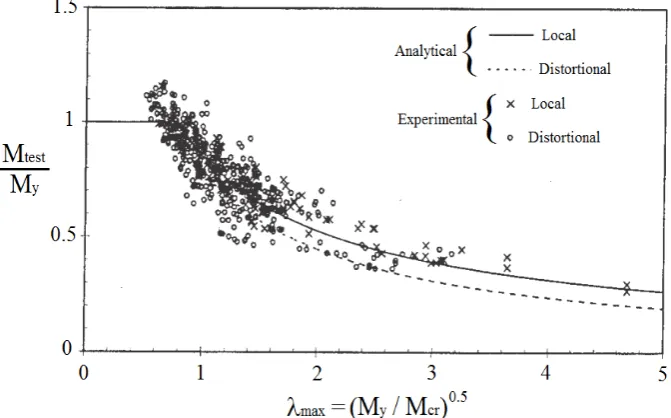
The evaluation of the resistant bending moment (MRd,s) is based on the Direct Strength Method (DSM), where no effective property of cross section is needed. Thus, all the gross geometric properties are directly used as input data and the results are obtained through experimental curves (Figure 6), which consider the geometric imperfections and residual stresses due to cold work. Besides, interaction between local and global buckling is also provided.
Figure 6: Comparison between theoretical and test data for flexural strength for the DSM (Yu, LaBoube, 2010).
To evaluate the resistant bending moment, global, local and distortional modes of buckling should be considered. The standard procedure consists in determining the reduced slenderness (λ) associated to each mode of instability and then, through an experimental curve, estimate the needed parameter.
For global instability:
𝑀𝑀𝑅𝑅𝑒𝑒=�
𝑊𝑊𝑓𝑓𝑦𝑦 𝜆𝜆0≤0.6
1.11(1−0.278𝜆𝜆20)𝑊𝑊𝑓𝑓𝑦𝑦 0.6 <𝜆𝜆0≤1.336 𝑊𝑊𝑓𝑓𝑦𝑦
𝜆𝜆02 𝜆𝜆0> 1.336
(13)
where W is the elastic modulus of the section about the minor inertia axis, fy is the steel yield strength, Me is the elastic critical moment of lateral-torsional buckling, obtained from elastic stability analysis and MRe is the characteristic value of resistant bending moment.
For local instability:
𝜆𝜆𝑙𝑙 =�𝑀𝑀𝑀𝑀𝑅𝑅𝑒𝑒𝑙𝑙 (14)
𝑀𝑀𝑅𝑅𝑙𝑙=�
𝑀𝑀𝑅𝑅𝑒𝑒 𝜆𝜆𝑙𝑙≤0.776 𝑀𝑀𝑅𝑅𝑒𝑒
𝜆𝜆𝑙𝑙0.8�1− 0.15
𝜆𝜆𝑙𝑙0.8� 𝜆𝜆𝑙𝑙> 0.776
(15)
where Ml is the elastic critical moment of local buckling, obtained from elastic stability analysis. For distortional instability:
𝜆𝜆𝑐𝑐𝑑𝑑𝑠𝑠𝑡𝑡=�𝑀𝑀𝑊𝑊𝑓𝑓𝑑𝑑𝑑𝑑𝑠𝑠𝑐𝑐𝑦𝑦 (16)
𝑀𝑀𝑅𝑅𝑐𝑐𝑑𝑑𝑠𝑠𝑡𝑡=�
𝑊𝑊𝑓𝑓𝑦𝑦 𝜆𝜆𝑐𝑐𝑑𝑑𝑠𝑠𝑡𝑡≤0.673 𝑊𝑊𝑓𝑓𝑦𝑦
𝜆𝜆𝑑𝑑𝑑𝑑𝑠𝑠𝑐𝑐�1− 0.22
𝜆𝜆𝑑𝑑𝑑𝑑𝑠𝑠𝑐𝑐� 𝜆𝜆𝑐𝑐𝑑𝑑𝑠𝑠𝑡𝑡> 0.673
(17)
where Mdist is the elastic critical moment of distortional buckling, obtained from elastic stability analysis.
The final value of resistant moment is the smallest of the three calculated according to Equations 13, 15 and 17. Thus:
𝑀𝑀𝑅𝑅𝑐𝑐,𝑠𝑠 ≤1.110�
𝑀𝑀𝑅𝑅𝑒𝑒
𝑀𝑀𝑅𝑅𝑙𝑙
𝑀𝑀𝑅𝑅𝑐𝑐𝑑𝑑𝑠𝑠𝑡𝑡
(18)
Besides, it’s necessary to evaluate the maximum shear force resisted by the webs, considering the ultimate limit state of web shear buckling. The following procedure applies to each flat portion of the web, h, thus every flat part may be accounted for the final shear resistance. In addition, no stiffener is provided, so kv, the coefficient of web shear buckling, may be taken as 5.
𝜆𝜆𝑤𝑤 =ℎ𝑡𝑡 (19)
𝐴𝐴= 1.08�𝐸𝐸𝑠𝑠𝑘𝑘𝑣𝑣
𝑓𝑓𝑦𝑦 𝐵𝐵= 1.40� 𝐸𝐸𝑠𝑠𝑘𝑘𝑣𝑣
𝑓𝑓𝑦𝑦 (20)
𝑉𝑉𝑅𝑅𝑐𝑐,𝑠𝑠 ≤
⎩ ⎪ ⎨ ⎪
⎧ 0.6ℎ𝑡𝑡𝑓𝑓1.10𝑦𝑦 𝜆𝜆𝑤𝑤 ≤ 𝐴𝐴 0.65𝑡𝑡2�𝑘𝑘𝑣𝑣𝑓𝑓𝑦𝑦𝐸𝐸𝑠𝑠
1.10 𝐴𝐴<𝜆𝜆𝑤𝑤 ≤ 𝐵𝐵 0.905𝐸𝐸𝑠𝑠𝑘𝑘𝑣𝑣𝑡𝑡3
1.10ℎ 𝜆𝜆𝑤𝑤 >𝐵𝐵
(21)
Finally, once MRd,s and VRd,s are determined for a given reference span, L, to assure the structural safety, the following relationship has to be verified.
�𝑀𝑀𝑠𝑠𝑑𝑑,𝑠𝑠 𝑀𝑀𝑅𝑅𝑑𝑑,𝑠𝑠�
2
+�𝑉𝑉𝑠𝑠𝑑𝑑,𝑠𝑠 𝑉𝑉𝑅𝑅𝑑𝑑,𝑠𝑠�
2
≤1 (22)
2.2.2 Control of maximum deflection
In this phase, before concrete curing, the cold formed beam acts as a steel formwork, which may be stiff enough to assure the geometry and dimensions of designed structures and be tight to avoid grout flow, according to ABNT NBR 15696 (2009). The same standard indicates the limit of 1+L/500, mm, for the maximum deflection of formwork, where L is the span. Although, once it will not be removed, the criterion for composite slabs from ABNT NBR 8800 (2008), less severe, is used.
In the elastic regime, considering the structural system a simply supported beam, the maximum deflection is obtained as:
𝑓𝑓𝑠𝑠=5𝑞𝑞𝑠𝑠𝑒𝑒𝑟𝑟𝑣𝑣𝐿𝐿 4 384𝐸𝐸𝑠𝑠𝐼𝐼𝑒𝑒𝑒𝑒≤ �
𝐿𝐿 180
2 𝑐𝑐𝑐𝑐 (23)
where qserv is the distributed load for construction serviceability load combinations, L is the span, Es is the steel Young’s Modulus and Ief is the effective second moment of area of the cold formed profile, obtained through the Direct Strength Method.
On the other hand, if the deflection, below the settled limit, exceeds the value of L/250, an extra layer of concrete will be deposited above the slab and the extra self-weight may be used to calculate a new deflection. The load qserv is
increased by the weight of a layer of concrete whose thickness is 70% of the displacement previously evaluated.
Thereby, the new deflection may respect the limits shown in Equation 23. 2.3 Calculation steps
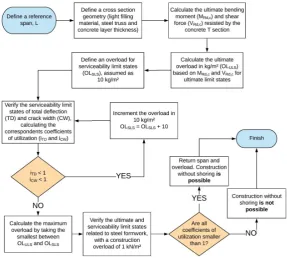
In the sequence, the design steps of trussed slabs with steel formwork in cold formed U profile are presented through a flow chart (Figure 7).
3 NUMERICAL BUCKLING ANALYSIS
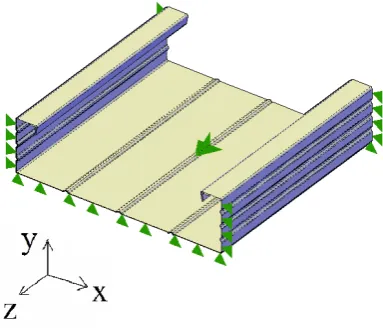
The design of cold formed steel members using the DSM involves the determination of critical moments of lateral-torsional, local and distortional buckling through elastic stability analysis. In this sense, numerical analyses were carried using Ansys® 14.0 (ANSYS, 2011) to simulate a cold formed simply supported beam, whose cross section is indicated in Figure 2, for different spans, from 0.6 to 2.0 m with steps of 0.2 m.
The element used was the 4-Node Shell 181 (Figure 8), suitable for analyzing thin to moderately-thick shell structures, with six degrees of freedom at each node (translations in the x, y and z directions and rotations about the same axes). It’s well-suited for both linear and non-linear analysis, using full and reduced integration schemes in the element domain. Besides, its formulation is based on logarithmic strain and true stress measures.
Figure 8: Numerical model information.
At the boundary, the fork support is a needed condition to evaluate the buckling critical bending moments. At each support, translations were fixed in the x direction in the webs’ plane portions and in the y direction in the bottom flange’s plane portion, which means that intermediate stiffeners are free. Besides, along the z axis, the longitudinal axis of the beam, a single node at the geometric center of the web was fixed in order to prevent displacements in this direction due to horizontal forces on account of bending moment. This scheme is illustrated in Figure 9.
Figure 9: Fork support – boundary conditions.
distribution of stresses due to a unitary bending moment (1 Nm). Thus, the whole beam is uniformly bent about the less stiff principal axis (Figure 10).
Figure 10: Edge forces due to the action of bending moment.
Finally, before performing the buckling analysis, the mesh size was determined. For a predefined span, 2 m, 40 mesh sizes were tested and the first critical buckling load has been evaluated. A 2 mm mesh was chosen due to reduced dimension of cold formed profile and its tiny stiffeners.
4 ANALYSIS RESULTS
4.1 Numerical experiments
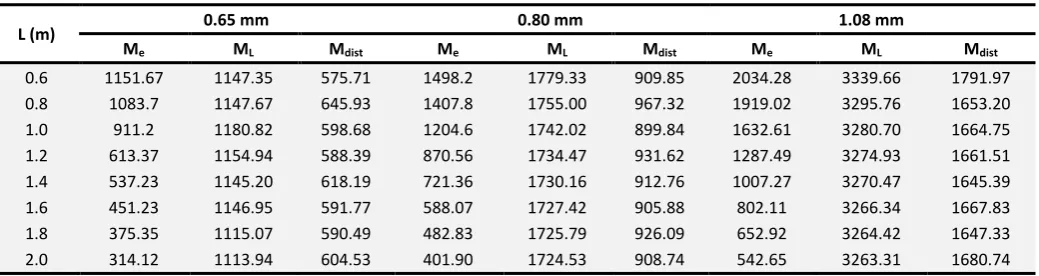
In this section, the results of numerical analysis will be presented. For each span, three critical bending moments were determined: lateral-torsional, local and distortional. Table 1 shows the outputs, where all the moments were calculated in Nm.
Table 1: Critical bending moments of buckling of cold formed steel U profile.
L (m) 0.65 mm 0.80 mm 1.08 mm
Me ML Mdist Me ML Mdist Me ML Mdist
0.6 1151.67 1147.35 575.71 1498.2 1779.33 909.85 2034.28 3339.66 1791.97
0.8 1083.7 1147.67 645.93 1407.8 1755.00 967.32 1919.02 3295.76 1653.20
1.0 911.2 1180.82 598.68 1204.6 1742.02 899.84 1632.61 3280.70 1664.75
1.2 613.37 1154.94 588.39 870.56 1734.47 931.62 1287.49 3274.93 1661.51
1.4 537.23 1145.20 618.19 721.36 1730.16 912.76 1007.27 3270.47 1645.39
1.6 451.23 1146.95 591.77 588.07 1727.42 905.88 802.11 3266.34 1667.83
1.8 375.35 1115.07 590.49 482.83 1725.79 926.09 652.92 3264.42 1647.33
2.0 314.12 1113.94 604.53 401.90 1724.53 908.74 542.65 3263.31 1680.74
where Me is the lateral-torsional critical moment (LTCM), ML is the local critical moment (LCM) and Mdist is the distortional critical moment (DCM), for the three different analyzed thicknesses.
It’s important to state that when the thickness was first increased from 0.65 to 0.80 mm, a 31% average increased has been observed in the LTCM and 53% for both LCM and DCM. Then, when the thickness was changed to 1.08 mm,
LTCM, LCM and DCM were increased in 80%, 189% and 180%, respectively, based on the elementary case (0.65 mm).
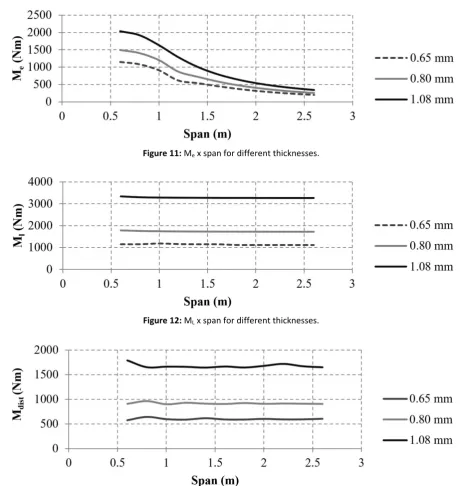
Figure 11: Me x span for different thicknesses.
Figure 12: ML x span for different thicknesses.
Figure 13: Mdist x span for different thicknesses. 4.2 Spans and overloads without shoring
The evaluation of the resistance of trussed slabs with steel formwork in cold formed U profile is mainly associated to the input predefined cross section geometry and material’s mechanical properties. Besides, the model of truss incorporated to the ribs also affects the relationship between span and overload, expressed in kg/m2. Thus, a design table can be arranged by making different combinations of entering data.
In order to exemplify the results of the proposed design procedure, two geometries were selected and the analysis results were presented here. The same type of concrete was used, with compressive strength of 25 MPa, and also the truss, model 8645, whose yield strength is 600 MPa. Besides, the light filling material was chosen in accordance with ABNT NBR 14859-2 (2016), which specific weight was taken as 0.37 kN/m3.
a) Scenario 1: concrete layer thickness of 5 cm, light filling blocks 27 x 8 cm and 2 steel bars of Ø6.3 mm as additional reinforcement, fyk=500 MPa;
For each scenario, the three different cold formed plated thicknesses were tested to verify how this parameter influences in the maximum span without shoring. Finally, the cold formed steel has yield strength of 340 MPa, for all cases.
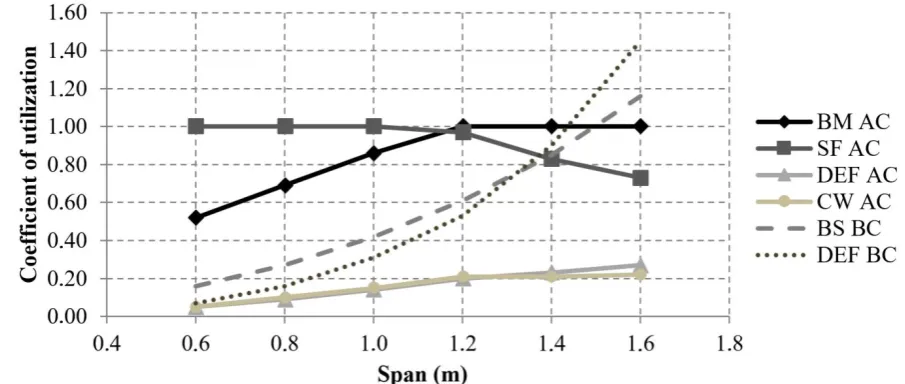
For the next results, the following convention must be used to indicate the limit states related to design procedure: BM AC – bending moment after curing; SF AC – shear force after curing; DEF AC – maximum deflection after curing; CW AF – crack width after curing; BS BC – combined bending and shear before curing; and DEF BC – maximum deflection before curing.
4.2.1 Scenario 1
Figure 14: Analysis results for scenario 1 – steel thickness of 0.65 mm.
Figure 16: Analysis results for scenario 1 – steel thickness of 1.08 mm.
In accordance with Figures 14 to 16, the design is governed by the ultimate limit states for short spans. The ultimate limit of resistance to shear force restricts the overload when the span is below 1.0 m, which was already expected for short slabs, and bending moment does in the other cases. Moreover, the serviceability limit states no longer influence in the ultimate load for the presented cases, but would do for larger spans, over 3.2 m, which is limited by total deformation of concrete (DEF AC).
In addition, the maximum span without shoring also varies according to steel plate thickness. For 0.65mm-thick plates, simply supported slabs with 1.2 m can be safely built. For the other cases, 0.80mm-thick plates and 1.08mm-thick plates, respectively, the span is increased in 20 cm, reaching 1.4 m. It’s important to observe that, whereas the
steel plate had its thickness increased in 35% and the coefficient of utilization related to interaction between bending
and shear got smaller than 1, the total deformation was the one that restricted the gains, according to Figure 16 (coefficient of utilization of 1.10). That could be solved by changing the deformation limits in Equation 23, which was suggested by ABNT NBR 8800 (2008).
4.2.2 Scenario 2
Figure 18: Analysis results for scenario 2 – steel thickness of 0.80 mm.
Figure 19: Analysis results for scenario 2 – steel thickness of 1.08 mm.
In accordance with Figures 17 to 19, the design is governed by the ultimate limit states for short spans, the same observed in the previous case. The ultimate limit of resistance to shear force restricts the overload when the span is below 1.4 m and bending moment does in the other cases. Moreover, the serviceability limit states no longer influence in the ultimate load for the presented cases, but would do for larger spans, over 3.0 m, which is limited by total deformation of concrete (DEF AC).
In addition, the maximum span without shoring also varies according to steel plate thickness. For 0.65mm-thick plates, simply supported slabs with 1.0 m can be safely built. For the other cases, 0.80mm-thick plates and 1.08mm-thick plates, respectively, the span is increased in 20 cm and 40 cm, reaching 1.2 m and 1.4 m.
Figure 20: Overloads for scenarios 1 and 2.
5 CONCLUSIONS
In this paper, a new design procedure for hybrid steel-concrete trussed slabs was proposed, whilst no data about the mechanical composed behavior is provided from full scale tests. Thus, no interaction was considered, in the sense that concrete resist to all loads its lifetime, after curing, and steel formwork does before concrete curing. National Brazilian Codes ABNT NBR 14762 (2010), ABNT NBR 6118 (2014), ABNT NBR 8800 (2008) and ABNT NBR 14859-2 (2016) supplied technical information in which the whole methodology was based.
First of all, all cases may be analyzed as single ones, i.e., each combination of concrete compressive strength (fck), light filling material (specific weight and dimensions), steel truss model and additional reinforcements (size, quantity and yield strength) leads to a curve overload versus span, an useful tool for structural engineers when dealing with design of this kind of slab. In general, the overload is controlled by a different limit state depending on the situation: for short spans, up to 1.2 m, shear force is the limiting factor; for medium spans, from 1.4 to 3.0 m, bending moment is the limiting one; and for long spans, total deflection is the limiting factor, on average.
In addition, the cold formed steel formwork, which guarantees structural safety on construction stage, conditions the maximum span length without shoring. It may be observed that the employed profile was first intended to be fabricated with 0.65 mm of plate thickness, which implies, associated to the reduced dimension of U section (120 x 31 mm), a low moment of inertia and a low elastic modulus of resistance about the bending axis. In this sense, no large spans were expected before the analysis was actually carried, reason why a parametric study of thickness was proposed to evaluate its influence in the maximum span without shoring.
Finally, two similar arrangements have been chosen to demonstrate that different spans can be reached without shoring depending on the data entry and on the steel formwork geometry as well. The results have shown that a span without shoring of 1.2 m can be built when a plate thickness of 0.65 mm is used. On the other hand, when the plate thickness is 0.80 mm or 1.08 mm, the span without shoring can reach 1.4 m, for the first case. Then, putting the formworks 10 cm away from its original position in case 1 by using a light filling block 10 cm wider (37 x 8 cm) and also increasing in 1 cm the concrete layer thickness, the maximum spans were reduced to 1.0 m, 1.2 m and 1.4 m, respectively.
moment. Thus, a longer span without shoring is expected. On the other hand, numerical experiments will be performed followed by full scale tests to confirm this assumption and verify the accuracy of the proposed formulation.
ACKNOWLEDGMENTS
The authors acknowledge ArcelorMittal and Federal University of Espirito Santo for the financial support during the development of this research.
Author’s Contributions: Conceptualization, LF Favarato; Methods, LF Favarato, AFG Calenzani, JC Vianna Pires, E Junges and JA Ferrareto; Writing – original draft, LF Favarato; Writing – review and editing, LF Favarato, AFG Calenzani, JC Vianna Pires, E Junges and JA Ferrareto; Resources, JA Ferrareto; Supervision, AFG Calenzani and JA Ferrareto.
Editor: Adnan Ibrahimbegovic. Paulo de Mattos Pimenta.
References
ANSYS: Engineering Analysis System. Version 14.0, 2011.
Araújo, J. M. (2010). Curso de Concreto Armado, (3ª edição), Editora Dunas, Rio Grande, RS, Brazil.
ASSOCIAÇÃO BRASILEIRA DE NORMAS TÉCNICAS (2008). NBR 8800, Projeto de estruturas de aço e de estruturas mistas de aço e concreto de edifícios, Rio de Janeiro.
ASSOCIAÇÃO BRASILEIRA DE NORMAS TÉCNICAS (2009). NBR 15696, Fôrmas e escoramentos para estruturas de concreto – Projeto, dimensionamento e procedimentos executivos, Rio de Janeiro.
ASSOCIAÇÃO BRASILEIRA DE NORMAS TÉCNICAS (2010). NBR 14762, Dimensionamento de estruturas de aço constituídas por perfis formados a frio, Rio de Janeiro.
ASSOCIAÇÃO BRASILEIRA DE NORMAS TÉCNICAS (2014). NBR 6118, Projeto de estruturas de concreto – procedimento, Rio de Janeiro.
ASSOCIAÇÃO BRASILEIRA DE NORMAS TÉCNICAS (2016). NBR 14859-2, Lajes pré-fabricadas de concreto – Parte 2 – Elementos inertes para enchimento e fôrma – Requisitos, Rio de Janeiro.
Carvalho, P. R. M.; Grigoletti, G.; & Barbosa, G. D. (2014). Curso Básico de Perfis de Aço Formados a Frio, (3rd edition), Porto Alegre, RS, Brazil.
Cheng, S. S.; Kim, B.; & Li, L. Y. (2013). “Lateral–torsional buckling of cold-formed channel sections subject to combined compression and bending”. Journal of Constructional Steel Research, 80, 174-180.
Glauz, R. S. (2017). “Elastic lateral-torsional buckling of general cold-formed steel beams under uniform moment”. Thin-Walled Structures, 119, 586-592.
Grossi, L. G. F. (2016). “On the structural behavior and the design of composite slabs with additional reinforcement” (in Portuguese), M. Sc. Dissertation, University of São Paulo, São Carlos.
Ibrahimbegovic, A., Hajdo, E., & Dolarevic, S. (2013), “Linear instability or buckling problems for mechanical and coupled thermomechanical extreme conditions”. Coupled systems mechanics, 2(4), 349-374.
Javaroni, C. E. (2015). Estruturas de Aço: Dimensionamento de Perfis Formados a Frio, (1st edition), Elsevier, Rio de Janeiro, RJ, Brazil.
Kankanamge, N. D.; & Mahendran, M. (2012). “Behaviour and design of cold-formed steel beams subject to lateral–torsional buckling”. Thin-walled structures, 51, 25-38.
Ngo, V. M.; Ibrahimbegovic, A.; & Hajdo, E. (2014). “Nonlinear instability problems including localized plastic failure and large deformations for extreme thermo-mechanical loads”. Coupled systems mechanics, 3(1), 89-110.
Silva, E. L.; Pierin, I.; & Silva, V. P. S. (2014). Estruturas Compostas por Perfis Formados a Frio: Dimensionamento pelo Método das Larguras Efetivas e Aplicação conforme ABNT NBR 14762:2010 e ABNT NBR 6355:2012,Instituto do Aço Brasil, Rio de Janeiro, RJ, Brazil.
Takey, T. H. (2001). “Composite slab system for buildings using cold formed steel profiles” (in Portuguese), M. Sc. Dissertation, Pontifícia Universidade Católica do Rio de Janeiro, Rio de Janeiro.
Vianna, J. C. (2005). “Composite slab system for residential constructions using cold formed steel plates with embossments” (in Portuguese), M. Sc. Dissertation, Pontifícia Universidade Católica do Rio de Janeiro, Rio de Janeiro.