Pharmacophore
ISSN-2229-5402
Journal home page: http://www.pharmacophorejournal.com
Corresponding Author: Munazza Gull, Biochemistry Department, Faculty of Science, King Abdulaziz University, 42805, Jeddah, Kingdom of Saudi Arabia
COMPARATIVE ANALYSIS OF VARIOUS GROWTH, IONS UPTAKE
AND OTHER PHYSIOLOGICAL PERFORMANCE OF TWO RICE
(Oryza sativa L.) GENOTYPES UNDER ALTERING SALINE
CONDITIONS
Munazza Gull
1*, Abida Kausar
21. Biochemistry Department, Faculty of Science, King Abdulaziz University, 42805, Jeddah, Kingdom of Saudi Arabia,
2. Department of Botany, GC (W) University, Faisalabad, Pakistan.
To Cite This Article: Munazza Gull, Abida Kausar, (2018), “Comparative analysis of various growth, ions uptake and other physiological performance of two rice (Oryza Sativa L.) Genotypes under altering saline conditions”, Pharmacophore, 9(5), 73-81.
Introduction
Soil salinity is one of the severe threats among abiotic stresses that disturbs the plant productivity worldwide due to the excessive use of poor quality or saline irrigation water [1, 2]. Total saline soils cover about 953 million hector area which is about 8 % of the surface of land [3, 4]. It has been evaluated that nearly 900 million ha of land has been damaged in all over the world, in which the cultivated area is about 20 percent, and the remaining area has been irrigated [5].
It has been a well-established fact that salt stress reduced the growth and productivity of plants [6-8]. Salinity causes the accumulation of salts as a consequence of ionic and osmotic imbalance [9] resulting in lowering of water potential and osmotic potential in plants [10]. The development of plants relies on the rate of photosynthesis and uptake of nutrients from the soil. The increased concentrations of sodium and chloride ions ultimately decrease the uptake of essential nutrients [11]. All abiotic stresses like drought and salinity that adversely affect plant growth and development have a negative impact on the photosynthesis and uptake of these nutrients, which become suppressed under saline conditions [12, 13]. The lowering in photosynthesis rate directly results in the discount in the plant biomass under salinity [14, 15]. Different techniques have been used to increase the production of crops in the saline conditions; however, the screening of salt tolerant genotypes and the use of these genotypes in salt affected area has been one among the best options for getting higher crop productivity.
A R T I C L E I N F O A B S T R A C T
Received: 04th Jun 2018
Received in revised form: 21th Oct 2018
Accepted: 20th Oct 2018 Available online: 23th Oct 2018
Keywords:
Rice, Salinity, Ions Uptake, Metabolites, Basmati 515, Plant Lengths, Sodium, Potassium, Phosphorus
Soil salinity is a severe threat among various abiotic stresses that lowers down the growth and productivity of agricultural crops throughout the world due to the excessive use of poor quality irrigation water. Tolerance of plants involves various physiological, biochemical, and metabolic pathways, and a network of genes to express in saline soils. The present study was conducted to assess the genetic potential of two rice cultivars (Super Basmati and Basmati 515) in altering saline conditions i.e., 0, 40, 80 and 120 mM of NaCl. The data was recoded for height, fresh and dry weight of the plant, sodium, potassium, calcium, magnesium, phosphorus contents, total free amino acids and total proteins. The results showed that increase in salinity reduced the growth parameters in both cultivars of rice. The reduction was more prominent at higher concentrations of soluble salt. The application of salt stress also negatively affected the uptake of sodium, potassium, calcium, magnesium and phosphorus contents, and total proteins in contrast with total free amino acids that were increased with the application of salt stress. Basmati 515 showed better growth than Super Basmati under saline and non-saline conditions. Therefore, Basmati 515 could be suggested for planting to get better performance under salt-affected soils.
Rice has a significant place in the universal food system because above than half of the population of the world consume rice in their daily food [16] as staple food. The production of rice has been estimated to be 8.9 billion in 2030 [17]. The rice seeds are commonly used for industrial purposes such as starch and beverages production. The hay of rice is used for feeding cattle. The straw of rice is also used for making mats. The Pakistani varieties like basmati and super basmati are famous throughout the world especially for the length of seeds and their fragrance [18]. The dry soil condition in Pakistan and other countries coupled with micronutrient deficiency has been the main problem throughout the world. Water scarcity and shortage of labor have been causing decline in the rice production [19, 20]. The rice transplantation requires mandatory water logging environments for its maturation. Due to the problem of water limitations, a technique has been developed to call adaptation to the aerobic rice [21]. The rice crop grown in aerobic environments showed a significant reduction in the production of grain and tillers. Keeping the significance of rice and salt stress in view, the current study was planned to observe the effect of salinity stress on the behavior of two rice cultivars for salt stress, and determine the level of uptake of essential nutrients and accumulation of metabolites in saline environments for having more production in salt-hit areas of the world.
Material and Methods
Rice genotypes collection and growth experiments
Two cultivars of rice Basmati 515 and Super Basmati were analyzed in this study. After 40 days of sowing, the rice, the nursery plants were transplanted into plastic pots, each containing 8 kg clay loamy soils. Two cultivars of rice Basmati 515 and Super Basmati were subjected to different levels of salt (NaCl) stress. The pots were designed in a completely randomized design (CRD) with three replications of each.
Salinity treatments
The treatments of salt stress were subjected after fifteen days of transplantation of plants. The rice cultivars i.e., Super Basmati and Basmati 515 were grown in 0 mM, 40 mM, 80 mM and 120 mM NaCl salt stress which were provided in a split form.
Soil analysis
For the purpose of soil analysis, the soil was first grinded well then it was dried on a sheet under the sun light. A 300 g sample of soil was taken in a plastic beaker, and distilled water was added with continuously stirring with the help of spatula until a homogenized paste of soil was formed. Then the paste was used to obtain the extract by a soil extractor. This soil extract was used for various further analyses (Table 1).
Table 1: Physiochemical characteristics of soil and water used for growth of different rice cultivars (Oryza sativa L.) for the analysis of their salinity tolerance potential
Soil characteristics Mean readings Water characteristics Mean readings
Soil texture Clay loam EC( μS/cm) 684
EC( dS m-1
) 0.9 - 1.4 pH 7.77
pH 7.52 Ca2+ (meqL-1
) 5
Ca (meqL-1) 5 Mg (meq L-1) 5
Mg (meq L-1) 4 CO
3 (meq L-1)
-HCO3 (meq L-1) 4-6 Cl- (meq L-1) 4-5
CO3 (meq L-1) - HCO3 (meq L-1) 6
K+mg kg-1 20 – 48 K+(mg kg-1
) 3.0-4.0
Cl- (meq L-1) 5-7 Na+(mg kg-1) 62
Biochemical parameters
Preparation of phosphate Buffer
The phosphate buffer (0.02M) was prepared by using NaH2Po4 (1M) and Na2HPo4 (1M) reagents. The 0.5 g
material of the fresh plant was extracted with the phosphate buffer (10ml) at pH 7, and left for a night to estimate the total protein and amino acid contents.
Total free amino acids
till the color of the tube extract changed. After 20 minutes, when test tubes became cool, 10 ml of distilled water was added to all the test tubes for maintaining the volume. The optical density of the colored solutions was measured at 570 nm on spectrophotometer (Jenway 6700). The calculation was measured by using the following formula
Total free aminocids=Graph reading x volume of sample x dilution of factor/weight of tissues (g)x1000. Total soluble proteins
The total soluble proteins were calculated by the method of Lowry et al. [23]. The copper reagent was prepared to measure the total soluble proteins.
Preparation of copper reagent
Solution “A” was prepared by dissolving 2.0 g Na2CO3, 0.2 g NaOH and 1.0 g sodium potassium tartarate in
distilled water, and the volume of mixture was made 100 ml. Solution “B” was prepared by dissolving 0.5 g CuSO4.5H2O in 100ml distilled water. Solution “C” (Copper reagent) was prepared by mixing 50ml Solution “A”
and 1ml Solution “B”. The leaf extract (1ml) taken from the test tube was mixed with 1 ml solution “C” and left for 30 minutes at room temperature. Then 0.5ml Folin-Phenol reagent was added in test tubes, and incubated at room temperature for 30 minutes. The optical density was measured at 620nm on spectrophotometer (Jenway, 6700).
Ion analyses
The rice plants were grown for 120 days, and then uprooted. Their lengths and fresh weights were determined immediately, and then oven dried for seven days to carry out ions analysis.
Digestion
The material for digestion was oven dried for 7 days. The rice plants’ dried materials (0.5g) were taken in digestion tubes. Concentrated H2SO4 was added to the digestion tube, and left overnight at room temperature. The next day,
0.5 ml of 35% H2O2 was added, and the digestion tubes were transferred to the digestion block for heating. The
tubes were heated at 350oC until the fumes of H2O2 began to come out from the digestion tubes. The digestion
tubes were then removed from the digestion block, and allowed to cool for 5 minutes. After cooling, 0.5 ml H2O2
was added. This procedure was repeated for five times, till the digested material became completely colorless. The digested material was filtered, and the volume was made 50 ml by the addition of distilled water. Aliquot was used for the determination of Na and K on flame photometer (Jenway, PFP7), and P was calculated from the digested leaves by Wolf method [24].
Barton`s reagent preparation
Preparation of solution “A”: Ammonium molybdate (25g) was dissolved in 400 ml water.
Preparation of solution B: Ammonium metavandate (1.25g) was dissolved in 300ml water. These two solutions were mixed thoroughly to prepare Barton`s reagent. Barton`s reagent of 2ml and aliquot 2ml were mixed, and the volume was made 50ml with water. After 30 minutes, the optical density of mixture was recorded at 470 nm on spectrophotometer (Jenway, 6700). Phosphorus estimation was determined from the standard curve.
Statistical Analysis
All of the statistical analyses were performed with software package COSTAT (v. 6.3, Cohort software, California). The effect of salt stress on essential nutrient uptake and growth response of rice cultivars were calculated by multiway-analysis of variance (ANOVA) of data with the level of significance set at p≤0.05.
Results
Growth attributes
In both rice cultivars, the fresh and dry weights were negatively affected by saline conditions (Figure 1b, and 1c) at all the applied concentrations of sodium chloride. The varying salinity environments affected variably. The maximum fresh weight (16.82 g) of plants was determined at non-saline condition in both rice cultivars. However, the highest reduction was recorded at 120 mM (41 %) followed by 80 mM (29 %) and 40 mM (17%) salt stress in both rice cultivars. The effect of salinity on fresh and dry weights in non-saline and saline concentrations was found to be significantly different (Table 2). The utmost fresh and dry weight was estimated in rice cultivar Basmati 515, and the lowest was observed in Super Ba0smati. The interactions between the treatments and cultivars were non-significant, which presented the similar behavior of both cultivars of rice under the saline conditions. The data indicated that the rice cultivars exhibited the highest value of fresh and dry weight of rice plants under normal environments, however, the lowest value was recorded in salt stressed environments (Table 2).
Table 2: Records of the mean squares analysis of variance (ANOVA) of data for height, fresh and dry weight, and sodium and potassium contents of two rice cultivars (Oryza sativa L.) under altering saline conditions
indicating the comparative analysis of growth parameters.
S.V. Degree of
freedom
Plant height (cm)
Plant Fresh Weight (g)
Plant dry weight (g)
Sodium (mg g-1 D. W.)
Potassium (mg g-1 D. W.) Rice cultivars
(V) 1 8.833
** 3.26** 0.11** 1.43 *** 1.24*
NaCl
treatments (S) 3 233.87
*** 38.32*** 0.01** 177.71*** 109.97***
V x S 3 0.233 ns 0.13ns 0.001NS 0.006 ns 0.066 ns
Error 16 0.755 0.65 0.000 0.073 0.162
Total 23
*, **, *** = significant at 0.05, 0.01 and 0.001 levels, respectively., Ns =Non-significant, D. W= Dry Weight
Figure 1: Plant growth parameters, plant height (a), fresh weights (b), dry weight (c) and essential nutrients uptake sodium (d), potassium (e) and calcium (f) contents according to the altering concentration and treatments
Ion analysis
Salt stress increased the concentrations of sodium in cultivars of rice (Figure 1d). The varying saline conditions affected differently. The maximum sodium contents (22.98 mg g-1 D.W.) were recorded in 120 mM of salt stress, followed by 40 mM (17.63 mg g-1 D.W) and 80 mM (20.81 mg g-1 D.W). While, the lowest value was noted under non- saline medium (10.52 mg g-1 D.W) in both rice cultivars. The difference between sodium contents in saline and normal medium was significant. The cultivar response for NaCl stress was also non-significant (Table 2). The variations among the sodium contents were non- significantly different in both cultivars of rice. However, the interactions for salt treatments and cultivars were also non-significant. It was noted that that both rice cultivars responded similarly to the salt stress. Ion analysis data showed that the highest sodium contents in both rice cultivars were found in saline medium as compared to the control (Table 2).
The salinity adversely affected the potassium accumulation in both rice cultivars (Figure 1e). Maximum potassium was accumulated (18.56 mg g-1 D.W.) under non- saline conditions in both rice cultivars. In saline environments,
the minimum accumulation was recorded at the 120 mM (57 %) NaCl salt stress followed by the treatment of 80 mM (47 %), and then 40 mM (26 %) in both cultivars of rice. The difference between potassium accumulation in non-saline and saline medium was also significant. The response against salt stress of both rice cultivars was also non-significant. The highest accumulation of potassium was recorded in rice cultivar Basmati 515 (13.16 mg g-1 D.W.), while the lowest was found in Super Basmati (12.72 mg g-1). The interactions between salinity applications
and rice cultivars were non-significant which showed that rice cultivars similarly responded to the salinity. It was observed that the maximum value of potassium contents was found in both rice cultivars under the control conditions as compared to that recorded in the NaCl salinity stress treatments (Table 2).
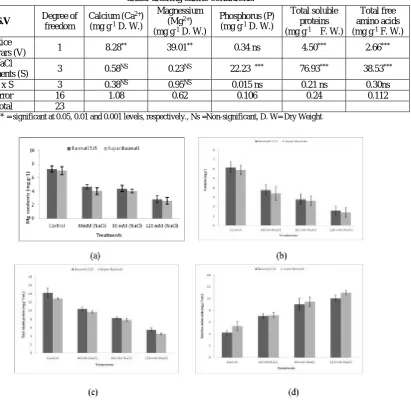
Salinity stress also negatively affected the calcium and magnesium ions uptake in both the cultivars of rice (Figure 1f and 2a, Table 3). The accumulations of essential ions were decreased with increasing salt concentrations, and the maximum was found in non-saline conditions in both rice cultivars. All levels of NaCl salinity stress adversely affected the phosphorous accumulation in both rice cultivars (Figure 2b). Maximum phosphorous was accumulated (6.03 mg g-1 D.W.) under the normal environments in both rice cultivars. Under salinity stress, the
maximum reduction was observed at 120 mM, which was about 75 % followed by 80mM (58 %), and 40 mM about 41 % in both rice cultivars. The difference between the accumulation of phosphorous content under non-saline and non-saline medium was also significant (Table 3). The maximum phosphorous accumulated in rice cultivar Basmati 515 (3.57 mg g-1 D.W.), and the lowest was observed in Super Basmati (3.33 mg g-1 D.W.). The variation
in the phosphorous contents between rice cultivars was found non- significant. The interaction between salt treatments and the cultivars was also recorded non-significant which showed that both rice cultivars nearly performed similar behavior under salinity stress for phosphorous contents.
Biochemical attributes
Salinity decreased the total soluble proteins in both cultivars of rice (Figure 2c). The different levels of salinity affected differently the total soluble protein contents. The maximum total soluble proteins (13.52 mg g-1 D.W.)
were recorded under normal conditions. In distinction, the highest decrease was calculated at 120 mM (64 %) followed by 80 mM (42 %) and 40 mM (28 %) in both rice cultivars. The response of both rice cultivars toward NaCl stress was non-significant. The utmost total soluble protein was observed in Basmati 515 (9.58 mg g-1 D.W.),
and the lowest in Super Basmati (8.74 mg g-1 D.W.). The difference between the rice cultivars for total soluble
proteins was significant. The interactions between salt treatments and cultivars were also non-significant which exposed that both rice cultivars behaved similarly under the salt stress conditions. It was established that the rice cultivars presented the highest value of total soluble proteins in non -saline conditions in contrast to the salt stressed conditions (Table 3). The varying salt concentrations decreased the accumulation of total free amino acids in rice variously (Figure 2d). The maximum total free amino acids (10.55 mg g-1 D.W.) were found under the salt
stress level of 120 mM. In contrast, the lowest value of total free amino acids was observed in non- saline environments which was about 4.77 mg g-1 D.W., followed by the 40 mM (7.11 mg g-1D.W.) and 80 mM (9.19
mg g-1 D.W.) in both rice cultivars.
The difference between total free amino acids in non-saline and the saline conditions was also significant. The response of rice cultivars for salinity stress was non-significant (Table 3). The lowest value was measured in Basmati 515 (7.66 mg g-1 D.W.), and the maximum was observed in Super Basmati (8.15 mg g-1 D.W.). The
performed similarly under the salinity stress. It was noted that the maximum value of the total free amino acids was observed in salt stress conditions as compared to the non-stress conditions (Table 3).
Table 3: Records of the mean squares analysis of variance (ANOVA) of data for calcium, magnesium, phosphorus content, total soluble proteins and total free amino acids of two rice cultivars (Oryza sativa L.)
under altering saline conditions.
S.V Degree of
freedom
Calcium (Ca2+)
(mg g-1 D. W.)
Magnessium (Mg2+)
(mg g-1 D. W.)
Phosphorus (P) (mg g-1 D. W.)
Total soluble proteins (mg g-1 F. W.)
Total free amino acids (mg g-1 F. W.)
Rice
cultivars (V) 1 8.28
** 39.01** 0.34 ns 4.50*** 2.66***
NaCl
treatments (S) 3 0.58
NS 0.23NS 22.23 *** 76.93*** 38.53***
V x S 3 0.38NS 0.95NS 0.015 ns 0.21 ns 0.30ns
Error 16 1.08 0.62 0.106 0.24 0.112
Total 23
*, **, *** = significant at 0.05, 0.01 and 0.001 levels, respectively., Ns =Non-significant, D. W= Dry Weight
Figure 2: Magnesium (a), phosphorus (b), total proteins(c) and total free amino acids (d) of two rice cultivars under altering saline conditions according to the concentration and treatments with NaCl. Data are means ±
standard error of different independent experiments. Data with different letters are significantly different between treatments at p≤0.05.
Discussion
toxic ions in the soil which were absorbed by the plants that disrupted the absorption and accumulation of the other essential micro and macro nutrients, and as a consequence, it hindered the various metabolic activities of plants, and ultimately inhibited the rice plant growth and development [35], or in severe conditions, there might be plant death. Previous studies also showed the relevant evidences [36].
The reduction of phosphorus, potassium, magnesium and calcium in plants directly affected the rate of synthesis of certain other metabolites [37]. When the accumulation of toxic ions increased in root system, it adversely affected the water potential of the leaves [38]. The regulation of stomatal membrane integrity and water adjustment was disturbed by the deficiency of potassium. As a result, there was a decrease in the respiration and photosynthesis which ultimately lowered the photosynthesis in plant tissues [39, 40]. Research by the other scientists also noted that the growth of rice crops was adversely effected under the salt stress. The emergence of panicle was found less affected by the salt stress; however, the panicle lengths and the number of tillers were seriously affected in rice. It has been observed that under salinity stress, the protein contents were reduced [41, 42], while the total free amino acids’ concentration increased under the salinity stress as reported in previous investigations [43]. The decrease in the concentration of protein, and the increase in the amino acids’ contents was also observed in chick pea plant against the salinity stress [44].
Conclusions
The study was conducted to determine the comparative effect of salinity stress on two rice cultivars. It was well evident that saline soils reduced the uptake of the essential nutrients by the antagonistic effects of ions with sodium and chloride which were more accumulated, and as a result, disrupted many physiological and biochemical pathways in rice plants. The saline soils also reduced the proteins, and increased the total free amino acids for osmotic adjustment in plant tissues. The current studies have proved that salt tolerant varieties might be used to get better plant growth in the salt affected areas, and might be used for further breeding purpose by the breeders. The data analysis indicated that rice genotype Basmati 515 showed better growth than genotypes Super basmati under saline and non saline conditions. So, rice cultivar Basmati 515 could be used in future plans to obtain the best yield in salt stress agricultural lands.
Conflict of interest
Authors would hereby like to declare that there was no conflict of interests that could possibly arise.
Acknowledgements
The authors would like to express their thanks to the department of Botany, GC (W) University, Faisalabad, Pakistan for supporting and providing the research facilities in this study and the Seed manager of AYUB Agriculture Research Institute (Government of Punjab, Pakistan) and Seed Certification Department of Pakistan for providing rice seeds of Super basmati and Basmati 515 cultivars.
References
1. Gupta, B and Haung, B (2014), “Mechanism of salinity tolerance in plants: physiological, biochemical and molecular characterization”, International Journal of Genomics, Article ID 701596, 1-18.
2. Arnauld, AT., Dulanto, PNR and Davies WJ (2016) “How can we improve crop genotypes to increase stress resilience and productivity in future climate? A new crop screening method based on productivity and resistance to abiotic stress”, Journal of Experimental Botany, 67, 5593-5603.
3. Singh, G (2009), “Salinity-related desertification and management strategies: Indian experience”, Land Degradation& Development, 20, 367-385.
4. Zafar, S., Ashraf, MY., Niaz, M., Kausar, A and Hussain, Z (2015), “Evaluation of wheat genotypes for salinity tolerance using physiological indices as screening tool”, Pakistan Journal of Botany, 47, 397-405.
5. FAO,2007: FAO Land and Plant Nutrition Management Service. http://www.fao.org/ag/agl/agll/spush
6. Ghoulam, C., Foursy, A and Fares, K (2002), “Effects of salt stress on growth, inorganic ions and praline accumulation in relation to osmotic adjustment in five sugar beet cultivars”, Environmental and Experimental Botany, 47, 39-50. 7. Sah, KR., Reddy, SK and Li, J (2016), “Abscisic acid and abiotic stress tolerance in plants”, Frontiers in Plant Science
7, 1-25.
9. Dubey, RS (2005), “Photosynthesis in plants under stressful conditions in: Handbook of photosynthesis”, Ed. M. Pessarakli. Marcel Dekker. Journal of New York, 11, 859-875.
10. Kausar, A., Ashraf, M., Ali, I., Niaz, M and Abbass, Q (2012), “Evaluation of sorghum varieties/lines for salt tolerance using physiological indices as screening tool”, Pakistan Journal of Botany,44, 47-52.
11. Kausar, A., Ashraf, M.Y., Gull, M., Ghafoor, R., Ilyas, M., Zafar, S., Niaz, M., Akhtar, N., Kanwal, H., Iqbal, N and Aftab, K (2016), “Alleviation of salt stress by K2SO4 in two wheat (Triticum aestivum L.) cultivars”, Applied Ecology and Environmental Research, 14, 137-147.
12. Ashraf, M (2006), Some important physiological selection criteria for salt tolerance in plants”, Flora 199, 361-376. 13. Ashraf, M.Y., Rafique, N., Ashraf, M., Azhar N and Marchand, M (2013), “Effect of supplemental potassium (K+) on
growth, physiological and biochemical attributes of wheat grown under saline conditions”, Journal of Plant Nutrition, 36, 443-458.
14. Parida, AK., Das, AB and Mittra, B (2009), “Effects of salt on growth, ion accumulation, photosynthesis and leaf anatomy of the mangrove, Bruguiera parviflora”, Journal of Trees Structure and Function, 18,167-174.
15. Dobbermann, A and Fairhurst, T (2005), “Rice. Nutrient disorders and nutrient management. Handbook series”, Potash & Phosphate Institute (PPI), Potash & Phosphate Institute of Canada (PPIC) and International, 191 p, ISBN, 9810427425.
16. Datta, SK (2004), “Rice Biotechnology: A Need for Developing Countries”, Ag Bio Forum, 7, 31-35.
17. Rashid, H., Bokahri, SYR and Qureshi, A (2001), “Callus induction, regeneration and hygromycin selection of rice (Super Basmati)”, Online Journal of Biological Science, 1, 1145-1146.
18. Aslam, M., Hussain, RS and Akhter, M (2008), “Effect of different stand establishment techniques on rice yields and its attributes”, The Journal of Plant Science, 18, 80-82.
19. Chutipaijit, S., Cha-um, S., Kanokporn SK (2011), “High contents of proline and anthocyanin increase protective response to salinity in Oryza sativa L. spp. Indica”, “Australian Journal of Crop Sciences 5,1191-1198.
20. Bouman, BAM., Peng, S., Castaneda, A.R and Visperas, RM (2005), “Yield and water use of irrigated tropical aerobic rice systems”, Agricultural Water Management, 74, 87-105.
21. Peng, S., Bouman, B., Visperas, R.M.A, Castaneda, L., Nie, Park, H (2006), “Comparison between aerobic and flooded rice in the tropics: Agronomic performance in an eight-season experiment”, Field Crops Research, 96, 252-259. 22. Hamilton, PB., Van Slyke, DD (1943), “Amino acid determination with ninhydrin”, Journal of Biology and Chemistry,
150, 231-233.
23. Lowry, OH., Rosebrough, NJ., Farr, AL and Randall, RJ (1951), “Protein measurement with folin phenol reagent”, Journal of Biology and Chemistry, 191, 265-275.
24. Wolf, B (1982), “A comprehensive system of leaf analysis and its use for diagnosing crop nutrient status”, Communication of Soil Science and Plant Analysis, 13, 1035-1059.
25. Tavallali, V., Rahemi, M and Kholdebarin, B (2009), “Ameliorative effect of zinc on pistachio (Pistacia vera L.) growth under salt-affected soil conditions”, Research Journal of Environmental Sciences, 3, 656-666.
26. Solangi, S., Aisha S., Mumtaz, S and Raza, K (2005), “Salinity Effects on seedling growth and yield components of different inbred rice lines”, Pakistan Journal of Botany, 37, 131-139.
27. Siringam, K., Juntawong, N., Cha-um, S and Kirdmanee, C (2011), “Salt stress induced ion accumulation, ion homeostasis, membrane injury and sugar contents in salt-sensitive rice (Oryza sativa L. spp. indica) roots under isoosmotic conditions”, African journal of Biotechnology, 10, 1340-1346.
28. Kao, WY., Tsai, HC and Tsai, TT (2001), “Effects of NaCl and nitrogen availability on growth and photosynthesis of seedlings of a mangrove species, Kandelia candel (L.)”, Journal of Plant Physiology 158, 841-846.
29. Essa, TA (2002), “Effect of salinity stress on growth and nutrient composition of three soybean cultivars”, Journal of Agronomy and Crop Science, 188, 86-93.
30. Kapoor, RT (2011), “Salinity-induced changes in germination biomass and physiological characteristics of Oryza sativa L. “International Conference on Advances in Biotechnology and Pharmaceutical Sciences, Bangkok”, 208-211. 31. Rafii, MY., Mondal, MM., Puteh, AB and Malek, MA (2013), “Salinity induced morpho-physiological characters and
yield attributes in rice genotypes”, Journal of Food, Agriculture and Environment, 11, 610-614.
32. Amirjani, MR (2010), “Effect of NaCl on some physiological parameters of rice”, European Journal of Biological Science, 3, 06-16.
33. Kausar, A and Gull, M (2014), “Effect of potassium sulphate on the growth and uptake of nutrients in wheat (Triticum aestivum L.) under salt stressed conditions”, Journal of Agricultural Science, 6, 101-112.
34. Kaya, C., Kirnak, H., Higgs, D., 2010: Enhancement of growth and normal growth parameters by foliar application potassium and phosphorus in tomato cultivars grown at high (NaCl) salinity. Journal of Plant Nutrition 24, 357-367. 35. Sohan, D., Jasoni, R and Zajicek, J (2006), “Plant-water relations of NaCl and Calcium-treated sunflower plants”,
Journal of Environmental and Experimental Botany, 42, 105-111.
37. Rezaei, M., Hassan, E and Farshid, A (2012), “Response of rice to different salinity levels during different growth stages”, Journal of Applied Science, 4, 3040-3047.
38. Bar, Y., Kafkafi, U and Lahav, E (2006), “Nitrate nutrition as tool to reduce chloride toxicity in avocado”, African Journal of Biotechnology, 10, 47-48.
39. Bayuelo-Jimenez, JS., Debouck, DG and Lynch, JP (2006), “Growth, gas exchange, water relations and ions composition of phaseolus species grown under saline conditions”, Field Crops Research, 80, 207-222.
40. Pessarakli, M., Szabolcs, I (2000), “Soil salinity and sodicity as particular plant/crop stress factors. In: Handbook of Plant and Crop Stress”, 2nd ed. (Ed. M Pessarakli). Marcel Dekker Press, New York, 1-15.
41. Razi, M., Momayezi, MR., Zaharah, AR and Hanafi, MM (2010), “Amino acids status in iranian rice (Oryza sativa L.) as affected by different salt compositions”, Journal of Plant Science, 4, 9972-9984.
42. Sharpley, AN., Meisinger, JJ., Power, JF and Suarez, DL (1992), “Root extraction of nutrients associated with long-term soil management”, In: Advances in soil science. Ed. B. Stewart. Springer, 72, 151-217.
43. Soussi, M., Ocana, A and Lluch, C (1998), “Effects of salt stress on growth, photosynthesis and nitrogen fixation in chick-pea (Cicer arietinum L.)”, Journal of Experimental Botany, 49, 1329-1337.