INTRODUCTION
Landfill gas, a mix of primarily carbon dioxide (CO2) and methane (CH4), is emitted as a result of anaerobic condition during the decomposition of organic fraction of waste in landfills. Methane is the second largest contributor to global warming among anthropogenic Green House Gases (GHG), after carbon dioxide. The global warming potential of methane (over a 100 year time horizon) is 21 times greater than that of carbon dioxide. Waste sector was contribute 4% of the global methane emissions and will increase as the increasing amount of the waste [UNEP, 2012].
Malang is the second biggest city and well known as educational and tourism city in East Java, Indonesia. Malang which is located in the south of Surabaya, the capital of East Java, has a geographical location of 7.06° – 8.02° S latitude and 112.06° – 112.07° E longitude [SMC, 2012]. Its total area is 110.06 km2 and it is situated on the upstream of the Brantas River, the biggest and the longest river in East Java. It has population of 0.835 million in 2012 with density of population is about 7,453 peoples per km2 and the average growth rate of population in the last five years is 0.82% [SMC, 2012]. Population growth and urbanization cause the increasing amount of the waste which becomes a
QUANTIFICATION OF GREENHOUSE GAS EMISSIONS FROM MUNICIPAL
SOLID WASTE RECYCLING AND DISPOSAL IN MALANG CITY INDONESIA
Sunarto Sunarto1, 2, Purwanto Purwanto1, 3*, Sudharto P. Hadi1, 4
1 Doctoral Program of Environmental Science, School of Postgraduate Studies, Diponegoro University, Imam Barjo Str. 5, Semarang 50241, Indonesia
2 Department of Civil Engineering, Muhammadiyah University Malang, Raya Tlogomas Str. 246, Malang 65144, Indonesia
3 Department of Chemical Engineering, Faculty of Engineering, Diponegoro University, Imam Barjo Str. 5, Semarang 50241, Indonesia
4 Department of Business Administration, Diponegoro University, Imam Barjo Str. 5, Semarang 50241, Indonesia
* Correspondence author’s e-mail: p.purwanto@gmail.com Volume 18, Issue 3, May 2017, pages 74–82
DOI: 10.12911/22998993/70237 Research Article
ABSTRACT
Increased waste generation due to population growth and increasing consumption pat-terns cause pollution, including pollution in global scale due to the emission of meth-ane (CH4) and carbon dioxide (CO2) from the waste in the landfill. The study purposed to analyze the GHG (Green House Gases) emission generated by solid waste manage-ment in Malang in 2012 and in the next 10 years through the application of waste recycling from upstream to downstream. The production of methane (CH4) in landfill were analyzed using the model equations developed by IPPC (2001) and the reduc-tion of the GHG from recycling were analyzed using GHG emission factors. Dynamic model of the GHG emission was developed to analyze and to predict GHG emission from recycling and dumping activity. The GHG emissions of waste management in 2012 (Scenario 1) is 192,291.19 tCO2e and in the next 10 years is 254,548.93 tCO2e (>32.19%). Application of Scenario 2 and Scenario 3 in the next 10 years produces GHG emission 134,290.38 tCO2e (<30.16%) and 37,741.56 tCO2e (<80.37%).
Keywords: integrated solid waste management, recycling, GHG emissions Received: 2017.03.04
problem faced by the Government of Indonesia [Meidina & Gamse, 2010]. Major cities in Indonesia produce nearly 10 million tonnes of waste annually, and this amount increases by 2 to 4% annually [ME, 2008].
Due to rapid growth of population, industri -alization, urbanization and growth of economic, many cities in Asian developing countries face severe waste management problem. The common problems are: no separation at source, complicated collection processes, open dumped landfills, and no control of gas emissions and leachate in land -fill [Dhokhikah & Trihadiningrum, 2012]. Since solid waste management (SWM) is a multidimen -sional challenge faced by big cities [Anschutz et al., 2004], the author proposes three dimensions in SWM: 1) the stakeholders involved in and af -fected by waste management, 2) the (practical and technical) elements of the waste system, and 3) the sustainability aspects of the local context that should be taken into account when assessing and planning waste management system.
Like many cities in developing countries, final disposal area or landfill is the main element of existing waste system applied by a lot of big cities and metropolis in Indonesia. About 68.6% of the municipal solid waste (MSW) is disposed in the landfill and mostly open dumping and the rest of the wastes is recycled and composted, open burned, and disposed around the residential areas [ME, 2008]. The reduction of the volume of waste was carried out by the comunity and by the city government to take inorganic waste for recycling and organic waste to be composted. The collection of waste materials for recycling is usually also done by scavengers. However, the reduction of waste volume by the scavenger is relatively small. In landfill Basirih Banjarmasin in Kalimantan, for example, a scavenger is only able to take 3.49% of the total waste volume [Mahyudin et al., 2015]. Therefore, in many cases most of solid wastes are dumped in open air where GHG emissions occur along with odors, public health and environmental degradation. Recycling of waste will reduce the volume of waste disposed to landfill. Directly, this will reduce the pollution from landfill, including global pollution due to reduced GHG emissions [Fikri et al., 2015]. While indirectly, recycling also reduces GHG emissions because these activities will reduce the use of natural raw materials and reduces energy consumption from fossil fuels.
MATERIAL AND METHODS
In this study attempts were made to estimate the methane emission and potential of electricity generation from disposed MSW in landfills of Malang city. In addition, reviews on the generation, characterization of MSW and landfill management and processes is also discussed. A field investigation was carried out at the transfer station and final disposal site to observe solid waste processing practice. Sampling of solid waste composition in different areas is done in January – February 2011 by Ministry of Public Works and KFW [MPW, 2012]. The density and water content of waste at the collection point was also determined. The secondary data were also collected from the Government of Malang City and reputed journal to achieve the goal of this study. Population data have been collected from population census by Statistic of Malang City (SoM) [SMC, 2012].
The system dynamics modeling approach has been used to quantify the GHG emission from municipal solid waste (MSW) in Malang. GHG emission from recycling were analyzed using GHG emission factors [Ifeu, 2009]. A simple method proposed by the Intergovernmental Panel on Climate Change (IPCC) [Houghton et al., 1998] has been used to estimate the methane emission from the MSW in the landfill.
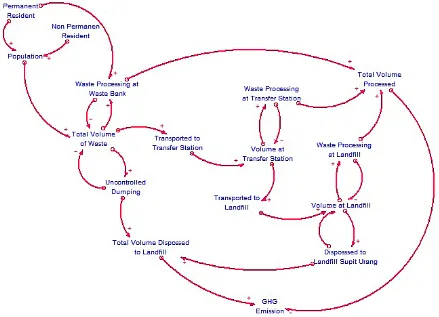
Figure 1 shows the causal loop diagram developed by incorporating the essential elements of municipal solid waste management system. The diagram consists of elements and arrows, and explains the existing feedback mechanism among the interrelated elements of the MSWM system.
The arrows, called as the causal links, include a sign (either + or −) on each link, indicate the effect of one element on the other. The link will be considered positive (+) if an increase or decrease in one element causes a change in the same direction in the other element, or negative (−) if an increase or decrease in one element causes a change in the opposite direction. These linkages complete small negative and positive feedback loops to represent the dynamic structure of the complete system. The polarity of the loop is the product of sums of its links.
types of variables, which are the main building blocks of the stock flow diagram: stock, flow and auxiliary. Stock variable, symbolized by rectangles is an accumulation of something in the system. The flow variable symbolized by double lined arrow with valves represents activities responsible for the rate change in physical and information flows to and from the stocks. The third variable called as auxiliary symbolized by the circle, is for transformation of the information from stock variable to the flow variable. This is an intermediate variable used for miscellaneous calculations. The diamonds represents constants, which do not vary over the period and are defined with an initial value. The switch control is to change the initial values of constants, auxiliaries and stock variables to select the alternative strategies. The single arrow represents the cause and effect links within the model structure. The detailed stock flow diagram of MSWM model is given in Figure 2. The description of MSWM model is given in the following section. The MSWM system is divided into two subsystems: (a) waste generation subsystem depicting the interaction of MSW generation and population, and (b)
Figure 1. Causal loop diagram of municipal solid waste management
:
waste collection and recycling subsystem at households and waste bank (Figure 2).
In the present study, MSW is defined as the waste generated by households, shops, offices, restaurants, hotels, markets and street sweepings, collected and processed by the MCD. The amount of MSW generated (MSWG) is considered to be the product of two variables: the population (P) and the per capita waste generation (MSWPC). The population is taken as the stock variable, which depends on the variation of population growth rate and population growth multiplier. The other variable per capita waste generation has been taken as the auxiliary variable increasing with step function. It is assumed that the per capita MSW generation will rise with a growth factor, depending on economic growth, urbanization rate and the living standard of the residents. The annual MSW generation, population generation is computed using the following equations:
of MSW left for collection. The amount of MSW Recycled (MSWR) is calculated by the fraction of recyclables (Fr), which reflects the economic growth of society. The recycling rate (Rr) depending on recycling efficiency (EffR) would influence the amount of MSW unrecycled (MSWunr), which is disposed in landfills. The fraction left after recycling, i.e. recycling residue and unrecycled fraction will also contribute to the amount of MSW for final disposal in landfilling. The GHG emission from MSW recycling depends on the quantity of recycled waste and the emission factor (Ef).
GHGr = M × EFemission – M × EFavoided emission (3)
where: M = mass of waste reccycler(tonne), EFemission = GHG emission factors for re -cycling (emission) (kg CO2-eq/t waste), EFavoided emission = GHG emission factors for recycling (avoided emission) (kg CO2 -eq/t waste)
The GHG emission from landfill is obtained by multiplying methane emissions with global warming potential of 21. Methane emission from the various organic compounds of waste has been estimated by the method proposed by IPCC [Houghton et al., 1998]:
Methane (CH4) emissions = MSWT × MSWF × MCF × DOC ×
× DOCF× F ×16/12 (tons) (4) where: MSWT = Total MSW generation (tones)
MSWF = Fractions of MSW disposed of to landfills
MCF = Methane correction factor
DOC = Fraction of degradable organic carbon
DOCF = Fraction of total DOC that actu -ally degrades,
F = Fraction of methane in LFG.
The default values (0.4 to 1.0) for MCF are dependent on the types of MSW landfill practices. If most of the landfills under consideration are unmanaged, a value of about 0.6 can be used [Tsai, 2007]. According to IPCC, DOC ranges from 0.08 to 0.21, considering the characteristics of waste DOC value is taken as 0.17. Furthermore, the DOCF should be considered because the biodegradation of DOC does not occur totally over a long period; therefore, a default value of 0.77 can be used. The fraction of methane gas in landfill gas that is captured, either for flaring or power generation, also assumes as 0.5. Oxidation factor takes into account of the oxidation potential from the landfill cover. The IPCC guidelines Figure 2. Stock flow diagram of municipal solid waste management model Subsystem diagrams: a – municipal
enhanced the methane estimation by considering wastes that has been deposited over the years. It assumes the decomposition of the waste according to first order decay reaction.
Scenario description
The GHG emission is estimated for MSWM system of Malang including the proposed policy options for 10 years starting from the year 2012. The scenarios developed are Scenario 0, Scenario 1, Scenario 2, and Scenario 3 that depend on the recycling rate (Table 1).
1) Scenario 0; i.e the MSWM in the city of Malang just rely on the element Supit Urang landfill as final disposal and there is no waste recycling activities.
2) Scenario 1; i.e the MSWM in the city of Malang in 2012 (existing) where waste recycling has been carried out both by residents in 66 neighborhoods and in the 206 unit of waste bank and by managers at 11 transfer stations of the 62 transfer stations and at landfill Supit Urang with recycling capacity is relatively small.
3) Scenario 2; i.e waste recycling has been increased by residents in 360 neighborhoods and in the 1,076 unit of waste bank and by managers at 10 transfer stations that have area > 150 m2 and at landfill Supit Urang.
4) Scenario 3, i.e waste recycling rate increased twice than of scenario 2 by residents in 544 neighborhoods and in the 2,146 unit of waste bank and by managers at 21 transfer stations that and at landfill Supit Urang.
RESULTS AND DISCUSSION
The quantities of solid waste generation and collected are very important in determining SWM options by local government including disposal facilities [Tchobanoglous et al., 1993]. In general, the amount of waste generation in the developing countries is determined on the basis of per capita
waste generation factors. Waste generation rates are also related to economic status of the country as well as population. Economic development, urbanization and improving living standard in cities of developing countries have led to an increase in the quantity of municipal solid waste. Developed nations are characterized by higher rates of waste generation per capita; while developing nations generate less waste and practice informal recycling that reduce the waste per capita to be collected at the municipal level. Urbanization, Gross Domestic Product per capita (GDP per capita), illiteracy/level of public awareness, and sanitary services are responsible for waste generation [Khajuria et al., 2010]. In Indonesia, urban population has been increasing and the human activities of growing population produce the waste generation. The total population of Indonesia is around 232.6 million [ME, 2008]. About 17.2% of the total population who lived in 26 urban centres produce nearly 38,630 tons per day and 14.1 million tons of waste annually at the rate of 0.47 kg/capita/day [ME, 2008]. The total municipal solid waste generation in Malang was estimated by multiplying the solid waste generation rate by the population. According to SoM 2012 data, total population of Malang city in 2012 was 835,082 peoples [SMC, 2012] and taking into account per capita waste generation 0.45 kg/ day [METI, 2012], total MSW generation was 469.73 tons/day. The total waste generation in Malang city according to per capita waste generation is presented in Table 1. It is also assumed that factor taking the impact of students and tourists into consideration in addition to the registered population is 25%. The total of MSW recycled/composted and total of MSW disposed in the landfill are 60 tons/day and 336.65 tons/ day respectively [METI, 2012]. The 2012 census population figures were used and the projected population was estimated using a population growth rate of 0.82% [SMC, 2012].
Table 1. Scenario of carbon footprint control based on waste processing
Location
Percent Processing (%)
Scenario 0 Scenario 1 Scenario 2 Scenario 3
O I O I O I O I
Waste bank - - - 2.40 - 12.50 - 25.00
Resident - - 0.50 1.80 7.50 15.00 15.00 30.00
Transfer station - - 3.89 8.06 15.00 20.00 30.00 40.00
Landfill Supit Urang - - 0.35 1.54 35.00 20.00 70.00 40.00
Municipal SWM systems need to characterize the types and quantities of material disposed for choosing the management option of waste. As local governments rely more on source reduction, recycling, composting, and waste-to-energy (WTE) technologies, reliable data about what is in the waste stream is very essential to the waste management program’s success [Cheremisinoff, 2003]. The characteristics of MSW are directly influenced by the socio-economic conditions, cultural activities, seasonal and geographical conditions as well. The physical composition of household waste in Malang city is presented in Figure 3 [MPW, 2012]. Like many cities in developing countries, it is observed that the organic matter or biodegradable fraction is usually the major component in the waste stream in Indonesia due to the type and habit of vegetable consumption. It’s socio-economic condition is also very much responsible for the very high percentage of organic component. The rapidly biodegradable portion is normally very high, compared to other portions, essentially due to the use of fresh vegetables and fruits. The organic content of MSW in Malang is 64.9 and the moisture content varied from 60.6 to 66.8% [MPW, 2012]. High moisture content causes biodegradable waste fractions to decompose more rapidly than in dry conditions. Base on the heating value of solid waste components [Brunner, 2002], the calorific value of solid waste in Malang is around 1,800 kJ/kg. Waste of Malang city with high share of organic matters and also high moisture content would be not well suited for incineration or any other kind of thermal treatment. Some studies
reported that calorific value for incinerated waste should not fall lower than 6,000 kJ/kg [Rand et al., 2000] otherwise, additional fuel is necessary to maintain combustion.
Solid waste must be sustainably managed with comprehensive approach [Mc Dougall et al., 2001]. In other hand purposed that sustainable integrated SWM related to three important dimensions in waste management: (1) the stakeholders involved in and affected by waste management, (2) the (practical and technical) elements of the waste system and (3) the sustainability aspects of the local context that should be taken into account when assessing and planning a waste management system [Anschutz et al., 2004]. In general, SWM in Malang city is well organized and sustainable integrated solid waste management practice have been applied related to comprehensive approach and three important dimension of integrated SWM [Anschutz et al., 2004; Mc Dougall et al., 2001]. There is a separate department directly responsible to the mayor of Malang city for managing the MSW. Some activities in the waste system elements are waste reduction activity at source, composting activity in temporary disposal area, and methane gas capturing for flaring and cooking in the landfill of Supit Urang. However, SWM in Malang is still dependent on disposal area as final element of waste system since most of the MSW generated in Malang still disposed to the landfill.
Around 0.84 million people live in Malang city area (110.06 km2). They produce about 469.73 metric ton wastes/day [METI, 2012]. Wastes, which are, dropped into the primary
disposal bins in front of the house, are carried to the secondary collection points by carts. For the secondary collection system, about 1,883 cars are employed to carry these wastes to 62 secondary waste disposal points in Malang area. Wastes are finally transported from secondary point to the final waste disposal point by dump trucks and arm-roll truck. About 43 trucks are employed in order to transport these wastes to the final disposal point. There are 12 secondary disposal points with composting facilities. The local government also has a waste bank founded in 2011 to collect recycled waste from the resident of Malang city. In 2012, the member of waste bank are 201 groups of households consist of 6,271 households, 161 schools, 19 offices, and 275 households [GMC, 2012]. Everyday, this waste bank collect 2,5 tons recycled waste. Wastes are also recycled from the secondary disposal points as well as the final disposal points by the waste pickers. Around 60 tons or 12.8% of the daily waste are recyled in these cities. About 336.65 metric ton/day wastes are collected and disposed off in the waste disposal area. The collection of rate of MSW in Malang city was around 84.44% [METI, 2012]. Final disposal site is located in Supit Urang, 8 km west of Malang city centre. This landfill started operation at 1993 and it is expected to have a lifespan of 30 years and will be closed in 2023 but due to extension of landfill from 15.0 hectares to 25.2 hectares it is predicted the landfill will reach its maximum capacity at the end of 2042. The landfill was designed as controlled landfills. There is a regular soil cover application and leachate treatment but landfill gas emissions released to the atmosphere with a little treatment. Methane gas has been capture at some cells of
the landfill and used for cooking of about 300 households around the landfill of Supit Urang.
The results of the simulation comparison of GHG emissions from the four scenarios analyzed with models that have been developed are presented in Figure 4 for a comparison of GHG emissions and waste management Figure 5 for the overall GHG emissions of waste processing. In Scenario 0, at the end of the simulation, GHG emissions are 272,685.70 ton CO2e. While Scenario 1, GHG emissions are 257,548.93 ton CO2e. Scenario 1 is the condition in 2012 in which the waste processing activities have been conducted, both by society and by the government of Malang conducted at the transfer stations and landfill Supit Urang. Reduction of GHG emissions from the processing activity is 3,351.74 CO2 eq or equal to 7.27% of Scenario 0.
In Scenario 2, waste processing capacity in -creased by the community and by the Govern -ment of Malang conducted in transfer stations where have sufficient area and in the landfill Supit Urang. At the end of the simulation, the reduction of GHG emissions from waste processing activ -ity is 17,522.60 ton CO2e. While GHG emissions from the landfill is 151,812.98 ton CO2e. In total, GHG emissions are reduced 134,290.38 ton CO2e or 47.27% of Scenario 1. GHG emission reduc -tions are quite large due to the volume of waste in the landfill Supit Urang are significantly reduced.
In Scenario 3, waste processing capacity in -creased 2 times greater than the capacity of pro -cessing on Scenario 2. At the end of the simulation, the reduction of GHG emissions is 28,390.88 ton CO2e. GHG emissions at the landfill is 66,132.43 ton CO2e. In total, GHG emissions are reduced 37,741.55 ton CO2e or 85.15% of Scenario 1.
GHG emissions reduced very large because the volume of waste in the landfill Supit Urang was significantly reduced because of enhancing the capacity of waste processing by society and by the government of the city of Malang.
CONCLUSION
1. The results of the analysis of the GHG emission of MSWM based on recycling in Malang show that the GHG emission in 2012 (Scenario 1) is 192,291.19 ton CO2e, lower than the total GHG emission on the condition where there is no waste reduction from recycling (Scenario 0), in the amount of 206,277.65 ton CO2e or reduced by 7.27%. The GHG emission in the next 10 years (Scenario 1) is 254,548.93 ton CO2e, higher than the GHG emission of Scenario 1, in the amount of 192,291.70 ton CO2e or increased by 32.19%.
2. The reduction of GHG emission of MSWM can be done by applying two scenarios to improve the recycling capacity. Application of Scenario 2, in the next 10 years, GHG emission generated is 133,219.69 ton CO2e, 30.16% lower than the GHG emission of Scenario 1. Application of Scenario 3, at the next 10 years, GHG emission generated is 37,741.55 ton CO2e, 80.37% lower than GHG emission of Scenario 1.
The model developed based on the calculation represent the data very well. By comparing the simulation results of the four scenarios, Malang government can plan the reduction of
greenhouse gas emissions by improving waste recycling program gradually in all elements of waste management, both in the community, at the transfer station, and at landfill Supit Urang.
Acknowledgement
The authors want to show their deepest gratitude to those who helped in this research, especially to the officials of Malang City goverment who concerned with municipal waste management.
REFERENCES
1. Anschutz J., Ijgosse J., Scheinberg A. 2004. Put-ting integrated sustainable waste management into practice. Waste Netherland.
2. Brunner C.R. 2002. Waste-to-energy combustion, part 13a incineration technologies. In: Handbbok of Solid Waste Management (Eds G. Tchobano-glous, G. and F. Kreith) McGraw-Hill Companies, pp. 13.4–13.7.
3. Cheremisinoff N.P. 2003. Handbook of solid waste management and waste minimization technologies. Butterworth Heinemann.
4. Dhokhikah Y., Trihadiningrum Y. 2012. Solid waste management in Asian developing countries: chal-lenges and opportunities. Journal of Applied Envi-ronmental and Biological Sciences, 2(7), 329–335. 5. Fikri E., Purwanto P., Sunoko H.R., 2015.
Model-ling of household hazardous waste (HHW) man-agement in Semarang city (Indonesia) by using life cycle assessment (LCA) approach to reduce greenhouse gas (GHG) emissions, Procedia Envi-ronmental Sciences, 23, 123–129.
6. GMC (Government of Malang City). 2012.
ra’s non-physical data of Malang city 2012/2013. 7. Houghton J.T., Filho L.G.M., Lim B., Treanton
K., Mamaty I., Bonduki Y., Griggs D.J., Callen-der B.A. 1998. Revised 1996 IPCC guidelines for national greenhouse gas inventories. UK Meteoro-logical Office.
8. Ifeu (Institut für Energie). 2009. Manual SWM-GHG calculator-tool for calculating Greenhouse Gases (GHG) in Solid Waste Management (SWM). Frankurt: KfW Bankengruppe Communication Dept. 9. Khajuria A., Yamamoto Y., Morioka T. 2010. Es-timation of municipal solid waste generation and landfill area in Asian developing countries. Journal of Environmental Biology, 31 (5): 649-654. 10. Mahyudin R.P., Hadi S.P., Purwanto. 2015. Waste
reduction by scavengers in Basirih landfill Banjar-masin South Kalimantan Indonesia: waste compo-sition based analysis. J. Appl. Environ. Biol. Sci., 5(11), 118–126.
11. McDougall F., White P., Franke M., Hindle P. 2001. Integrated solid waste management : a life cycle inventory. Blackwell Science.
12. ME (The Ministry of Environment). 2008. Indone-sian domestic solid waste statistics year 2008. State Ministry of Environment Republic of Indonesia. 13. Meidina C., Gamse T. 2010. Development of waste
management practices in Indonesia. European
Journal of Scientific Research, 40(2), 199–210. 14. METI (The Ministry of Economy, Trade and
In-dustry). 2012. Study on the integrated waste to energy project in greater Malang. Hitachi Zosen Corporation, EX Research Institute Ltd., Smart Energy Co., Ltd.
15. MPW (Ministry of Public Works and German De-velopment Bank). 2012. Emission reduction in cit-ies – solid waste management: feasibility study for selected measures in Malang, Jombang, Jambi and result of additional tasks. Fichtner.
16. Rand T., Haukohl J., Marxen U. 2000. Municipal solid waste incineration, a decision maker’s guide. The International Bank for Reconstruction and De-velopment, World Bank.
17. SMC (Statistic of Malang City). 2012. Malang City in Figure 2012.
18. Tchobanoglous G., Theisen H. and Vigil S.A. 1993. Integrated Solid Waste Management: Engineering, Principles and Management Issues. McGraw-Hill International Editions.
19. Tsai W.T. 2007. Bioenergy from Landfill Gas (LFG) in Taiwan. Elsevier Renewable and Sustain-able Energy Reviews, 11(13), 331–344.