www.wjert.org 40
PERFORMANCE ANALYSIS OF EFFORT VARIANCE AND COST
VARIANCE INVOLVES DIFFERENT STAGES IN SOFTWARE
PROJECT BASED ON STATISTICAL METHOD
M. Mayilvaganan* and Aparna Srinivasan
1
Associate Professor: Department of Computer Science, PSG College of Arts and Science,
Coimbatore, Tamil Nadu, India.
2
Ph.D Research Scholar, Department of Computer science Karpagam University,
Coimbatore, Tamil Nadu, India.
Article Received on 15/12/2015 Article Revised on 08/01/2016 Article Accepted on 30/01/2016
ABSTRACT
In this research work focuses an effort variance and cost variance is an
important metrics parameter which needs to be more focused an
optimization of effort and cost variance is a very significant factor
which influences internal organization driven and customer driven
goals. Further, predicting the success of software projects based upon
information related to Estimation of planned effort and actual effort
and planned cost and actual cost is deemed to be one of the vital
activities in software engineering research. In this research work focus
to apply regression model for analyzing the quality based on estimated
value and actual value to achieve better result from the model.
Keywords: Estimation value; Actual value; Effort variance; cost variance; Regression model.
INTRODUCTION
Data of this type is vital to understand the current testing effort and review how it was
conducted previously and consider how to make improvements in the future.[7] Various
groups and individuals within the organization and clients require this information in support
of their own activities and decision making. It enables organizations to improve the quality of
World Journal of Engineering Research and Technology
WJERT
www.wjert.org
*Correspondence for Author
Dr. M. Mayilvaganan
Associate Professor:
Department of Computer
Science, PSG College of
Arts and Science,
Coimbatore, Tamil Nadu,
India.
www.wjert.org 41 management decision making by ensuring that reliable and secure information and data is
available throughout the Software lifecycle.[9, 10] The objective of this metric is to study the
distribution of workload by Stage and to reduce the deviation of the actual effort expended as
against the estimated effort. The cost measure is in terms of effort which is measure the effort
spent on reviews, testing and rework against the production effort.
RELATED WORK
Background information on software project models and software metrics to be used for
effort and cost estimation. No model can estimate the cost of software with high degree of
accuracy. Estimation is a complex activity that requires knowledge of a number of key
attributes. At the initial stage of a project, there is high uncertainty about these project
attributes. As we learn that BBNs are especially useful when the information about the past
and/or the current situation is vague, incomplete, conflicting, and uncertain. Conventional
estimation techniques focus only on the actual development effort furthermore; this paper
also described test effort estimation.[1]
Many construction projects suffer from time and cost overruns due to a multiplicity of
factors. Earned value management (EVM) is a project performance evaluation which has
been adapted for application in project management. This technique helps in comparison of
budgeted cost of work to actual cost.[2,3,6] The present study deals with the scheduling and
project monitoring process along with it also discusses main parameter’s involving in the
calculation of earned value analysis in cost and time management of civil construction
project. Methodologies and analysis are demonstrated in this paper using an example of real
time project. Primavera P6 software can be used for project planning and EVM calculations.
DATA FOR RESEARCH
In this paper the research work focuses the cost variance and effort variance of project using
estimated value and actual value parameters which could be calculated based on the equation
1 and 2. Then the variance can be analysing based on statistical method. Also using
regression analysis for analyzing the scheduled for a 50 project task of performance and
variance of estimated value for planning stage, Designing stage, Building stage, User
Acceptance test (UAT) stage, System Integrating Test (SIT) stage, Integration testing and
implementation stage. Here the table 1 to 4 represents the sample training data of finding the
www.wjert.org 42
Actual Effort - Estimated Effort
Effort variance= *100
Estimated Effort (1)
Actual Cost - Estimated Cost
Cost variance= *100
Estimated Cost (2)
Table 1. Sample Training Data Set of Effort.
Planning Designing
Estimated Effort Actual Effort Estimated Effort Actual Effort
437.71 437.71 603.84 646.84
328.29 328.29 422.69 822.68
1382.964 1382.964 1,382.96 1518.934 1222.1975 1222.1975 1,222 1382.7105
365 365 470.6 495.88
101.4 101.4 111.8 112
169 169 186.33 187
259.995 259.995 365.23 365.23
363.7 363.7 545.55 545.55
363.7 363.7 385.23 395.23
636 636 729 729
173.33 173.33 693 606
244.196 244.196 488.393 488.393
66.1 66.1 99.15 99.15
182 182 273 273
437.71 437.71 86.67 81
Table 2. Sample Training Data Set of Effort Contd.
SIT UAT
Estimated Effort Actual Effort Estimated Effort Actual Effort
3,071.37 3211.86 933.14 1010.37
2,233.73 2,374.22 678.65 755.88 1,544.98 1,652.23 595.1808 595.3312 1,892.99 2,064.35 405.396 476.2936
705.71 725.64 235.23 241.88
415.99 415.99 252 252
208 208 189 189
415.99 415.99 653.12 878.49
545.55 545.55 545.55 545.55
732 732 189 189
732 732 724 510.6
953.32 87 252 252
1190.69 189 189
99.15 99.15 99.15 99.15
273 273 273 273
www.wjert.org 43 Table 3. Sample Training Data Set of Effort Contd.
Integrating Test stage Implementation Stage Estimated Effort Actual Effort Estimated Effort Actual Effort
132.06 135.51 33.02 33.88
99.04 102.49 24.76 25.62
371.99 380 521 530
253.37 260 355 360
58.80 60.47 22.041 22.041
60 60 159.46 160
45 45 119.6 120
60 60 94.2 169.56
181.85 181.85 181.85 196.55
58.80 60.47 181.85 194.55
60 60 102.15 113.53
45 45 102.15 114.32
60 60 43.83 43.83
33.05 33.05 33.05 33.05
91 91 91 91
132.06 135.51 208 208
Table 4. sample training data set of Cost of planning and Designing Stage.
Planning Designing
Planned Cost Actual Cost Planned Cost Actual Cost $20,627.74 $20,627.74 $47,052.84 $47,052.84 $15,470.80 $27,406.20 $34,220.24 $47,955.00 $49,095.22 $50,372.16 $105,644.59 $105,671.29 $43,388.01 $45,536.22 $71,957.79 $84,542.11 $12,967.52 $13,114.60 $52,730.00 $55,101.65 $4,263.53 $4,361.53 $17,995.88 $17,995.88 $7,700.32 $7,777.32 $13,820.82 $13,904.98 $10,220.40 $10,220.40 $93,436.55 $94,225.90 $18,171.38 $18,171.38 $54,514.13 $54,514.13 $18,171.38 $18,171.38 $93,436.55 $94,225.90 $22,896.00 $22,896.00 $59,400.00 $59,526.00 $6,228.00 $6,228.00 $46,800.00 $27,144.00 $10,207.18 $10,207.18 $70,982.41 $70,982.41 $3,335.90 $3,335.90 $10,007.70 $10,007.70 $7,708.57 $7,708.57 $23,125.70 $23,125.70 $883.64 $917.64 $4,860.00 $4,894.08 $1,762.42 $1,830.24 $9,693.31 $9,761.28
Metrics are parameters or measures of quantitative assessment used for measurement,
www.wjert.org 44 the distribution of workload by Stage and to reduce the deviation of the actual effort
expended as against the estimated effort.
RESEARCH METHODOLOGY
A. Statistical Analysis
In statistical analysis, Variance can be measures based on the equation 1 and 2. Effort
Variation metric is the difference between Estimated and Actual effort as compared against
the Estimated Effort.
Input/Measure Actual Effort Estimated Effort Actual Effort
Estimated Effort
Actual Cost Estimated Cost
(Actual Effort - Estimated Effort)/
(Estimated Effort) *100
(Actual cost - Estimated Cost)/
(Estimated Cost) *100
Estimated Effort =603.84 Actual Effort= 646.84 = (646.84-603.84)/ (603.84) * 100 = 7.120883
Estimated cost =$15,470.80 Actual Cost= $27,406.20 =(27,406.20-15,470.80)/ (15,470.80) * 100
= 77.1479
Cost Variance metric is the difference between Estimated and Actual cost as compared
against the estimated cost.
Benefits
• To determine the efficiency of effort planning.
• To determine the nature and extend of variances and related impact analysis on cost and
schedule.
EXPERIMENT AND RESULT
In good estimation, the actual value and predicted value agree very closely. In most cases a
linear regression line captures this close relationship, in which case slope of the regression
line is nearly equal to one. The coefficient of determination[8] R2 indicates estimation
capability of the model used for estimation. The R2 values which express goodness of fit of
the calibration curves can also indicate the estimation quality.
The value R2 is a fraction between 0.0 and 1.0, and has no units. An R2 value of 0.0 means
that knowing X does not help to predict Y. There is no linear relationship between X
(Estimated cost / effort) and Y (Actual cost/ effort), and the best-fit line is a horizontal line
www.wjert.org 45
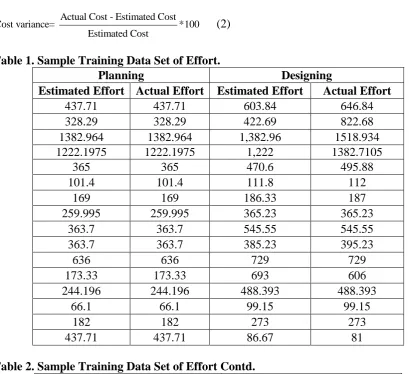
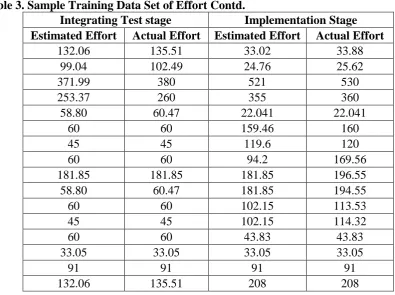
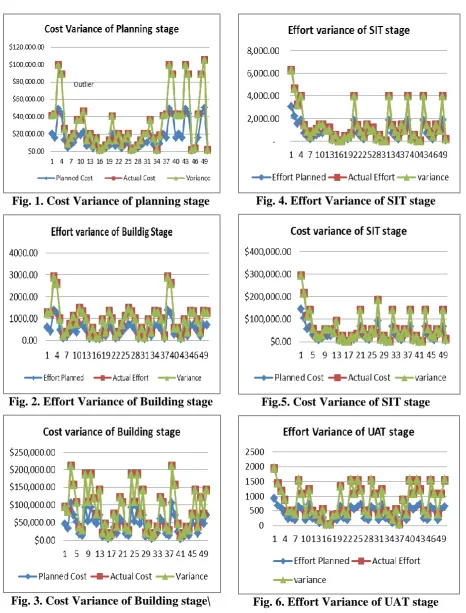
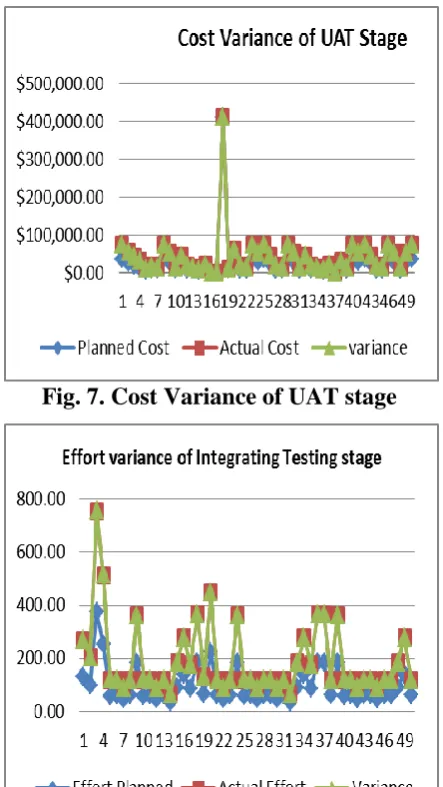
A. Statistical Analysis of Cost Variance and Effort Variance
From the fig. 1 to fig. 11 illustrates the variance of cost and effort of the project which can be
analysed based on the equation 1 and 2.[8] The outlier of the graph represents the more
variance from the planned / estimated effort and cost value of the project.
Fig. 1. Cost Variance of planning stage
Fig. 2. Effort Variance of Building stage
Fig. 3. Cost Variance of Building stage\
Fig. 4. Effort Variance of SIT stage
Fig.5. Cost Variance of SIT stage
www.wjert.org 46 Fig. 7. Cost Variance of UAT stage
Fig. 6. Effort Variance of Integrating Testing stage.
Fig. 9. Cost Variance of Integrating stage
Fig. 10. Effort Variance of Implemetation stage.
Fig. 11. Cost Variance of Implementation stage.
In the research work, Cost Variance (CV) is
a very important factor to measure project
performance. CV indicates how much over
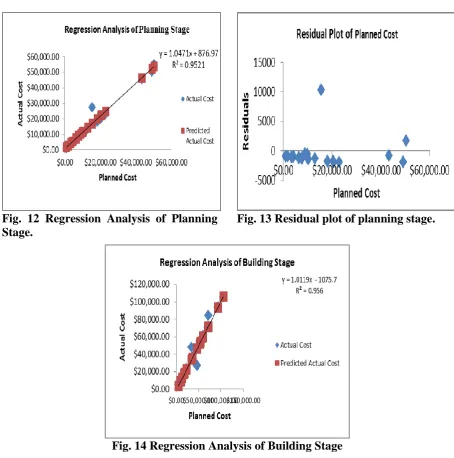
www.wjert.org 47 A. Regression Analysis of Cost Variance.
From the fig 12 represents the planned stage of the cost variance shows the linear regression
line [5] gives new calibration curve where the actual value is equal to the estimated value. The
R2 values which express goodness of fit of the calibration curves can also indicate the
estimation quality. The confidence level is 95.21 %, it’s come out with better estimation
process in maintenance.
Fig. 12 Regression Analysis of Planning Stage.
Fig. 13 Residual plot of planning stage.
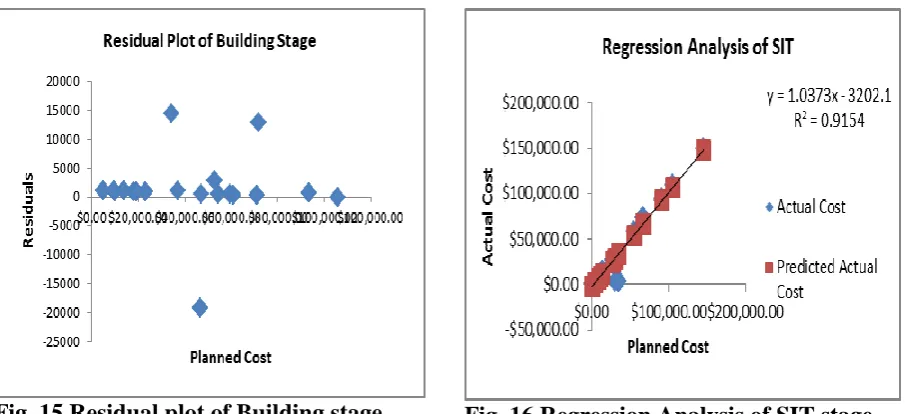
Fig. 14 Regression Analysis of Building Stage
From the fig 14 represents the Building stage of the cost variance shows the linear regression
line gives new calibration curve where the actual value is equal to the estimated value. The
R2 values which express goodness of fit of the calibration curves can also indicate the
estimation quality. The confidence level is 95.6 %, it’s come out with better estimation
www.wjert.org 48 Fig. 15 Residual plot of Building stage. Fig. 16 Regression Analysis of SIT stage.
From the fig 16 represents the SIT stage of the cost variance shows the linear regression line
gives new calibration curve where the actual value is equal to the estimated value. The R2
values which express goodness of fit of the calibration curves can also indicate the estimation
quality. The confidence level is 91.54 %, it’s come out with better estimation process in
maintenance.
Fig. 17 Residual plot of SIT stage Fig. 18 Regression Analysis of UAT stage
From the fig 18 represents the UAT stage of the cost variance shows the linear regression line
gives new calibration curve where the actual value is equal to the estimated value. The R2
values which express goodness of fit of the calibration curves can also indicate the estimation
quality. The confidence level is 91.54 %, it’s come out with better estimation process in
www.wjert.org 49 Fig. 19 Residual plot of UAT stage. Fig. 20 Regression Analysis of Integrating
stage.
From the fig 20 represents the Integrating stage of the cost variance shows the linear
regression line gives new calibration curve where the actual value is equal to the estimated
value. The R2 values which express goodness of fit of the calibration curves can also indicate
the estimation quality. The confidence level is 99.18 %, it’s come out with better estimation
process in maintenance.
Fig. 21 Residual plot of Integrating stage. Fig. 22 Regression Analysis of Implementation stage.
From the fig 22 represents the Implementation stage of the cost variance shows the linear
regression line gives new calibration curve where the actual value is equal to the estimated
value. The R2 values which express goodness of fit of the calibration curves can also indicate
the estimation quality. The confidence level is 99.94 %, it’s come out with better estimation
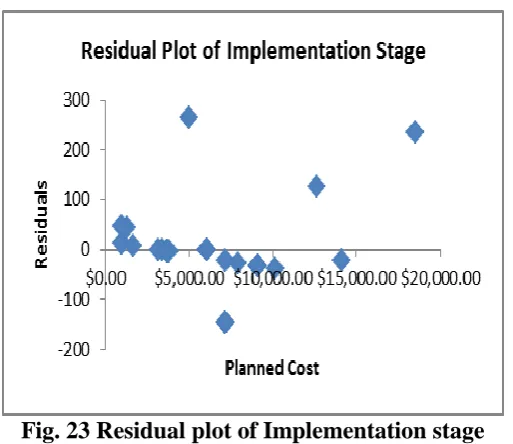
www.wjert.org 50 Fig. 23 Residual plot of Implementation stage
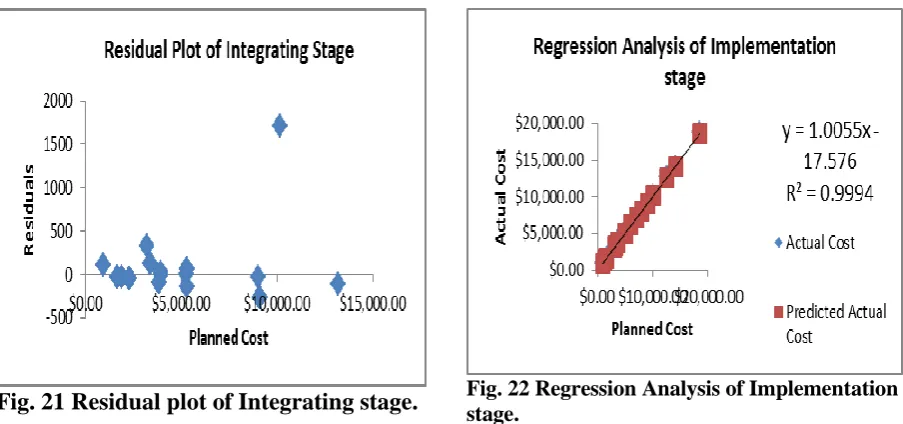
Residual plot also analyse the difference between the observed data of the dependent
variable y and the fitted values ŷ as shown in fig.13, fig 15, fig 17, fig 19, fig 21 and fig 23
which is represent the fitted values in different stage of the project work. The residual is
positive if the data point is above the graph. The residual is negative if the data point is below
the graph.
CONCLUSION
In this research work, it can be concluded that the Effort variance and Cost variance tracking
from beginning stage of the project through the end of the project, thereby consider as good
based on statistical analysis. The estimated values and actual values are plotted as scatter
diagram and regression analysed. R2 values express goodness fit of the calibration curves
which indicated the estimation quality attained higher than above 99% of better estimation,
yet the SIT and UAT task of project work estimate 91% of maintenance process. Cost
Variation metric is mainly used as an indicator for capability to meet milestones. For these
Cost (Budgeting Stage), residual plot also analyse the difference between the observed data
of the dependent variable y and the fitted values ŷ. Mostly the values are fitted from the plot
analysed as in positive where the data point is above the graph of each stage of the project
work.
REFERENCES
1. Cheng, M. Y., Peng, H. S., Wu, Y. W., & Chen, T. L. “Estimate at completion for
construction projects using evolutionary Support vector machine inference model’,
www.wjert.org 51 2. Measuring the Software Process: Statistical Process Control for Software Process
Improvement", William A. Florac and Anita D. Carlton, Addison-Wesley, 1999; ISBN
0-201-60444-2.
3. “Metrics and Models in Software Quality Engineering”, 2nd edition, Stephen H.Kan,
Addison-Wesley, 2003; ISBN 0-201-72915-6.
4. D.T. Larose, “Discovery Knowledge In Data: an introduction to data mining”, Published
by John Wiley & Sons, Inc., Hoboken, New Jersey, 2005.
5. S. Bibi,, G. Tsoumakas, I. Stamelos, I. Vlahavas, “Regression via Classification applied
on software defect estimation”, Elsiever, 2008; 34(3): 2091-2101.
6. Wang, Xiaoxu, Chaoying Wu, and Lin Ma. "Software project schedule variance
prediction using Bayesian Network." Advanced Management Science (ICAMS), 2010
IEEE International Conference on. Vol. 2. IEEE, 2010.
7. Kaner, Cem and Walter P. Bond Software Engineering Metrics: What Do They Measure
and How Do We Know?
8. Dr. S. Gupta, “ Statistical methods”, first Edition, published by Sultan Chand and sons,
1969; ISBN 978-81-8045-629-7.
9. Jin Yongqin, Li Jun, Lin Jianming, Chen Qingzhang, ”Software Project Cost Estimation
Based On Groupware”, World Congress on Software Engineering, IEEE, 2009.
10.Chen Qingzhang, Fang Shuojin, Wang Wenfu, ”Development of the Decision Support
System for Software Project Cost Estimation”, World Congress on Software Engineering,
IEEE, 2009.
Author Information
M. Mayilvaganan received MCA, PhD, in Computer Science currently an Associate Professor, Department of Computer Science in PSG College of Arts and Science, Coimbatore. He has more than 23 years teaching and research experience in the field of Computer Science. Also 3 years experienced as a System Manager in LNGS Yarn Marketing. His area of research includes data mining, big-data analysis and networking. He has published more than 25 research papers in international publications and 12 in IEEE journals.