Multi-objective optimization of the apple drying and
rehydration processes parameters
Radosław Winiczenko, Krzysztof Górnicki*, Agnieszka Kaleta, Monika Janaszek-Mańkowska, Jędrzej Trajer Faculty of Production Engineering, Warsaw University of Life Sciences, ul. Nowoursynowska 164, 02-787 Warszawa, Poland
*Corresponding author:
Krzysztof Górnicki, Faculty of Production Engineering, Warsaw University of Life Sciences, ul. Nowoursynowska 164, 02-787 Warszawa, Poland, E-mail: [email protected]
Received: 24 January 2017; Accepted: 29 January 2018
INTRODUCTION
Drying as a process is very complicated from the perspective of changes taking place in the dried material. Disadvantageous changes in the quality of the material frequently take place during the drying. Such changes include: crystallization or a change of the crystalline structure, shrinking, caking, loss of aromas, hindered rehydration, disappearance of plasticity, changes of shape and size (cracking, corrugations, holes). Drying also causes both disadvantageous chemical changes such as a reduction and loss of activity of reagents and the break-up of certain chemical compounds. Disadvantageous biochemical changes also take place during the drying as a result of irreversible biochemical reactions such as the oxidation of lipids, protein denaturation, Maillard’s enzymatic browning, oxidation (inactivation) of vitamins or the disintegration of microorganisms and biomolecules (Sacilik and Elicin, 2006). The key issue in the drying of raw materials turns out to be in the selection of parameters of the process, not only due
to energy intensity but also due to the final product quality.
As a rule, the use of convenient food requires its hydration. Rehydration is a complicated process aimed at
reinstatement, by way of contact with water, the features which the dried material had prior to its pretreatment preceding the drying and the drying itself. Three main processes taken place simultaneously during the rehydration: the imbibition of water into the dried material, the swelling and the leaching of soluble compounds (sugars, acids, minerals, vitamins). The progress of these processes depends on the features of the raw material, conditions of both drying and pretreatments processing the drying (Lewicki, 1998a). Other important aspects to be considered include the dehydration kinetics, structural
properties such as apparent density, specific volume and
internal porosity (Krokida and Philippopoulos, 2005).
The progress of the rehydration process reflects changes
that have been in the raw material tissue as a result of the drying, pretreatment, and also as a result of the rehydration (Lewicki, 1998b). These changes cause the dried product does not achieve the features of the raw material as a result of its rehydration, and shows the irreversibility of drying (Krokida and Marinos-Kouris, 2003).
Genetic algorithms (GA) are currently used mainly in computer programming, optimization issues, forecasting,
classification and automatic inference, image recognition,
The aim of the paper is to investigate the effect of drying and rehydration parameters on the quality of rehydrated apples and to optimize
these parameters based on quality of the rehydrated products. Hybrid artificial neural network (ANN) and multi-objective genetic algorithm (MOGA) method were successfully developed to model, simulate, and optimize the drying and rehydration parameters. This method was applied to the apple tissue, where the simultaneous maximization of the volume ratio (VR) and water absorption capacity (WAC) and the minimization of colour difference (CD) and dry matter loss (DML) were considered. The range of drying and rehydration parameters was: 50-70°C (drying temperature, Td), 0.01-6 m⋅s-1(drying air velocity, V), and 20-95°C (rehydration temperature, Tr). Additionally, the mathematical formulas for determing the quality parameters of rehydrated apple were developed. The best solution has been found only for: CD, VR, WAC (50.1°C for Td, 0.03 m⋅s-1 for V, and 67.5°C for Tr). The values of CD, VR, and WAC were predicted as 1.20, 53.2% and 0.57 respectively. It has been observed that DML was always conflicting with other quality parameters.
Keywords: Apple; Artificial neural network; Drying; Genetic algorithm; Optimization
A B S T R A C T
Emirates Journal of Food and Agriculture. 2018. 30(1): 1-9 doi: 10.9755/ejfa.2018.v30.i1.1595
http://www.ejfa.me/
control, synthesis and optimization of systems (mechanical,
electronic), game strategy, data analysis (fitness, modelling),
production management and engineering (Cagnoni et al.,
2007). They frequently interoperate with other artificial intelligence methods: artificial neural networks (ANN),
fuzzy systems and data exploration. Morimoto et al. (1997)
used ANN and GA to control fruit storage process. The
authors indicated the need to apply a hybrid system for the selection of input parameters such as (temperature, density) and output parameters such as (colour, mass loss, hardness) to improve the stored fruit quality. It was
also noticed that the complex system of artificial neural
networks and genetic algorithms is superior to traditional computational techniques used in problems related to agriculture.
Most optimization studies in food engineering refer to single-objective optimization. Only a few authors apply multi-objective strategies in such food processes as: drying (Olmos et al., 2002; Shahraki et al., 2014), thermal processing (Chen and Ramaswamy, 2002; Sendín et al., 2010), bulk-grain handling (Thakur et al., 2010), baking
(Hadiyanto et al., 2009), roasting (Białobrzewski et al., 2009; Goni and Salvadori, 2012), frying (Amiryousefi et al., 2014).
In the literature reviewed to date, there are no works regarding the optimization of drying and rehydration processes with the use of GA. In this context, the aims of this work were to investigate the effect of drying and rehydration parameters on the quality of rehydrated apples and to optimize these parameters based on quality of rehydrated product.
MATERIAL AND METHODS
AppleHigh-quality Ligol apples bought at a Warsaw market were used in the research. Their initial moisture content was ca. 85% w.b. (5.7 d.b.). The raw material (apples) were washed and cut into cubes. The thickness of cube amounted to 10±1 mm.
Drying
The raw material (apples) were dried using the following methods:
• Natural convection in the dryer (KCW-100, PREMED,
Marki, Poland) (Górnicki and Kaleta, 2007), the drying air velocity (V) amounted to 0.01 m⋅s-1,
• Forced convection in the convective dryer (constructed
in our laboratory) (Kaleta and Górnicki, 2010),V
amounted to 0.5 and 2 m⋅s-1,
• Fluidized bed drying (in the dryer constructed in our
laboratory) (Kaleta et al., 2013), V amounted to 6 m⋅s-1.
The temperature of drying air (Td) amounted to 50, 60 and 70°C.
The drying lasted until a constant weight for the dried
material was attained. The final moisture content of dried
apples was ca. 9% w.b. (0.1 d.b.).
The drying process was conducted in the given conditions at three independent experiments. The dried material (apples) was mixed and stored in a tightly sealed container for about one week at 20°C. The tightly sealed containers with the dried material (apples) were stored in a cupboard so that the ones were not exposed to sunlight.
Rehydration
The rehydration process was carried out in distilled water at temperatures (Tr): 20, 45, 70 and 95°C.
Rehydration lasted from 6 h (for Tr of 20°C) to 2 h (for Tr of 95°C). The ratio of weight for the dried material to that of the rehydrating medium was at 1:20. The medium was not stirred during the rehydration process and its temperature was kept constant. The initial mass of the dried material subjected to rehydration amounted to ca. 10 g.
Mass
The WPE 300 scales (RADWAG, Radom, Poland) were used for the measurement of the sample mass. Experiments were made in three replicates. The maximum relative error in the determination of the mass of the material during rehydration amounted to 0.1%.
Dry matter of solid was determined according to AOAC (2003) standards. The measurements were conducted for the dried material and during rehydration. The rehydrated material was overdried before the determination of the dry substance content. Measurements were made in three replicates. The WPE 300 scales (RADWAG, Radom, Poland) were used for the measurement of the dry matter mass. The maximum relative error in the determination of the mass of the dry substance amounted to 0.1%.
Volume
Determination of the volume was carried out with the use of the method of buoyancy in petroleum benzine (Mazza, 1983). Measurements were conducted for the fresh material, dried material and after rehydration. Measurements were made in three replicates. The maximum relative error of the volume determination calculated with the exact differential method amounted to 5%.
Colour
Acquired colour images have been loaded into the sRGB colour space. All built-in procedures for automatic image quality improvement during scanning were suspended. Colour was expressed as mean brightness of pixels in each RGB channel of the sample image. Means calculated for RGB were converted to CIE XYZ colour space relative to D50 reference white. Then XYZ colour parameters were nonlinearly transformed to CIE Lab
coordinates. Reference values for XYZ, corresponding to illuminant D50 and the standard observer of 10°, were 96.72, 100, and 81.43 respectively (CIE, 2004).
Colour parameters specific for CIELCh colour space
i.e. C (chroma) and h (hue angle) were additionally determined (Schanda, 2007).
Optimization problem
The case study for optimizing the drying and rehydration processes and the method of solving associated problems are presented below. It was assumed in the optimization
task that parameters influencing the quality of the product
obtained in the drying and rehydration processes are the basic parameters of these processes: Td, V and Tr. It was also assumed that the quality of the obtained product
is defined with the use of its colour, volume, moisture
content and dry matter content because the objective of the presented research results is to indicate the possibility of the use of neural networks and evolutionary algorithms and tools applied for the optimization of the discussed processes.
Quality analysis
Colour difference (CD).The colour difference was calculated according to the formula, given by Witt (2007)
∆
∆ * 2 ∆ * 2 * 2
L L C C H H
H
L C
K S K S K S
C D = + +
(1)
where SL, SC, SH are the weighting functions used to adjust internal non-uniformity of CIELab colour space and were determined based of Eqs. (2)-(4)
SL =1 (2)
SC = +1 0 045. ⋅C* (3)
SH = +1 0 015. ⋅C* (4)
KL, KC, KH are the parametric factors that describe the
effect of change from reference conditions. For reference
conditions, all of them are set at 1 (CIE, 2004). ΔH*, ΔL*,
ΔC*, correspond to the differences in hue, luminance and chroma, calculated for tested (T) and standard (S) sample. These indices may be determined using Eqs. (5)-(7)
∆H* C CT* S* ∆h
*
sin
= ⋅ ⋅
2
2 (5)
∆L* =LT* −L*S (6)
∆C* =CT* −CS* (7)
Volume ratio (VR). Volume ratio (%) was calculated as
VR =V ⋅ V
r
f
100 (8)
where Vf and Vr are initial volume of fresh material (before
drying) and final (after rehydration) volume of apple (m3),
respectively.
Water absorption capacity (WAC). The water absorption capacity (WAC) index was determined using formula (Lewicki, 1998a)
WAC=
(
−)
−(
−)
−
(
)
−(
−)
M s M s
M s M s
r r d d
d d
100 100
100 100
0 0
(9)
where M is the mass, s is the dry matter content (%), and subscripts d, 0 and r refer to dry, before drying and rehydrated, respectively.
Dry matter loss (DML). The formula given by Levi et al. (1988) was applied
DML= M −M ⋅
M
dmbr dmar
dmbr
100 (10)
where Mdmbris the dry matter before rehydration and Mdmar
is the dry matter after rehydration (g).
Modelling using neural networks
An Artificial Neural Network (ANN) consists of simple
synchronous processing elements inspired by the brain’s structure. Generally neural network consists of following parts: inputs, outputs, weight vector, add function, and transfer function. The neural network is comprised of three following layers: input, hidden and output layers. The input layer consists of all the input factors and informations from this layer are processed in the hidden layer and next the results are obtained in the output vector (Okuyucu
et al., 2007). In the present work, feed forward ANN with
backpropagation (BP) algorithm has been employed. The output of each neuron is connected only to the neurons
of the next layer in feed forward ANN. Inputs and outputs
have been normalized in the range of 0-1. Hidden layer
with a nonlinear transfer function authorizes the ANN
and inputs (Shojaeefard et al., 2013). The BP was used
with an ANN having an input layer with three neurons for
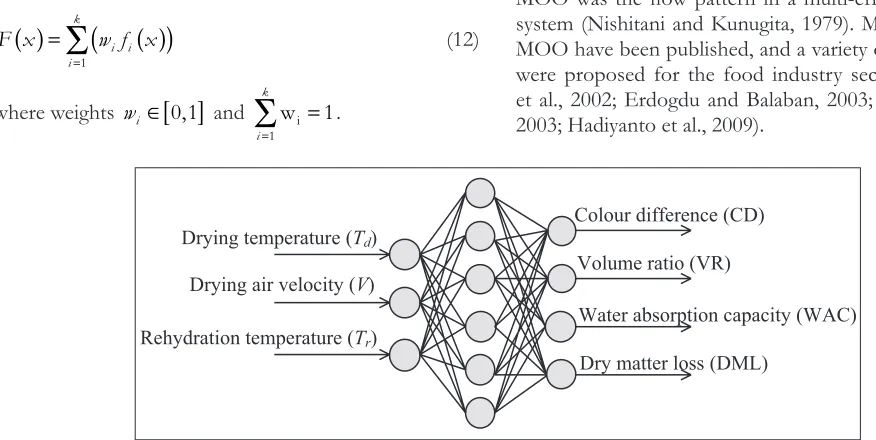
each input factor (Td, V, Tr) and an output layer with four neurons (CD, VR, WAC, DML). The most important task
is to choose the optimal ANN architecture (function of
activation, number of neurons in hidden layer). Different activation functions and number of neurons were tried for
obtaining the optimal the ANN architecture in this study. The performance of each ANN was checked using Mean
Relative Error according to Eq. (11)
MRE value value
value
exp, pred,
exp,
= −
=
∑
100
1
N
i i
i i
N
(11)
To obtain a network with the best generalization MRE should be minimized. Values of MRE were determined
for many different ANN. The optimal architecture of the network was constructed as 3-6-4NN and both the
activation functions in hidden layer and output layer were
”log-sigmoid”. Schematic of this ANN is presented in Fig. 1. MATLAB software was applied in all the stages
of model development (training, testing) of the ANN. The ANN was trained using ”Levenberg-Marquardt
optimization” learning algorithm.
Multi-objective optimization problem
Pareto solutions. In many tasks, we have to do with multiple criteria at the same time more and more frequently. In such situations, we say that it is an issue of multi-objective optimization or polyoptimization. These problems have been of interest to scientists applying traditional optimization and search techniques for a long time. One of the classic methods is the weighted objectives method where individual objective functions are combined to form a single objective function F
F x w f xi i
i k
( )
=(
( )
)
=
∑
1
(12)
where weights wi ∈
[ ]
0 1, and wi ==
∑
11
i k
.
Other weight vectors give other Pareto optimum solutions.
In the case of the multi-objective optimization, the concept of an optimum solution is not as obvious as in the case of a single objective. If we do not agree in advance to compare the values of different objectives (e.g. apples and
pears) we will have to suggest a definition of optimality that
respects the integrity of each of them. Such an approach is called the Pareto optimality. It is convenient to classify possible solutions to multi-objective optimization tasks as dominated and non-dominated (Pareto optimal) solutions. Solution x is dominated if there exists a permitted solution
y not worse than x in all the ordinates, i.e. for all objectives
fi (i=1,…,k) or fi (x) ≤ fi (y) for all 1≤ i ≤ k – for the
maximization objective (13)
If the solution is not dominated by any other permitted solution it shall be called a non-dominated (Pareto optimal) solution. All Pareto optimal solutions can be valid (Michalewicz, 1999). The main idea applied in the Vector Evaluated Genetic Algorithm (VEGA) was developed by involving the division of a population into subpopulations of the same size. Each of them was responsible for one
objective. Fonseca and Fleming (1993) published a review
of evolutionary algorithms applied to the multi-objective optimization. In the review, the authors described both the methods combining many objective functions into a single objective one and stating a single value and methods taking Pareto optimality into account and stating the set of values.
Optimization using Multi-objective Genetic Algorithms (MOGA). Multi-objective optimization (MOO) has not been often applied in the food industry (Abakarov et al., 2009). One of the earliest studies concerned with the application of
MOO was the flow pattern in a multi-effect evaporator system (Nishitani and Kunugita, 1979). Many papers on
MOO have been published, and a variety of applications were proposed for the food industry sector (Therdthai et al., 2002; Erdogdu and Balaban, 2003; Gergely et al., 2003; Hadiyanto et al., 2009).
Drying temperature (Td)
Drying air velocity (V)
Rehydration temperature (Tr)
Water absorption capacity (WAC) Volume ratio (VR)
Colour difference (CD)
Dry matter loss (DML)
MOGA uses a controlled elitist genetic algorithm (a
variant of Non-dominated Sorting Genetic Algorithm II (NSGA-II)). An elitist GA always favours chromosomes
with better fitness value (rank). A controlled elitist GA also favours chromosomes that can help increase the diversity of the population (even if they have a
lower fitness value). It is very important to maintain
the diversity of population for convergence to an optimal Pareto front. Two options in Matlab Toolbox:
”ParetoFraction” and ”DistanceFcn” control the elitism. ”ParetoFraction” limits the number of chromosomes on
the Pareto front (elite members). The distance function
”DistanceFcn”, helps to maintain diversity on a front
by favouring chromosomes that are relatively far away on the front. The algorithm stops, when the spread (a measure of the movement of the Pareto front) is small (Kalyanmoy, 2001).
RESULTS AND DISCUSSION
Artificial Neural NetworkSixteen and four patterns of the experimental results were
employed to train and testing the NN, respectively. The
correlation coefficient (R2) between the experimental and
predicted values was calculated. The ANN prediction of
drying and rehydration parameters follows the experimental results very closely and the developed neural network can accurately predict the quality of rehydrated product. The values of R2 for CD, VR, WAC, and DML at the training
and testing stages were 0.999987, 0.99999, 0.99997, and 0.999021, respectively. Therefore, it is possible to predict the CD, VR, WAC, and DML without carrying out the experiment.
Mathematical formulations
Hidden and output layers with a ”logsig” (sigmoid curve) transfer function:
F x
( )
= x+
−( ) 1
1 exp (14)
where x is the weighted sum of the input, were used for the prediction of rehydrated product quality (CD, VR, WAC, DML).
CD, VR, WAC, and DML were calculated using Eqs. (15-19)
obtained from the ANN
CD=
+ − + − + + + −
1
1 exp ((2 34. F1 4 77. F2 1 45. F3 2 69. F4 1 448. F5 1 816. F6 4 83. ) (15)
VR = F
+ −( + − + + + − )
1
1 exp 1 62. F1 5 07. F2 1 19. 3 2 12. F4 0 93. F5 2 01. F6 4 49. (16)
WAC=
+ − − + − + − +
1
1 exp ((1 78. F1 7 28. F2 3 78. F3 2 68. F4 12 14. F5 2 45. F6 2 75. ) (17)
DML=
+ −( + + + − + −
1
1 exp 3 04. F1 2 97. F2 0 32. F3 0 98. F4 1 59. F5 1 99. F6 3 31. )) (18)
where F(i=1, 2, 3,…, 6) was determined applying Fi = + −Wi
1
1 exp (19)
and W1-W6 can be determined as follows:
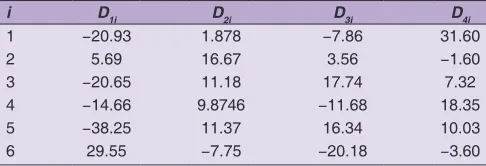
Wi=D1i⋅Td + D2i⋅V + D3i⋅Tr + D4i (20) Constants, Dji in Eq.(20) are shown in Table 1 for algorithm with six neurons. The values of Td, V and Trare normalized by dividing them by 70, 6 and 95, respectively. The output values (CD, VR, WAC, and DML) need to be multiplied by 27, 55, 0.6 and 0.7, respectively.
Procedure of MOGA
The design variables (expressed by real number) are converted to binary number. Each binary string is looked as an individual. The algorithm consists of ten steps: 1. The chromosomes (initial population) are produced
randomly.
2. The fitness of each chromosome is evaluated by
objective functions. Pareto ranking method is applied
for determining the fitness value by following way:
- setting all chromosomes initial ranking equal to 1, - evaluating all the chromosomes by one of the objective
functions (such as Objf) and finding chromosomes
whose objective function value is minimized of all chromosomes and then set the Pareto ranking of the chromosomes equal to an integer k (kinitial=1),
- getting rid of the chromosomes equal to k and set others equal to k+1,
- the up two steps are continued until all of the chromosomes have their own Pareto ranking.
Then the fitness value of each individual is a
reciprocal number of their own Pareto ranking (Wei and Yuying, 2008).
Table 1: Weights and biasess between input and hidden layers
i D1i D2i D3i D4i
1 −20.93 1.878 −7.86 31.60
2 5.69 16.67 3.56 −1.60
3 −20.65 11.18 17.74 7.32
4 −14.66 9.8746 −11.68 18.35
5 −38.25 11.37 16.34 10.03
3. The chromosomes are baked up.
4. Two chromosomes adjacent to each other are grouped into one group (according to the sorting of
chromosomes fitness value).
5. Crossover and mutation operation are performed (in each group). To replace parent chromosomes the child chromosomes are generated.
6. The new generated chromosomes and the original chromosomes are gathered into one group.
7. The operation is same with 2, but a different objective function should be used.
8. Selecting one half of the chromosomes having higher
fitness than others.
9. Checking the termination condition the termination generation taken in this study: the algorithm is
terminated (if satisfied) or the process returns to 3.
10. Pareto front solution.
Formulation of optimization task
The multi-objective optimization problem for the coupled process-performance problem seeks to minimize CD and DML and maximize VR and WAC subject to side constraints on the design variables. Discussed problem can be expressed mathematically as:
Min x
Min CD Min DML
Max VR Max WAC
( )
=(
)
(
)
(
)
T ,V,T T ,V,T T ,V,T
T
d r
d r
d r
d,,V,T
T V T
r
d
r
(
)
° ≤ ≤ °
⋅ ≤ ≤ ⋅
° ≤ ≤ °
− −
50 70
0 01 6
20 95
1 1
C C
. m s m s
C C
(21)
To obtain a minimization problem for all the objectives, the VR and WAC are multiplied by -1.
Results of optimization
The optimization problem was solved using the
MOGA toolbox in MATLAB (Fonseca and Fleming,
1993; Matlab, 2013) with an initial population size of 30. A random number generator (rng) was applied to establish the initial population within the specified bounds of the design variables (21). Details of the genetic algorithm options are following: population type - double vector; population size - 30 number of variables; selection function - tournament size = 2; crossover rate - 90%; crossover function - Intermediate; mutation function - Uniform; mutation rate - 10%; Pareto front population fraction - 0.8; number generations - 400 number of variables; migration - forward. The tournament option was used to select the parents in each generation. The intermediate crossover function (crossover
fraction - 80%) was applied. The function tolerance to stop the optimization procedure was set to 10-6. A stopping
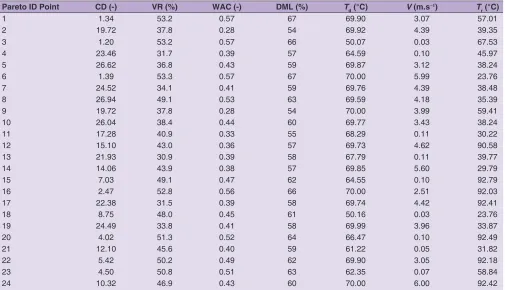
criterion was set at generation 500 (if the optimizer failed to converge). It turned out that after 125 GA generations, discussed optimization problem converged to the Pareto optimum set. Twenty four design points form the Pareto set with mentioned properties (Table 2). The Pareto set from Table 2 was sorted ranging from the best to the
worst for each response. It enabled the identification of
the best design for the individual responses and of level
of conflict/agreement among them.
The best solution for the individual responses in terms of
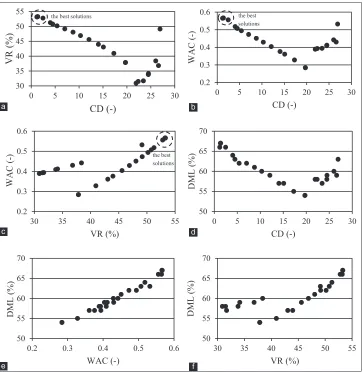
CD is that at ID No. 3 (CD=1.20) but the best solution in terms of VR and WAC are those at ID No. 1 (VR=53.2%) and ID No. 6 (WAC=0.57), respectively. The Pareto
set is presented separately in process and performance criteria subspaces, to show the non-dominated points forming the two-dimensional Pareto frontier (Fig. 2). The best solution (circled) only exists between CD and VR (Fig.2a), CD and WAC (Fig. 2b), and VR and WAC
(Fig. 2c). For these figures (taking into account the smallest
value of CD) the optimum values of process variables, obtained by MOGA algorithm were: 50.1°C for air drying temperature, 0.03 m⋅s-1 for air drying velocity, and 67.3°C
for rehydration temperature. For apple dried and next
rehydrated at these conditions, the values of CD, VR and WAC were predicted as 1.34, 53.2% and 0.57 respectively (see ID=1 in Table 2). No solution point in the Pareto
optimal set was found where all the considered functions (minimum CD and DML, and maximum VR and WAC) simultaneously attained their optimum values. Such a situation applies mainly to DML. The improvement of DML produces a deterioration in the other quality parameters (Figs. 2d-f). In such a case the solution is formulated by set of nondominated solutions in Pareto sense, where the choice of one solution over the other depends on the requirements of the process engineers and suitable combination of variables can be se selected from the Pareto solutions with their preferences.
CONCLUSIONS
A novel multi-criteria optimization method was successfully applied to the drying and rehydration processes of apple tissue, where the simultaneous maximization of the volume ratio (VR) and water absorption capacity (WAC) and the minimization of colour difference (CD) and dry matter loss (DML) were considered.
The training back-propagation algorithm was sufficient
for predicting the quality of rehydrated apple for different drying and rehydration process. Using good approximating
properties of ANN the mathematical formulas for
determining the quality parameters of rehydrated apple: CD, VR, WAC, DML were obtained.
The multi-objective genetic algorithm has found the best solution only for three functions (CD, VR, WAC), where the optimum values of process variables, obtained by algorithm were: 50.1°C for air drying temperature (Td), 0.03 m⋅s-1
for air drying velocity (V), and 67.5°C for rehydration temperature (Tr). The values of CD, VR and WAC for apple, dried and next rehydrated at these conditions, were
predicted as 1.20, 53.2% and 0.57 respectively. Conflicting
relations between all the objective functions of rehydration process quality has always been noticed. It is almost
impossible to find the solution that simultaneously optimize
the considered quality parameters of rehydrated apple.
There are several reasons to continue this research. For
example other parameters of pretreatment before drying,
drying itself and rehydration and other parameters defining
the quality of the obtained product can be taken into account.
ACKNOWLEDGMENTS
The authors are grateful for the financial support from research project No. N N 313 780940 from the Polish National Science Centre.
Author’s contributions
R.W.: Modelling and optimization, writing of manuscript. K.G.: Proposal of the research topic, experiments, modelling, writing of manuscript. A.K.: Proposal of the research topic, writing of manuscript. M.J.-M.: Design and supervision of experiment, experiments. J.T.: Critical revision of manuscript
30 35 40 45 50 55
0 5 10 15 20 25 30
VR (%
)
CD (-)
0.2 0.3 0.4 0.5 0.6
0 5 10 15 20 25 30
WAC
(-)
CD (-) the best
solutions
0.2 0.3 0.4 0.5 0.6
30 35 40 45 50 55
WAC
(-)
VR (%)
the best solutions
50 55 60 65 70
0 5 10 15 20 25 30
DML (%)
CD (-)
50 55 60 65 70
0.2 0.3 0.4 0.5 0.6
DML (%)
WAC (-)
50 55 60 65 70
30 35 40 45 50 55
DML (%)
VR (%) the best solutions
Fig 2. A two-dimensional view of the Pareto frontier between (a) colour difference and volume ratio, (b) colour difference and water absorption capacity, (c) volume ratio and water absorption capacity, (d) colour difference and dry matter loss, (e) water absorption capacity and dry matter loss, (f) volume ratio and dry matter loss.
a
c
e
b
d
REFERENCES
Abakarov, A., Y. Sushkov, S. Almoncid and R. Simpson. 2009. Multiobjective optimization approach: Thermal food processing. J. Food Sci. 74: 472-487.
Amiryousefi, M. R., M. Mohebbi, R. Khodaiyan and M. G. Ahsaee. 2014. Multi-objective optimization of deep-fat frying of ostrich meat plates using multi-objective particle swarm optimization (MOPSO). J. Food Process. Pres. 38: 1472-1479.
AOAC. 2003. Official Methods of Analysis. Association of Official Analitycal Chemists, Arlington, VA.
Białobrzewski, I., M. Danowska-Oziewics, M. Karpińska-Tymoszczyk, B. Nalepa, M. Markowski and R. Myhan. 2009. Turkey breast roasting - Process optimization. J. Food Eng. 96: 394-400. Cagnoni, S., R. Lutton and G. Olague. 2007. Genetic and Evolutionary
Computation for Image Processing and Analysis. Hindawi Publishing Corporation, New York.
Chen, C. R. and H. S. Ramaswamy. 2002. Modeling and optimization of constant retort temperature (CRT) thermal processing using coupled neural networks and genetic algorithms. J. Food Process Eng. 25: 351-379.
CIE Technical Report. 2004. Colorimetry. 3rd ed. CIE Publication, CIE
Central Bureau, Vienna. p. 15.
Erdogdu, F. and M. O. Balaban. 2003. Complex method for nonlinear constrained optimization of thermal processing multi-criteria (multi-objective function) optimization of thermal processing. J. Food Process Eng. 26(4): 357-375.
Fonseca, C. M. and P. J. Fleming. 1993. Genetic algorithms for multiobjective optimization: Formulation, discussion and generalization. In: Forrest, S., (Ed.), Proceedings of the 5th
International Conference on Genetic Algorithms, Morgan Kaufmann Publishers Inc., San Francisco, CA, USA, pp. 416-423.
Gergely, S., E. Bekassy-Molnar and G. Vatai. 2003. The use of multiobjective optimization to improve wine filtration. J. Food Eng. 58: 311-316.
Goni, S. M. and V. O. Salvadori. 2012. Model-based multi-objective optimization of beef roasting. J. Food Eng. 111: 92-101. Górnicki, K. and A. Kaleta. 2007. Drying curve modelling of blanched
carrot cubes under natural convection condition. J. Food Eng. 82: 160-170.
Hadiyanto, H., R. M. Boom, G. van Straten, A. J. M. van Boxtel and D. C. Esveld. 2009. Multi-objective optimization term to improve the product range of baking systems. J. Food Process Eng. 32: 709-729.
Kaleta, A. and K. Górnicki. 2010. Evaluation of drying models of apple (var. McIntosh) dried in a convective dryer. Int. J. Food Sci. Tech. 45: 891-898.
Kaleta, A., K. Górnicki, R. Winiczenko and A. Chojnacka. 2013. Evaluation of drying models of apple (var. Ligol) dried in a fluidized bed dryer. Energ. Convers. Manage. 67: 179-185. Kalyanmoy, D. 2001. Multi-objective optimization using evolutionary
algorithms. John Wiley & Sons, Inc., New York, USA.
Krokida, M. K. and D. Marinos-Kouris. 2003. Rehydration kinetics of dehydrated products. J. Food Eng. 57: 1-7.
Krokida, M. K. and C. Philippopoulos. 2005. Rehydration of dehydrated foods. Dry Technol. 23(4): 799-830.
Levi, A., N. Ben-Shalom, D. Plat and D. S. Reid. 1988. Effect of blanching and drying on pectin constituents and related characteristics of dehydrated peaches. J. Food Sci. 53: 1187-1190.
Lewicki, P. P. 1998a. Some remarks on rehydration of dried foods. J. Food Eng. 36: 81-87.
Lewicki, P. P. 1998b. Effect of pre-drying treatment, drying and rehydration on plant tissue properties: A review. Int. J. Food
Table 2: Pareto optimum set (random order)
Pareto ID Point CD (‑) VR (%) WAC (‑) DML (%) Td (°C) V (m.s−1) Tr (°C)
1 1.34 53.2 0.57 67 69.90 3.07 57.01
2 19.72 37.8 0.28 54 69.92 4.39 39.35
3 1.20 53.2 0.57 66 50.07 0.03 67.53
4 23.46 31.7 0.39 57 64.59 0.10 45.97
5 26.62 36.8 0.43 59 69.87 3.12 38.24
6 1.39 53.3 0.57 67 70.00 5.99 23.76
7 24.52 34.1 0.41 59 69.76 4.39 38.48
8 26.94 49.1 0.53 63 69.59 4.18 35.39
9 19.72 37.8 0.28 54 70.00 3.99 59.41
10 26.04 38.4 0.44 60 69.77 3.43 38.24
11 17.28 40.9 0.33 55 68.29 0.11 30.22
12 15.10 43.0 0.36 57 69.73 4.62 90.58
13 21.93 30.9 0.39 58 67.79 0.11 39.77
14 14.06 43.9 0.38 57 69.85 5.60 29.79
15 7.03 49.1 0.47 62 64.55 0.10 92.79
16 2.47 52.8 0.56 66 70.00 2.51 92.03
17 22.38 31.5 0.39 58 69.74 4.42 92.41
18 8.75 48.0 0.45 61 50.16 0.03 23.76
19 24.49 33.8 0.41 58 69.99 3.96 33.87
20 4.02 51.3 0.52 64 66.47 0.10 92.49
21 12.10 45.6 0.40 59 61.22 0.05 31.82
22 5.42 50.2 0.49 62 69.90 3.05 92.18
23 4.50 50.8 0.51 63 62.35 0.07 58.84
Prop. 1: 1-22.
Matlab Documentation R. 2013. MATLAB Documentation R. Math Works, Inc., Massachusetts.
Mazza, G. 1983. Dehydration of carrots. Effect of pre-drying treatments on moisture transport and product quality.Int. J. Food Sci. Tech. 18: 113-123.
Michalewicz, Z. 1999. Algorytmy Genetyczne + Struktura Danych = Programy Ewolucyjne (Genetic Algoritms + Data Structure = Evolutionary Programs). WNT, Warszawa.
Morimoto, T., J. De Baerdemaeker and Y. Hashimoto. 1997. An intelligent approach for optimal control of fruit-storage process using neural networks and genetic algorithms. Comput. Electr. Agr. 18: 205-224.
Nishitani, H. and E. Kunugita. 1979. Optimal flow-pattern of multiple effect evaporator systems. Comput. Chem. Eng. 3: 261-268. Okuyucu, H., A. Kurt and E. Arcaklioglu. 2007. Artificial neural network
application to the friction stir welding of aluminum plates. Mater. Design. 28: 78-84.
Olmos, A., I. C. Trelea, F. Courtois, C. Bonazzi and G. Trystram. 2002. Dynamic optimal control of batch rice drying process. Dry Technol. 20: 1319-1345.
Sacilik, K. and A. K. Elicin. 2006. The thin layer drying characteristics of organic apple slices. J. Food Eng. 73: 281-289.
Sendín, J. H., A. A. Alonso and J. R. Banga. 2010. Efficient and robust multi-objective optimization of food processing: A novel
approach with application to thermal sterilization. J. Food Eng. 98: 317-324.
Shahraki, M. H., A. M. Ziaiifar, S. M. Kashaninejad and M. Ghorbani. 2014. Optimization of pre-fry microwave drying of french fries using response surface methodology and genetic algorithms. J. Food Process Preserv. 38: 535-550.
Schanda, J. 2007. CIE Colorimetry. In: Schanda J., (Ed), Colorimetry: Understanding the CIE System, John Wiley & Sons, Inc., Hoboken, NJ, USA, pp. 25-78.
Shojaeefard, M. H., R. A. Behnagh, M. Akbari, M. K. B. Givi and F. Farhani. 2013. Modelling and pareto optimization of mechanical properties of friction stir welded AA7075/AA5083 butt joints using neural network and particle swarm algorithm. Mater. Design. 44: 190-198.
Thakur, M., L. Wang and C. R. Hurburgh. 2010. A multi-objective optimization approach to balancing cost and traceability in bulk grain handling. J. Food Eng. 101: 193-200.
Therdthai, N., W. Zhou and T. Adamczak. 2002. Optimization of the temperature profile in bread baking. J. Food Eng. 55: 41-48. Wei, L. and Y. Yuying. 2008. Multi-objective optimization of sheet
metal forming process using Pareto-based genetic algorithm. J. Mater. Process Technol. 208: 499-506.