Consumer perception of bread depending on wheat
origin in relation to physicochemical characteristics of
wheat flour
Mi Jeong Kim1†, Han Sub Kwak1†, Hee Yeon Jung1, Min Jung Lee1, Oui-Woung Kim2, Hoon Kim2, San Sook Kim1*
1Research Group of Cognition and Sensory Perception, Korea Food Research Institute, Seongnam-si 13539, Republic of Korea, 2Research Group of Smart Food Distribution System, Korea Food Research Institute, Seongnam-si 13539, Republic of Korea
†These authors are equally contributed to this study.
INTRODUCTION
Wheat (Triticum aestivum L.) is one of the major grains in the world (Van Hung et al., 2009). Wheat accounted for approximately 28% of world total grain consumption in 2014 (FAO, 2015). In Korea, wheat is the second mostly consumed grain after rice, and annual wheat consumption per capita has increased from 26.1 kg in 1970 to 31.7 kg in 2014 (MAFRA, 2015). Due to geological and weather issues, wheat has not been cultivated widely in Korea; therefore approximately 99% of wheat consumed in the country is imported mainly from the United States of America (USA) and Australia (KCS, 2015; MAFRA, 2015). However, consumers have begun to pay attention to locally grown wheat due to food preservatives used in wheat kernel prior to international transportation (Jin and Kim, 2011).
Consumer perception may be affected by the country of origin (CO) as well as the quality status of the food product.
The effect of the CO on consumer perception in regard to willingness to pay (WTP) and purchase intent (PI) has been studied for a wide range of foods (Balestrini and Gamble, 2006; Schnettler et al., 2008). Previous studies have shown that consumers tend to use the CO as a cue to make decisions for the purchase of products with or without other product information (Balestrini and Gamble, 2006; Schnettler et al.,2008). In addition, several studies have reported that consumer ethnocentrism has a positive influence on consumer preference for domestic products (Jang et al., 2012; Juric and Worsley, 1998). Jang et al. (2012) investigated consumer perception of rice samples with different COs. They found that the PI was higher for all domestic samples in an informed test compared to a blind test, demonstrating that consumers exhibited loyalty for their domestic rice. Juric and Worsley (1998) showed that consumer ethnocentrism might play a key role in the purchase of foreign versus domestic products in New Zealand. Despite these previous studies, The objective was to investigate the influence of wheat origin on overall acceptance (OA), purchase intent (PI), and willingness to pay (WTP) of bread in relation to physicochemical characteristics of Korean and imported wheat flours. The specific volumes (SV) of bread made with imported wheat flour were correlated with protein (r = 0.893), gluten (r = 0.843), and extensibility (r = 0.879). However, relatively low correlations were found between SV and protein (r = 0.528), gluten (r = 0.459), and extensibility (r = 0.413) in Korean wheat flour. The bread prepared with Korean wheat JK_1, imported NS and HRW_1 wheats showed higher OA, PI, and WTP than others in a blind consumer test. When the origins of the wheat flour were informed to Korean consumers, the WTP for breads prepared with JK_1 was increased significantly, while the OA was slightly increased for bread made with Korean wheat flour. Overall results of this study showed that Korean consumers exhibited a preference for Korean wheat products and willingness to pay more money than those from the imported wheat despite inconsistencies of wheat quality in SRC profile and dough properties found in the Korean wheat flours.
Keywords: Bread quality; Country of origin of wheat; Purchase intent; Wheat flour; Willingness to pay
http://www.ejfa.me/
R E G U L A R A R T I C L E
A B S T R A C T
*Corresponding author:
Sang Sook Kim, Ph.D. Research Group of Cognition and Sensory Perception, Korea Food Research Institute, Seongnam-si, 13539, Republic of Korea. Tel: +82 31 780 9042. Fax: +82 31 780 9059. E-mail:[email protected]
information on consumer perception of bread in relation to the physicochemical characteristics of flour with different origins is limited. Therefore, the objective was to investigate the influence of wheat origins on consumer perceptions of bread in relation to physicochemical characteristics of Korean and imported wheat flours.
MATERIALS AND METHODS
Wheat flour samples
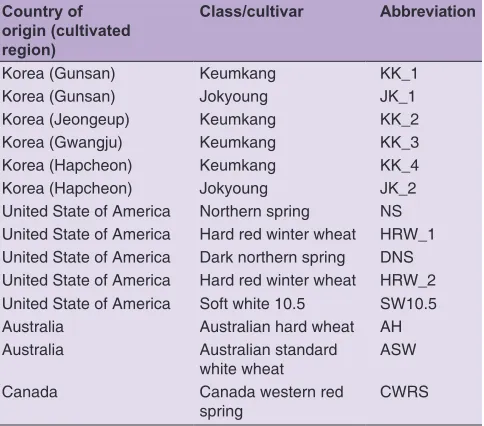
Six Korean wheat samples and eight imported wheat samples (five from the USA, two from Australia, and one from Canada) were used in this study (Table 1). Korean wheat samples consisted of two major cultivars, Keumkang (KK) and Jokyung (JK), widely grown in Korea. Four KK samples and two JK samples were obtained from six different cultivated sites in Korea. All of the wheat samples were provided by CJ Cheiljedang Co., Ltd. (Seoul, Korea), one of the largest flour milling companies in Korea. Wheat kernels were tempered overnight to 16% moisture content and then milled using a Bühler experimental mill (Bühler, Uzwil, Switzerland). Wheat flour with 60% milling yield was tightly packed in polyethylene bags and stored at 0°C until used.
Contents of protein and gluten, and solvent retention capacity (SRC) profile of flour
Protein content was determined using American Association of Cereal Chemists (AACC) approved method 08-01 (AACC 2000). Wet gluten content was measured using a Glutomatic System (Glutomatic 2200, Stockholm, Sweden) according to the procedure described by Ohm and Chung (1999). The gluten content was isolated from 10 g of flour with 2% NaCl buffer using a Glutomatic 2200 Automatic
Washing System. The SRC profile was measured according to Duyvejonck et al. (2011), which is a modification of AACC method 56-11A (AACC, 2000). The SRC profile consists of its water retention capacity (WRC), sodium carbonate SRC (SCSRC), sucrose SRC (SuSRC), and lactic acid SRC (LASRC) values. Briefly, 25 mL of 5%(v/v) sodium carbonate solution, 50%(w/w) sugar solution, 5%(w/w) lactic acid solution ord distilled water, and 5 g of flour were mixed for 20 min, and then centrifuged at 6000×g. The SRC profiles were obtained from the weight of the precipitate.
Extensibility and resistance of dough
Dough extensibility and resistance were determined using a texture analyzer (TA, TA-HD plus, Stable Micro Systems, Ltd., Haslemere, UK) according to the procedure described by Barros et al. (2010) with some modifications of sample preparation. Briefly, wheat flour and water (37% of flour weights) were mixed to form dough and then kept for 30 minutes at room temperature (23 ± 1˚C). The dough was then placed into Teflon molds to prepare strips (5 × 52 × 3 mm, width × length × height, respectively). The strips were covered with plastic wrap to prevent drying for 40 minutes. Each strip was placed on a flat metal plate, and resistance and extensibility in tension mode were measured using a probe (Kieffer dough and gluten extensibility rig) at a pre-test speed of 2.0 mm/s, a test speed of 3.3 mm/s, a post-test speed of 10.0 mm/s, and a distance of 75 mm.
Preparation, specific volume (SV), and hardness of yeast-leavened bread
Yeast-leavened bread was prepared using AACC Method 10-10B (AACC, 2000) with some modifications of the ingredients as follows: flour, 100%; dry yeast, 2.12%; sugar 6%; salt, 1.5%; baking improver, 0.2%; and shortening, 3% (flour weight basis). The water content of each wheat sample was determined by the results of Farinograph absorption (data not shown). The SV (mL/g) of bread was determined on the day of baking using a VolScan Profiler (Stable Micro Systems, Ltd., Haslemere, UK) and was calculated by dividing the volume of the bread by its weight. The hardness of bread was measured as described by Bourne (1978). Two layers of bread crumbs (25 × 25 × 19 mm, width × length × height/piece, respectively) were compressed with a plunger (50 mm diameter) at a crosshead speed of 10 mm/s using a TA (TA-XT plus, Stable Micro Systems, Ltd., Haslemere, UK). Three replications were performed, and each replication was averaged from eight times of texture measurements.
Overall acceptance (OA), PI, and WTP for bread
A total of 104 subjects (age 20–49 years) voluntarily participated in the consumer acceptance test. They did not have any issues in health and consuming bread. The
Table 1: Specification of the wheat samples used in this study Country of
origin (cultivated region)
Class/cultivar Abbreviation
Korea (Gunsan) Keumkang KK_1 Korea (Gunsan) Jokyoung JK_1 Korea (Jeongeup) Keumkang KK_2 Korea (Gwangju) Keumkang KK_3 Korea (Hapcheon) Keumkang KK_4 Korea (Hapcheon) Jokyoung JK_2 United State of America Northern spring NS United State of America Hard red winter wheat HRW_1 United State of America Dark northern spring DNS United State of America Hard red winter wheat HRW_2 United State of America Soft white 10.5 SW10.5 Australia Australian hard wheat AH Australia Australian standard
white wheat ASW Canada Canada western red
consumer test for the 14 breads was performed over two days at the Korea Food Research Institute (Seongnam-si, Korea). The samples were randomized by the sensory data collection program (Custom-made, Korea Food Research Institute, Seongnam-si, Korea) to minimize first-serving order bias. The first seven samples from the randomization were evaluated on the first day, and then the other seven samples were evaluated on the second day.
During the consumer acceptance test, the samples were presented without any information to the consumers. Consumers were asked to evaluate the OA, PI, and WTP of the breads. OA and PI were determined using a 9-point hedonic scale (1 = dislike extremely, 5 = neither like nor dislike, and 9 = like extremely) and a 5-point category scale (1 = definitely not purchase, 3 = neither purchase nor not purchase, and 5 = definitely purchase), respectively. The PI was calculated as the percentage of consumers who checked “definitely purchase” and “probably purchase”. Right after the blind test, the consumers evaluated breads with information on the flour’s origin and the price range of bread in the market. The price range for Korean wheat bread was $2.66–6.20 per 400 g package, and the range for imported wheat bread was $1.77–2.66 per 400 g package. The consumers were once again asked to evaluate OA, PI, and WTP. For consumer testing, four pieces of bread samples (20 × 20 × 19 mm, width × length × height, respectively) were presented on a white dish (14 cm, diameter) with a three-digit random code. All of the consumer tests were conducted in individual booths under incandescent lighting. Water was provided to panelists for rinsing the mouth before tasting a sample and in between samples. Panelists took a 1-min forced break
after evaluating each sample to minimize sensory fatigue. The samples were served in a monadic manner.
Statistical analysis
Analysis of variance (ANOVA) was performed to determine differences among the samples using Statistical Analysis System 9.2 software (SAS Institute, Cary, USA). When significant differences among samples were found, the Student Newan-Keul’s (SNK) multiple comparison was performed to separate the means at P < 0.05. To determine the relationship between physicochemical characteristics of wheat from different origins, Pearson’s correlation analysis was performed. The principal component analysis (PCA) was carried out to summarize the relationship between the physicochemical properties of wheat flour and consumer perception of breads using XLSTAT software (Addinsoft, Paris, France).
RESULTS AND DISCUSSION
The content of protein and wet gluten, and SRC profile of flour
The protein and gluten contents of the 14 wheat flours are shown in Table 2. The 14 wheat flour samples were significantly different in protein and gluten contents (both P < 0.001). The protein and gluten contents of the 14 samples were in the range of 8.0–13.7% and 22.4–39.8%, respectively. As reported by Anjum and Walker (2000), the protein content of imported wheat flour in this study varied with cultivar or class type of wheat (Table 2). On the other hand, a wide range of protein (8.9–11.4%) and gluten content (23.7–35.1%) were observed among Korean wheat cultivar KK grown in different regions. Maghirang et al. (2006) compared the quality characteristics
Table 2: The contents of protein1) and wet gluten2) and solvent retention capacity1) profiles of wheat flour from different origins Sample3) Protein4)***5) (%) Wet gluten4)*** (%) Solvent retention capacity (SRC) 4) (%)
WRC*** SCSRC*** SuSRC*** LASRC***
KK_1 8.8k6) 24.0ef 58.1e 70.3h 87.2de 95.6f
JK_1 9.7i 26.5d 58.2e 74.0fg 91.8c 101.1e
KK_2 11.4d 35.1b 61.6c 76.1ef 90.1cd 101.5e
KK_3 9.3j 23.7ef 53.4f 62.1j 79.9g 88.8g
KK_4 11.2e 31.9c 62.1c 77.1ef 91.8c 102.3e
JK_2 10.0h 28.2d 53.6f 66.1i 82.5f 97.2f
NS 12.2c 33.4bc 65.9a 93.8a 106.2a 123.6a
HRW_1 9.9h 24.8e 62.2c 89.1b 99.6b 114.2b
DNS 12.7b 35.2b 63.5b 81.7d 91.2c 111.2c
HRW_2 10.3g 26.9d 61.3c 78.6e 89.2cd 102.6e
SW10.5 9.0m 22.4f 48.2g 57.3k 75.5h 74.9h
AH 10.5f 27.9d 60.1d 85.5c 90.0cd 108.3d
ASW 8.7l 24.3ef 57.6e 71.2gh 85.0e 95.3f
CWRS 13.7a 39.8a 61.7c 82.7cd 91.7c 107.7d 1) Mean values of three replications, 2) Mean values of four replications, 3) Identification of samples is described in Table 1, 4) Based on 14% moisture content,
WRC, SCSRC, SuSRC, and LASRC meant water retention capacity, Sodium Carbonate SRC, Sucrose SRC, and Lactic Acid SRC, respectively, 5) *** meant
and breadmaking functionality of 100 hard red winter (HRW) and 100 hard red spring (HRS) wheat samples and reported that the mean protein and wet gluten contents of the HRS wheat flour samples (13.2 ± 1.53% of protein and 36.2% of gluten) were higher than those of the HRW samples (11.3 ± 1.6% of protein and 30.3% of gluten) and that both wheat classes are usually considered suitable for yeast-leavened breads. The results of this study confirmed the reports of Maghirang et al. (2006) showing higher protein and gluten contents in HRS such as NS, DNS, and CRWS (12.2–13.7% of protein and 33.43–39.75% of gluten) than in HRW_1 and HRW_2 (9.9–10.3% of protein and 24.83–26.92% of gluten). The other Korean wheat cultivar, JK, exhibited protein and gluten contents similar to those of HRW wheat, suggesting that JK is comparable to HRW wheat.
The SRC properties are generally used to evaluate wheat flour quality for commercial baking (Duyvejonck et al., 2011). The SRC profiles are presented in Table 2, and the 14 samples were significantly different at P < 0.001 across the samples in WRC, SCSRC, SuSRC, and LASRC. The WRC and LASRC of the 14 samples were in the range of 48.2–65.9% and 74.9–123.6%, respectively (Table 2). The WRC and LASRC values among SRC profiles were related to production of the bread (Duyvejonck et al., 2011). The hard type wheat from the imported wheat flours tended to have higher WRC and LASRC than soft wheat (SW10.5). For Korean wheat flour, KK samples showed large variations in WRC (53.4–62.1%) and LASRC (88.8–102.3%). JK samples had lower variations; however, the percentage values were lower than those of imported wheat samples in general, except SW10.5. Large variations of a single variety, KK, confirmed the physicochemical results in Table 2 may generate inconsistent quality issues
for industry. SCSRC is linearly related with the level of damaged starch (Gaines, 2000). More than 80% of SCSRC was only observed in the imported wheat flour samples (five out of eight samples), while Korean wheat samples showed 62.1–77.1%. More damaged starch was shown in the imported wheat flour than in Korean wheat. SuSRC range for Korean wheat flour (79.9–91.8%) was narrower than the imported wheat flour (75.5–106.2%). The NS and HRW_1 had significantly higher values than Korean wheat flour (P < 0.05).
Dough and bread properties
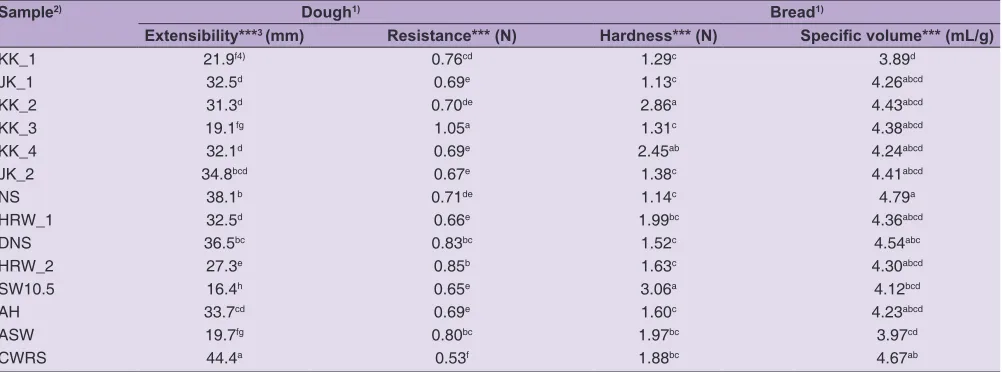
The result of extensibility and resistance of the doughs are presented in Table 3. The extensibility and resistance of the 14 wheat flours differed significantly (both P
< 0.001) and were in the range of 16.4–44.4 mm and 0.53–1.05 N, respectively. The dough extensibility values (36.5–44.4 mm) of flour prepared from the HRS (CWRS, NS, and DNS) were higher than those of the SW10.5 (16.4 mm) or ASW (19.7 mm). Nash et al. (2006) and Caffe-Treml et al. (2011) reported that increased dough extensibility enhanced bread rising to form a larger loft volume. The results in this study showed higher dough extensibility and lower resistance for flour from the hard wheat than the soft wheat type, with correspondingly higher expected bread volumes (Table 3). Between Korean wheat flour, the KK cultivar showed a wider range of extensibility (19.1–32.5 mm) and resistance (0.69–1.05 N) than JK cultivar. The ranges of extensibility and resistance for JK were 32.5–34.8 mm and 0.67–0.69 N, respectively. Considering that the dough extensibility of HRW was in the range of 27.3–32.5 mm, the JK samples were comparable to HRW for making bread. The dough resistance values tended to decrease with increasing dough extensibility in general, as reported by Nash et al. (2006).
Table 3: Extensibility and resistance for dough properties, and hardness and specific volume for bread properties
Sample2) Dough1) Bread1)
Extensibility***3 (mm) Resistance*** (N) Hardness*** (N) Specific volume*** (mL/g)
KK_1 21.9f4) 0.76cd 1.29c 3.89d
JK_1 32.5d 0.69e 1.13c 4.26abcd
KK_2 31.3d 0.70de 2.86a 4.43abcd
KK_3 19.1fg 1.05a 1.31c 4.38abcd
KK_4 32.1d 0.69e 2.45ab 4.24abcd
JK_2 34.8bcd 0.67e 1.38c 4.41abcd
NS 38.1b 0.71de 1.14c 4.79a
HRW_1 32.5d 0.66e 1.99bc 4.36abcd
DNS 36.5bc 0.83bc 1.52c 4.54abc
HRW_2 27.3e 0.85b 1.63c 4.30abcd
SW10.5 16.4h 0.65e 3.06a 4.12bcd
AH 33.7cd 0.69e 1.60c 4.23abcd
ASW 19.7fg 0.80bc 1.97bc 3.97cd
CWRS 44.4a 0.53f 1.88bc 4.67ab 1) Mean values of three replications, 2) Identification of samples is described in Table 1, 3) *** meant significantly different at P=0.001, 4) Values with same
The main parameters of bread quality are low crumb hardness and high SV (Steffolani et al., 2012). The hardness and SV of breads prepared with the 14 samples are presented in Table 3. The 14 breads differed significantly in SV (P < 0.001) and hardness (P < 0.001) (Table 3). The hardness and SV of the breads were in the range of 1.13–3.06 N and 3.89–4.79 mL/g, respectively. Rozylo et al. (2014) reported that decreased hardness of bread correlated strongly with increased bread loaf volume. Among Korean wheat flour breads, JK_1, JK_2, and KK_3 showed lower hardness and higher SV than KK_1 and KK_2. Specifically, the hardness and SV of bread prepared with the JK_1 wheat flour were statistically similar to the hardness and SV of bread made with NS wheat (Table 3). KK samples from four different regions in Korea showed a large variation in the hardness of the bread. This may imply a quality control issue for industry use. The bread made with the NS had low hardness (1.14 N) and high SV (4.79 mL/g). Among the breads made from the imported wheat flour, ASW and SW10.5 had higher hardness and/or lower SV than others, implying non-suitability for bread making.
Relationship between flour, dough, and bread parameters
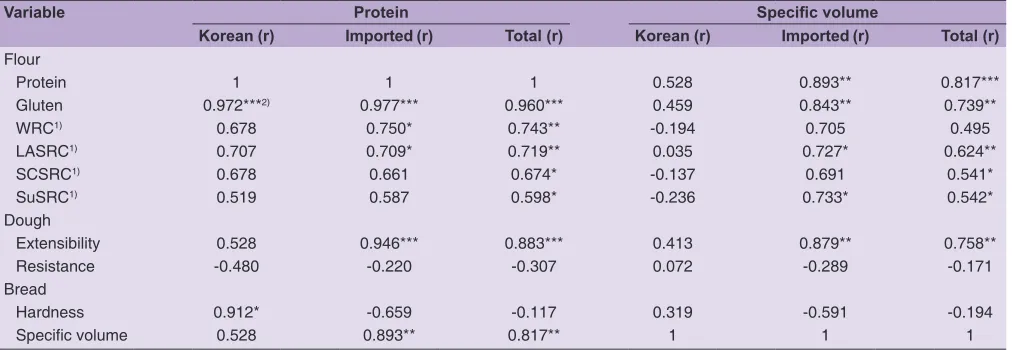
The correlation coefficients (r) between the protein or SV and properties of flour, dough, and bread prepared with 14 wheat origins are summarized in Table 4. The protein was highly correlated (P < 0.05) with gluten (r = 0.960), WRC (r = 0.743), LASRC (r = 0.719), extensibility (r = 0.883), and SV (r = 0.817). The SV was highly correlated with protein (r = 0.817), gluten (r = 0.739), and extensibility (r = 0.758). The extensibility of dough was highly correlated with protein (r = 0.946) and SV (r = 0.879) in imported wheat; however, this trend was not observed in Korean wheat. Protein was highly correlated with hardness of bread
(r = 0.912) in Korean wheat indicating a difference in protein quality between the imported wheat and Korean wheat samples used in this study. Lin et al. (2012) and Schmiele et al. (2012) reported a high correlation between SV of bread and dough extensibility. In addition, Lin et al. (2012) showed that bread made with flour containing high gluten content exhibited the highest SV. The results of correlation analysis by origins of the wheat (Korean vs. imported) showed that correlation coefficients between bread volume and protein, gluten, and dough extensibility were much lower in Korean wheat (r = 0.528, 0.459, and 0.413, respectively) than those in imported wheat (r = 0.893, 0.843, and 0.878, respectively). The above results may imply that the baking quality of imported wheat samples was better than that of Korean wheat samples other than ASW and SW10.5, which were the multipurpose wheat flour.
Consumer testing of breads
The OA and the PI (%) of the 14 breads are shown in Table 5. The mean separation by the SNK multiple comparison test was similar between the blind and informed tests. The bread baked with the NS wheat exhibited the highest OA, followed by HRW_1 and JK_1 in a blind test. OA of bread made with the KK_2 was the lowest among the breads tested in this study. Highly accepted samples (JK_1 and KK_4) among Korean wheat flour breads increased their OA rating more than the lower accepted samples (KK_2 and KK_3) in the informed test (P < 0.05). The acceptance ratings for highly samples were significantly increased by the informed test (P < 0.01). KK variety showed large variations in OA depending on the growing regions along with the physicochemical characteristics (Table 5).
Information for flour origins did not affect either positively or negatively in general for the breads made by imported
Table 4: Correlation coefficients (r) between protein or specific volume and properties of flour, dough, and bread depending on wheat origins
Variable Protein Specific volume
Korean (r) Imported (r) Total (r) Korean (r) Imported (r) Total (r)
Flour
Protein 1 1 1 0.528 0.893** 0.817*** Gluten 0.972***2) 0.977*** 0.960*** 0.459 0.843** 0.739**
WRC1) 0.678 0.750* 0.743** -0.194 0.705 0.495
LASRC1) 0.707 0.709* 0.719** 0.035 0.727* 0.624**
SCSRC1) 0.678 0.661 0.674* -0.137 0.691 0.541*
SuSRC1) 0.519 0.587 0.598* -0.236 0.733* 0.542*
Dough
Extensibility 0.528 0.946*** 0.883*** 0.413 0.879** 0.758** Resistance -0.480 -0.220 -0.307 0.072 -0.289 -0.171
Bread
Hardness 0.912* -0.659 -0.117 0.319 -0.591 -0.194
Specific volume 0.528 0.893** 0.817** 1 1 1
wheat flour (Table 5). Compared with Korean wheat breads, highly accepted imported breads (NS and HRW_1) increased their OA rating in the informed test. However, when the origin of the wheat was provided, OA for most of the imported samples (DNS, HRW_2, AH, ASW, and SW10.5) was decreased. Only NS was significantly increased by the informed test (P<0.05). Low variations between the blind and informed tests for the imported wheat might be explained by the consumers’ indifference about the imported wheat since most (> 98%) of the wheat in Korea is imported in comparison with the opposite case of the rice (Jang et al., 2012).
The tendency of PI was similar to OA, indicating consistency in consumer evaluation. Bower et al. (2003) reported that PI was presumed to be based on sensory liking alone, and that PI based on a sensory test was highly correlated with OA in the case of a blind test. The results of this study are in line with the report by Bower et al.(2003) by presenting a high correlation (r = 0.968, data not shown) between OA and PI in the blind test. As shown in Table 5, the percentages of consumers who are willing to buy the breads made with Korean wheat tended to increase when the origin of the wheat was informed. The PI increased more in the highly accepted samples (JK_1 and KK_4) among the breads made of Korean wheat flour, while the lower accepted samples showed slight increases (1.0~6.0%) between the blind and informed test. Juric and Worsley (1998) showed that consumer ethnocentrism might play a significant role in the purchase of imported products compared to domestic ones. Consumer ethnocentrism to the domestic and imported food products was higher than the other product such as car, TV, and cloths among the British (Balabanis and Diamantopoulos, 2004). For agricultural products Koreans preferred domestic products and considered the country of origin and quality as the reasons of their choice (Rhew, 2008). Therefore, it can be inferred that the ethnocentrism played a key role in increasing the PI of the bread made by domestic wheat flour. Similar results with the findings of this study were also reported by Jang et al. (2012) that the PI for domestic rice samples was higher in an informed test than in a blind test.In addition, the OA for highly accepted samples (JK_1, NS, and HRW_1) showed their OA increased significantly (P < 0.05) for JK_1 and NS. Consumers seemed to rate higher when they identify the information for their product (Jang et al., 2012).
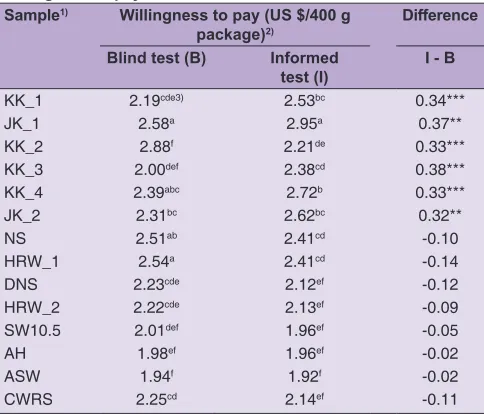
The differences in WTP between the informed and the blind tests (WTP informed test, WTP blind test) of the 14 breads are shown in Table 6. In the blind test, the price for Korean wheat flour samples ($1.88–2.58 per 400 g package) and the imported wheat flour samples ($1.94–2.54) showed similar price ranges. The price ranges in the informed test,
however, demonstrated a different pattern in comparison with those in the blind test. The WTP for Korean wheat flour breads were significantly increased (P < 0.01) for all of the Korean wheat flour breads, while the WTP for imported wheat flour breads were slightly decreased from the WTP in the blind test. In previous studies, consumers tended to evaluate more positively the products imported from developed countries than their domestic products (Verlegh and Steenkamp, 1999), and Korean consumers had rated higher consumer acceptance and purchase intent for domestic rice than imported rice (Jang et al., 2012).
Table 6: Difference between blind test and informed tests in willingness to pay for bread
Sample1) Willingness to pay (US $/400 g
package)2) Difference
Blind test (B) Informed
test (I) I - B
KK_1 2.19cde3) 2.53bc 0.34***
JK_1 2.58a 2.95a 0.37**
KK_2 2.88f 2.21de 0.33***
KK_3 2.00def 2.38cd 0.38***
KK_4 2.39abc 2.72b 0.33***
JK_2 2.31bc 2.62bc 0.32**
NS 2.51ab 2.41cd -0.10
HRW_1 2.54a 2.41cd -0.14
DNS 2.23cde 2.12ef -0.12
HRW_2 2.22cde 2.13ef -0.09
SW10.5 2.01def 1.96ef -0.05
AH 1.98ef 1.96ef -0.02
ASW 1.94f 1.92f -0.02
CWRS 2.25cd 2.14ef -0.11 1) Identification of samples was described in Table 1, 2) Average willingness
to pay by total 104 consumers for one package of bread, 3) Different
superscripts within a column mean significant differences at P<0.05 Table 5: Overall acceptance and purchase intent (%) of the bread made by Korean and imported wheat flour
Sample1) Overall acceptance Purchase
intent (%)2)
Blind
test Informed test P‑value Blind test Informed test
KK_1 5.2cd 5.4c 0.37 28.4 31.4
JK_1 6.5a 7.1a <0.001 64.0 72.0
KK_2 4.2f 4.2d 0.97 12.7 13.7
KK_3 4.6ef 4.7d 0.54 19.6 22.5
KK_4 5.8b 6.2 b 0.002 38.0 48.0
JK_2 5.2cd 5.4c 0.11 28.0 34.0
NS 6.7a 7.1a 0.04 66.7 70.6
HRW_1 6.6a 6.7 a 0.28 64.7 62.7
DNS 4.9de 4.8cd 0.77 18.6 22.5
HRW_2 4.5ef 4.4d 0.61 17.6 16.7
SW10.5 5.5bc 5.3c 0.40 33.0 33.0
AH 5.5bc 5.4c 0.64 42.2 47.1
ASW 5.5bc 5.5c 0.85 27.0 26.0
CWRS 4.6f 4.6d 0.75 17.0 17.0 1) Identification of samples was described in Table 1, 2) Purchase intent in this table is the proportion of the consumers who marked ‘definitely
However, in this study, there was no increase in WTP for imported wheat bread, although wheat flour was imported from more developed countries than Korea. This might be due to the stereotype that all wheat flour has been imported from outside of Korea over the past half century. In this study, consumers tended to positively evaluate the WTP based on the origin and the price provided in the informed test. These results were comparable to the findings of Dransfield et al. (2005) and Peterson et al. (2013) who reported that consumers expressed higher WTP for domestic pork and rice, respectively, than those labeled as imported. Korean consumers seemed to accord a royalty for Korean wheat since it is rarely found in the bakery industry because of the very limited yield.
Principal component analysis (PCA)
The PCA loading plot of the 14 wheat breads, OA, PI, and WTP of breads and the major physicochemical characteristics of the wheat flour are shown in Fig. 1. The PCA results explain 77.17% from the first two components; Principal component (PC) 1 (x-axis) and PC 2 (y-axis) accounted for 56.45% and 20.72% of the total variation, respectively. All of the physicochemical and sensory characteristics were located positively on the PC 1 except hardness and resistance. Physicochemical parameters were loaded positively on PC 1 and PC 2, while the sensory
parameters were loaded positively on PC 1 and negatively on PC 2. Wheat bread samples were loaded close to the PC 1. Wheat samples loaded negatively on PC 1 would have relatively low physicochemical and sensory values in general. It can be inferred that the quality of wheat samples loaded positively on PC 1 would be higher than the others on the loaded on the PC1 negatively. Imported wheat samples, which showed high correlation coefficients between physicochemical parameters in Table 4, loaded closely to the axis of the PC 1. On the other hand, Korean wheat samples, such as KK_2 and JK_1, which showed low correlation coefficients between physicochemical parameters in Table 4, were loaded away from the axis of the PC 1. These low correlation coefficients seemed to generate the quality control issue for Korean wheat flour. Among Korean wheat samples, OA of JK_1 (blind test: 6.51, informed test: 7.08) was comparable to that of NS (blind test: 6.72, informed test: 7.10), which showed the highest OA among samples tested in this study. However, the trends of physicochemical characteristics for JK_1 were not consistent with those of previous studies, which showed high correlation coefficients with the physicochemical characteristics (Anjum and Walker, 2000; Caffe-Treml et al., 2011; Duyvejonck et al., 2011; Steffolani et al., 2012). Overall results of this study suggest further investigation for JK_1 to explain high OA and lower correlation coefficients between the physicochemical parameters.
CONCLUSIONS
Correlation coefficients between physicochemical characteristics and baking quality in wheat flour were relatively low in Korean wheat samples in comparison with those of imported wheat samples. Especially KK varieties, consisting of more than 80% Korean wheat, showed large variations across the grown region, by generating quality control issues for industry use. In the informed consumer test, OA of bread was influenced positively for Korean wheat flour. The WTP for bread prepared with Korean wheat samples also increased when information of wheat origin was provided. The consumer testing results of this study demonstrated consumers’ loyalty to domestic wheat products regardless of quality. One Korean flour sample (JK_1) was comparable with highly accepted varieties NS and HRW_1 in OA.
ACKNOWLEDGMENTS
This work was supported by the High Value-added Food Technology Development Program (Grant number: 312049-04) funded by Ministry of Agriculture, Food and Rural Affairs (MAFRA) and Main Research Program
Fig 1. Loading plot of major physicochemical characteristics of flour,
dough, and breads and consumer overall acceptance, willingness to pay and purchase intent of 14 breads prepared with domestic or
imported wheat flours by principal component analysis. Identification of samples is described in Table 1. PI_B, purchase intend in blind test; PI_I, purchase intend in informed test; WTP_B, willingness to pay in blind test; WTP_I, willingness to pay in informed test; Overall_B, overall acceptance in blind test; Overall_I, overall acceptance in informed
test. WRC, SCSRC and SuSRC, and LASRC are described in the
(Grant number: E0171500-02) of the Korea Research Food Institute (KFRI) funded by the Ministry of Science, ICT & Future Planning, Republic of Korea.
Authors’ contributions
M. J. K. planned the study and wrote the physicochemical analyses part. H. S. K. analyzed the data and wrote the article. H. Y. J. and M. J. L. performed consumer acceptance test and collect data. O. W. K. and H. K. carried out chemical analyses. S. S. K. managed the project and critical revision of the article.
REFERENCES
American Association of Cereal Chemists (AACC). 2000. Approved Methods of the American Association of Cereal Chemists, 10th ed. AACC International, St. Paul, MN.
Anjum, F. M. and C. E. Walker. 2000. Grain, flour and bread-making properties of eight Pakistani hard white spring wheat cultivars grown at three different locations for 2 years. Int. J. Food. Sci. Technol. 35: 407-416.
Balabanis, G. and A. Diamantopoulos. 2004. Domestic country bias, country-of-origin effects, and consumer ethnocentrism: A multidimensional unfolding approach. J. Acad. Mark. Sci. 32: 80-95.
Balestrini, P. and P. Gamble. 2006. Country-of-origin effects on Chinese wine consumers. Br. Food J. 108: 369-412.
Barros, F., J. N. Alviola, M. Tilley, Y. R. Chen, V. R. M. Pierucci and L. W. Rooney. 2010. Predicting hot-press wheat tortilla quality using flour, dough and gluten properties. J. Cereal Sci. 52: 288-294.
Bourne, M.C. 1978. Texture profile analysis. Food Technol. 32: 62-66. Bower, J. A., M. A. Saadat and C. Whitten. 2003. Effect of liking,
information and consumer characteristics on purchase intention and willingness to pay more for a fat spread with a proven health benefit. Food Qual. Prefer. 14: 65-74.
Caffe-Treml, M., K. D. Glover, P. G. Krishnan, G. A. Hareland, K. D. Bondalapatim and J. Stein. 2011. Effect of wheat genotype and environment on relationships between dough extensibility and breadmaking quality. Cereal Chem. 88: 201-208.
Dransfield, E., T. M. Ngapo, N. A. Nielsen, L. Bredahl, P. O. Sjoden, M. Magnusson, M. M. Campo and G. R. Nute. 2005. Consumer choice and suggested price for pork as influenced by its appearance, taste and information concerning country of origin and organic pig production. Meat Sci. 69: 61-70.
Duyvejonck, A. E., B. Lagrain, B. Pareyt, C. M. Courtin and J. A. Delcour. 2011. Relative contribution of wheat flour constituents to Solvent Retention Capacity profiles of European wheats. J. Cereal Sci. 53: 312-318.
Food and Agricultural Organization (FAO). 2015. Crops. Available from: http://www.fao.org/worldfoodsituation/csdb/en. [Last accessed on 2015 May 03].
Gaines, C. S. 2000. Collaborative study of methods for solvent retention capacity profiles (AACC Method 56-11). Cereal Foods World. 45: 303-306.
Jang, E. H., S. T. Lim and S. S. Kim. 2012. Comparison of physicochemical characteristics and consumer perception of rice samples with different countries of origin and prices. J. Sci. Food Agric. 92: 1605-1613.
Jin, H. J. and B. Y. Kim. 2011. Analysis for consumers’ opinion regarding domestic wheat bread. J. Consum. Policy Stud. 40: 205-222. Juric, B. and A. Worsley. 1998. Consumers’ attitudes towards
imported food products. Food Qual. Prefer. 9: 431-441. Korea Custom Service (KCS). 2016. Trade Statistic for Import/Export
of Wheat in 2015. Available from: https://www.unipass.customs. go.kr:38030/ets/index_eng.do. [Last accessed on 2015 May 03]. Lin, S. Y., H. H. Chen, S. Lu and P. C. Wang. 2012. Effects of blending
of wheat flour with barley flour on dough and steamed bread properties. J. Texture Stud. 43: 438-444.
Maghirang, E. B., G. L. Lookhart, S. R. Bean, R. O. Pierce, F. Xie, J. D. Caley, J. D. Wilson, B. W. Seabourn, M. S. Ram, S. H. Park, O. K. Chung and F. E. Dowell. 2006. Comparison of quality characteristics and bread making functionality of hard red winter and hard red spring wheat. Cereal Chem. 83: 520-528. Ministry of Agriculture, Food and Rural Affairs (MAFRA). 2015. Major
Statistics for Agricultural, Livestock, and Food. Available from http://www.library.mafra.go.kr/skyblueimage/4523.pdf. [Last accessed on 2016 Jan 21].
Nash, D., S. P. Lanning, P. Fox, J. M. Martin, N. K. Blake, E. Souza, R. A. Graybosch, M. J. Giroux and L. E. Talbert. 2006. Relationship of dough extensibility to dough strength in a spring wheat cross. Cereal Chem. 83: 255-258.
Ohm, J. B. and O. K. Chung. 1999. Gluten, pasting, and mixograph parameters of hard winter wheat flours in relation to breadmaking. Cereal Chem. 76: 606-613.
Peterson, H. H., J. C. Bernard, J. A. Fox and J. M. Peterson. 2013. Japanese consumers’ evaluation of rice and pork from domestic, US, and other origins. J. Agric. Resour. Econ. 38: 93-106. Rhew, C. H. 2008. Comparative analysis of national consciousness
for agriculture and rural economy for Korea, Japan and EU. Korea Rural Economic Institute, Naju-si.
Rozylo, R., D. Dziki and J. Laskowski. 2014. Changes in the physical and the sensorial properties of wheat bread caused by interruption and slowing of the fermentation of yeast-based leaven. J. Cereal Sci. 59: 88-94.
Schmiele, M., L. Z. Jaekel, S. M. C. Patricio, C. J. Steel and Y. K. Chang. 2012. Rheological properties of wheat flour and quality characteristics of pan bread as modified by partial additions of wheat bran or whole grain wheat flour. Int. J. Food Sci. Technol. 47: 2141-2150.
Schnettler, B., D. Ruiz, O. Sepulveda and N. Sepulveda. 2008. Importance of the country of origin in food consumption in a developing country. Food Qual. Prefer. 19: 372-382.
Steffolani, M. E., P. D. Ribotta, G. T. Perez and A. E. Leon. 2012. Combinations of glucose oxidase, α-amylase and xylanase affect dough properties and bread quality. Int. J. Food Sci. Technol. 47: 525-534.
Van Hung, P., T. Maeda, K. Miyatake and N. Morita. 2009. Total compounds and antioxidant capacity of wheat graded flours by polishing method. Food Res. Int. 42: 185-190.