Original Research Article
Correlates of type-2 diabetes mellitus in urban slums
population Moradabad
Shiv Prasad Bahal
1, Sumit Saxena
2*, Anurag Srivastava
1INTRODUCTION
Epidemiological transitions in India in the 21st century have led to non-communicable diseases becoming a major public health problem of growing magnitude. One of the important diseases in this respect is diabetes, which is considered a “disease of urbanization”.1–3
Diabetes mellitus was first described in India in the ancient texts of Charaka and Sushruta (1500 BCE). India is second only to China which is the home to 92.3 million diabetics.4 Diabetes mellitus (DM) is a syndrome characterized by a
state of chronic hyperglycemia causing disturbance of carbohydrate, fat and protein metabolism, associated with absolute or relative deficiency in insulin secretion or insulin action.5
In 2012, non-communicable diseases (NCDs), also known as chronic diseases, killed over 38 million people in the world, and 1.5 million of all deaths were attributed to diabetes. With over 1.25 billion people, India has a little lower prevalence of diabetes (among adult population) than the global level (India: 7.8% vs
ABSTRACT
Background: Epidemiological transitions in India in the 21st century have led to non-communicable diseases becoming a major public health problem of growing magnitude. One of the important diseases in this respect is diabetes, which is considered a “disease of urbanization”. Risk factors for type 2 diabetes mellitus are: age, gender, ethnicity, family history, obesity, inactivity, gestational diabetes, hypertension, cardiovascular diseases, high blood glucose on previous testing, impaired glucose tolerance and glycated hemoglobin ≥5.7%.
Methods: A community based cross- sectional study was conducted in urban slums which are the field practice area of Community Medicine department under the head of Teerthanker Mahaveer Medical College and Research Center, Moradabad. The final analysis was conducted on 640 participants. Each interview began with a general discussion to build rapport with the participants. Repeat visit was made on the consecutive day early in the morning to measure fasting blood glucose level with the help of Glucometer.
Results: The overall prevalence of diabetes mellitus in the present study was found to be 15.6%. Maximum prevalence of diabetes mellitus was found between the age group of 60-69 years i.e. 44 (28.0%) followed by 26 (19.6%) in 50-59 years and 22 (18.1%) in 40-49 age group. In socioeconomic status, the prevalence of diabetes mellitus was 18 (21.6%) and 26 (25.2%) in class I and class II respectively.
Conclusions: Based on study findings it has been observed that there was statistically significant association between socio-demographic variables like age, sex, education, socioeconomic status and type 2 diabetes mellitus.
Keywords: Diabetes, Prevalence, Socio-demographic variables
Department ofCommunity Medicine, 1Teerthanker Mahaveer Medical College and Research Centre, Moradabad, 2T.S. Misra Medical College and Hospital, Lucknow, Uttar Pradesh, India
Received: 14 March 2018
Revised: 21 April 2018
Accepted: 23 April 2018
*Correspondence:
Dr. Sumit Saxena,
E-mail: [email protected]
Copyright: © the author(s), publisher and licensee Medip Academy. This is an open-access article distributed under the terms of the Creative Commons Attribution Non-Commercial License, which permits unrestricted non-commercial use, distribution, and reproduction in any medium, provided the original work is properly cited.
worldwide: 8.5%).6 While recognizing the increasing prevalence of type 2 diabetes in urban Indian adults, it is important to note that the prevalence of undiagnosed diabetes in the community is also high. The prevalence of Diabetes and IGT are high in urban Indian population.7 Risk factors for type 2 diabetes mellitus are: age, gender, ethnicity, family history of type 2 diabetes mellitus, obesity, inactivity, gestational diabetes, macrosomia, hypertension, decreased high-density lipoprotein cholesterol, increased triglycerides, cardiovascular diseases, micro-polycystic ovary syndrome, high blood glucose on previous testing, impaired glucose tolerance and glycated hemoglobin ≥5.7%.8
In addition, socioeconomic factors act as potential confounders of diabetes, driven by forces that include ageing, rapid unplanned urbanization and the globalization of unhealthy lifestyles. Few data on diabetes and associated risk factors are available from Moradabad Mandal. Therefore, to enable predictions of the future prevalence of diabetes in urban slums in Moradabad area, Uttar-Pradesh, this study aimed to identify prevalence of diabetes mellitus and associated risk factors
Objectives
To determine the prevalence of type 2 diabetes mellitus in study population.
To determine the association of participants at high risk for developing diabetes with various risk factors.
METHODS
Study area
A community based cross- sectional study was conducted in urban slums which are the field practice area of Community Medicine Department under the head of Teerthanker Mahaveer Medical College and Research Center, Moradabad. The study was conducted from April 2015-December 2015. Ethical clearances was taken from the institution.
Sample size
The study conducted by Anjana et al, prevalence of diabetes and pre-diabetes in urban and rural India, revealed that overall prevalence of diabetes in Chandigarh was 13.6%, 10.4% in Tamil Nadu, 8.4% in Maharashtra and in Jharkhand 5.3%.9 In Chandigarh, a city of North India, the prevalence was 14.2% in urban areas and in the rural areas, the prevalence was 8.3%. So, Chandigarh was considered for calculating the sample size.
Sample size= 3.8416pq/d2
Where p= Positive character (14.2%), q= 100 - Positive character= (85.8%)
d= Allowable error (20%) Sample size= 580.
Assuming 10 percent loss to sample because of non-response, final sample size was calculated 638. The final analysis was conducted on 640 participants.
Inclusion criteria
All individuals 30 years of age and above irrespective of disease status were screened for diabetes.
Exclusion criteria
Exclusion criteria were type 1 diabetes patients; pregnant females; those who were seriously ill; non co-operative subjects.
Sampling technique
The present study was carried out in area covered under Urban Health Training Centre. UHTC covered both slum and non-slum areas selected by simple random sampling. All participants aged 30 years and over in each household were included in the study. House-to-house visits were conducted, covering the houses one after the other lane wise. The participants were fully informed regarding the purpose of the study and verbal consent was obtained. The subjects were briefed about the procedure of investigation and advised to remain fasting till their blood sample for blood sugar examination was taken. Each interview began with a general discussion to build rapport with the participants and gain their confidence. Repeat visit was made on the consecutive day early in the morning to measure fasting capillary blood glucose level with the help of Accue Check- Glucometer. Quetelet’s index used to calculate BMI. It was checked by using the formula weight in (kg)/ Height (meter)2.
During each house visit, data were collected using the World Health Organization (WHO) Stepwise approach to surveillance (STEPS), which includes three steps for assessment of risk factors. The three steps are as follows:
Step 1: A predesigned, pretested proforma was used to collect data from the study participants; this included information on socio-demographic characteristics, family history of diabetes etc.
Step 2: Anthropometric measurements were taken for all study participants. Measurements included height, weight, waist circumference and hip circumference.
Step 3: Biochemical testing, i.e. random capillary blood glucose was done.
Data analysis
Appropriate statistical tests of significance were applied to test and validate the findings of the study.
RESULTS
The overall prevalence of diabetes mellitus in the present study was found to be 15.6%. Of these, almost half (6.25%) were newly diagnosed while the remaining were known diabetics. 9.37% of the study population were found to have impaired fasting glucose (Table 1). With respect to age, maximum prevalence of diabetes mellitus was found between the age group of 60-69 years i.e. 44 (28.0%) followed by 26 (19.6%) in 50-59 years
and 22(18.1%) in 40-49 age group whereas in the age group of ≥70 years, a decline in prevalence of diabetes mellitus was seen i.e. just 3 (12.5%). In relation to gender, 83 (19.8%) male were having diabetes as compare to 17 (7.69%) females. While comparing education, prevalence of diabetes was found 63 (26.1%) amongst educated up-to secondary class and just lowest 8 (6.8%) which is in Illiterate group. In socioeconomic status, the prevalence of diabetes mellitus was 18 (21.6%) and 26 (25.2%) in class I and class II respectively followed by 30 (15.1%) in class III, 21 (9.9%) in a class IV and 5 (11.1%) in class V. The association between biosocial characteristics and diabetics’ status was found to be statistically significant (Table 2).
Table 1: Prevalence of type-2 diabetes mellitus and impaired fasting glucose among study population.
Normal Total
Diabetes mellitus Prevalence of
type II DM
Impaired fasting glucose
Known diabetic Newly diagnosed
Number 40 60 100 71 469 640
% 6.25 9.37 15.6 11.1 73.2 100
Table 2: Biosocial characteristics and their association of study subjects according to their diabetic status.
Socio-demographic Variables
Diabetics (100) (%)
IFG (71) (%)
Normal (469) (%)
Total
(640) Chi-square test
Age in years
30-39 5 (2.4) 16 (7.7) 185 (89.8) 206
Chi-square value=61.64, df=8, p=0.00
40-49 22 (18.1) 21 (17.3) 78 (64.4) 121 50-59 26 (19.6) 16 (12.1) 90 (68.1) 132 60-69 44 (28.0) 13 (8.2) 100 (63.6) 157
≥70 3 (12.5) 5 (20.8) 16 (66.6) 24
Gender
Male 83 (19.8) 46 (10.9) 290 (69.2) 419 Chi-square value=16.35, df=2, p=0.00
Female 17 (7.69) 25 (11.3) 179 (80.9) 221
Education
Illiterate 8 (6.8) 9 (7.6) 100 (58.1) 117
Chi-square value=37.4, df=6, p=0.00
Up to primary education 19 (11.0) 21 (12.2) 132 (76.7) 172 Up to secondary education 63 (26.1) 29 (12.0) 149 (61.8) 241 Higher education 10(9.0) 12 (10.9) 88 (80.0) 110
Socio economic status (Kuppuswami socio economic status)
Class I 18 (21.6) 14 (16.8) 51 (61.4) 83
Chi-square value=24.12, df=8, p=0.00
Class II 26 (25.2) 15 (14.5) 62 (60.1) 103 Class III 30 (15.1) 17 (8.5) 151 (76.2) 198 Class IV 21 (9.9) 20 (9.4) 170 (80.5) 211 Class V 5 (11.1) 5 (11.1) 35 (77.7) 45
Table 3: Association between family history and diabetic status among respondent.
Family history Diabetes mellitus (%) IFG (%) Normal (%) Total Chi-square value
Absent 50 (10.0) 27 (5.4) 422 (84.5) 499
Chi-square value=152.4, df=4, p=0.00
One parent 32 (33.3) 29 (30.2) 35 (36.4) 96
Both parent 18 (40.0) 15 (33.3) 12 (26.6) 45
Table 4: Association between body mass index and diabetics status of study participants.
Body mass index Diabetes
mellitus (%) IFG (%) Normal (%) Total Chi-square value
<18.5 (underweight) 6 (10.5) 3 (5.26) 48 (84.2) 57
Chi-square value=38.50, df=8, p=0.00
18.5-24.9 (average) 36 (12.5) 20 (6.99) 230 (80.4) 286
25-29.9 (pre obese) 31 (17.2) 25 (13.8) 124 (68.8) 180
30-34.9 (obese class I) 18 (19.3) 16 (17.2) 59 (63.4) 93
35.0-39.99 (obese class II) 9 (37.5) 7 (29.1) 8 (33.3) 24
Total 100 (15.6) 71 (11.1) 469 (73.2) 640
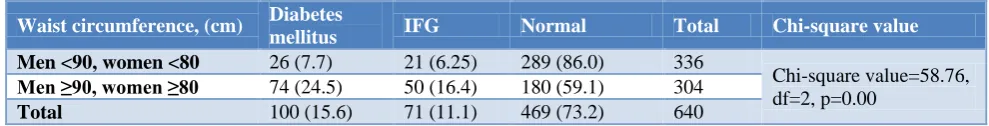
Table 5: Correlation between waist circumference and diabetics status of respondents.
Waist circumference, (cm) Diabetes
mellitus IFG Normal Total Chi-square value
Men <90, women <80 26 (7.7) 21 (6.25) 289 (86.0) 336
Chi-square value=58.76, df=2, p=0.00
Men ≥90, women ≥80 74 (24.5) 50 (16.4) 180 (59.1) 304
Total 100 (15.6) 71 (11.1) 469 (73.2) 640
Family history plays a very important amongst diabetics. The persons with both parents positive family history showed maximum prevalence of 18 (40.0%) of DM which was followed by 32 (33.3%) in persons with one parent positive family history in the present study. Association was found statistically significant between family history of diabetes mellitus and prevalence of diabetes (Table 3).
While calculating the body mass index of study population, maximum number of diabetic individuals i.e. 9 (37.5%) were found in obese class II followed by 18(19.3%) in obese class I and 31 (17.2%) in pre obese class, whereas minimum number of diabetic individuals i.e. 6 (10.5%) were in underweight class. The association was found statistically significant between diabetes mellitus and body mass index (Table 4).
In both sexes, a total of 74 (24.5%) had waist circumference ≥90 in men, ≥80 in women and 26 (7.7%) had waist circumference <90 in men and <80 in women respectively. The association between waist circumference and risk status was highly significant statistically (Table 5).
DISCUSSION
The prevalence of diabetes mellitus was found to be 15.6% in the present study. Similar study carried out by Anjana et al reported 14.2% prevalence among urban population of 20 years and above.9 The current study noted that, as age increases, the risk for diabetes also increases except in the age group of ≥70 years. Several other studies have noted similar findings.10–12 Two further studies found a positive association between higher age and undiagnosed diabetes.13,14 In the present study 83 (19.8%) male were having diabetes as compare to 17 (7.69%) females. On the contrary, study done by Arora et al noted that more high-risk cases were seen in women
than in men in urban Haryana, and there was a statistically significant association.15 However, a study done by Misra et al in an urban slum of Delhi showed no statistically significant association between gender.3 While assessing the socio-economic status of participants, prevalence of diabetes mellitus was highest i.e. 26 (25.2%) among middle socio-economic class followed by 18 (21.6%) in upper socioeconomic class and least i.e. 5 (11.1%) in the lower socioeconomic class. Ramachandran et al also reported prevalence of diabetes mellitus to be more among high-income group.16 Ramchandran et al again in stated that prevalence of diabetes was found to be lower in the low socio-economic group living in urban areas compared with the high income group.17 However, Mohan et al in found a significant association between diabetes and higher socioeconomic class.10
the BMI, it has been observed that prevalence of diabetes was increasing with high BMI.19-21 Study done by Pandya et al showed that prevalence of obesity is more in diabetic individuals.22 Another study conducted by Jayawardena et al concluded in his study that higher BMI and high waist hip ratio had increased risk of diabetes mellitus.23 In both sexes, a total of 74 (24.5%) had waist circumference ≥90 in men, ≥80 in women and 26 (7.7%) had waist circumference <90 in men and <80 in women respectively. The association between waist circumference and risk status was highly significant statistically. Waist circumference is a more powerful determinant of subsequent risk of diabetes mellitus.10 Several other studies have noted a significant association between waist circumference and undiagnosed diabetes, which is similar to the findings of the present study.13,18,25-27
CONCLUSION
Based on study findings it has been observed that there was statistically significant association between socio-demographic variables like age, sex, education, socioeconomic status and type 2 diabetes mellitus. The family history, BMI and waist circumference were the most common factors found in participants who were at high risk for diabetes. People who are at a high risk of developing diabetes like elderly and those with genetic susceptibility should begin to control their food and activities at a very early stage of life since the onset of diabetes is getting earlier now a days. Measures must be taken to improve awareness among urban population and patient counseling and diabetes education programs can be conducted. Mass communication media could play an essential role in creating awareness among the public about the disease.
ACKNOWLEDGEMENTS
Authors are thankful to the Prof and HOD of Community Medicine department Dr. Anurag Shrivastava,
Teerthanker Mahaveer Medical College and Research Center, Moradabad for making suitable arrangements for the research work. Special thanks to the team of MSW for their support in data collection.
Funding: No funding sources Conflict of interest: None declared
Ethical approval: The study was approved by the Institutional Ethics Committee
REFERENCES
1. Reddy KS. Prevention and control of non-communicable diseases: status and strategies. New Delhi: Indian Council for Research on International Economic Relations; 2003 (Working Paper 104; Available at: https://www.syndromic.org/storage/ documents/NCDs/NCDStatusIndia2003_
SrinathReddy.pdf. Accessed on 22 February 2016.
2. Anand K, Shah B, Yadav K. Are the urban poor vulnerable to non-communicable diseases? A survey of risk factors for non-communicable in urban slums of Faridabad. Natl Med J India. 2007;20(3):115–20. 3. Misra A, Pandey RM, Rama DJ. High prevalence of diabetes, obesity and dyslipidemia in urban slum population in northern India. Int J Obes Relat Metab Disord. 2001;25(11):1722–9.
4. Gupta M, Singh R, Lehl SS. Diabetes in India: a long way to go. Int J Sci Rep. 2015;1(1):1-2. 5. Joslin’s Diabetes Mellitus. 13th ed. Lea and
Febiger: A Waverly company; 1994: 133.
6. World Health Organization (WHO). Global Report on Diabetes. Geneva: WHO, 2016.
7. Park K. Park’s Textbook of Preventive and Social Medicine. 24th ed. Jabalpur: M/s Banarasidas Bhanot; 2017.
8. American Diabetes Association. Standards of Medical Care in Diabetes. Diabetes Care. 2013;36(1):11-66.
9. Anjana MR, Pradeepa R, Deepa M, Datta M, Sudha V, Unnikrishnan R, et al. The Indian Council of Medical Research–India Diabetes (ICMR–INDIAB) Study: Methodological Details. J Diabetes Sci Technol. 2011;5(4):906–14.
10. Mohan V, Shanthirani CS, Deepa R. Glucose intolerance (diabetes and IGT) in a selected South Indian population with special reference to family history, obesity and lifestyle factors – the Chennai Urban Population Study (CUPS 14). J Assoc Physicians India. 2003;51:771–7.
11. Singh RB, Bajaj S, Niaz MA, Rastogi SS, Moshiri M. Prevalence of type 2 diabetes mellitus and risk of hypertension and coronary artery disease in rural and urban population with low rates of obesity. Int J Cardiol. 1998;66(1):65–72.
12. Menon VU, Kumar KV, Gilchrist A, Sugathan TN, Sundaram KR, Nair V, et al. Prevalence of known and undetected diabetes and associated risk factors in central Kerala – ADEPS. Diabetes Res Clin Pract. 2006;74(3):289–94.
13. Hadaegh F, Bozorgmanesh MR, Ghasemi A, Harati H, Saadat N, Azizi F. High prevalence of undiagnosed diabetes and abnormal glucose tolerance in the Iranian urban population: Tehran lipid and glucose study. BMC Public Health. 2008;8:176.
14. Wang H, Qiu Q, Tan LL, Liu T, Deng XQ, Chen YM, et al. Prevalence and determinants of diabetes and impaired fasting glucose among urban community – dwelling adults in Guangzhou, China. Diabetes Metab. 2009;35(5):378–84.
15. Arora V, Singh MJ, Khanna P, Goyal N, Kumar N, Singh M. Prevalence of diabetes in urban Haryana. Australas Med J. 2010;3(8):488–94.
17. Ramachandran A. Socio-Economic Burden of Diabetes in India. JAPI. 2007;55:9-12.
18. Gupta R. Diabetes in India: current status. Express Health Care. 2008 Available at: http://archivehealthcare.financialexpress.com/20080 8/diabetes02.shtml. Accessed on 9 March 2016. 19. Ahmad J, Masoodi MA, Ashraf M, Rashid R,
Ahmad R, Ahmed A, et al. Prevalence of diabetes mellitus and its risk factors in age group of 20 years and above in Kashmir, India. Al Ameen J Med Sci. 2011;4(1):38–44.
20. Kumar P, Mallik D, Mukhopadhyay DK, Sinhababu A, Mahapatra BS, Chakrabarti P. Prevalence Of Diabetes Mellitus, Impaired Fasting Glucose, Impaired Glucose Tolerance, And Its Correlates Among Police Personnel In Bankura District of West Bengal. Indian J Public Health. 2013;57(1):24-28.
21. Valliyot B, Sreedharan J, Valliyot SB, Muttappallymyalil J. Demographic parameters associated with Type 2 Diabetes Mellitus in North Kerala, India. Am J Res Communication. 2014;2(9):39-48.
22. Kumar SS, Singh BD. Biochemical Parameters Variations in Type–II Diabetes Mellitus: Special Reference in Rewa Region. Asian J Res Chem. 2014;7(10):877-81.
23. Pandya H, Lakhani JD, Patel N. Obesity is becoming synonym for diabetes in rural areas of
India also – an alarming situation. Int J Biol Med Res. 2011;2(2):556-60.
24. Ranil Jayawardena R, Ranasinghe P, Byrne NM, Soares MJ, Katulanda P, Hills AP. Prevalence and trends of the diabetes epidemic in South Asia: a systematic review and meta-analysis. BMC Public Health. 2012;12:380:1-11.
25. Ramachandran A, Mary S, Yamuna A. High prevalence of diabetes and cardiovascular risk factors associated with urbanization in India. Diabetes Care. 2008;31:893–8.
26. Bener A, Zirie M, Janahi IM, Al-Hamaq AO, Musallam M, Wareham M. Prevalence of diagnosed and undiagnosed diabetes mellitus and its risk factors in a population-based study of Qatar. Diabetes Res Clin Pract. 2009;84(1):99–106. 27. Satman I, Yilmaz T, Sengül A, Salman S, Salman F,
Uygur S, et al. Population-based study of diabetes and risk characteristics in Turkey: results of the Turkish Diabetes Epidemiology Study. Diabetes Care. 2002;25:1551–6.