Survey on Electricity Consumption using Data
Mining Techniques
K. Kalaiselvi
Research Scholar, Department of Computer Science, Government arts college, Udumalpet-642126 Email: [email protected]
Dr. J. Abdul Samath
Assistant professor, Department of Computer Science, Government arts college, Udumalpet-642126 Email: [email protected]
---ABSTRACT ---Electric energy consumption is the extent of energy or power used. This is the actual energy stipulate made on existing electricity supply. The biggest reason why it is important to be energy conscious and why to make every effort to conserve our electricity are conservation can save our money and Fossil fuels are not a clean source of energy either. Conservation of electrical energy can help to reduce greenhouse gas emissions. Data mining is one of the effective methods to analyze the electricity consumption. Data mining is the process of discovering useful patterns from the database. Association rule and K-means clustering has widely used data mining technique to analyze the electricity consumption.
Keywords - Association rule, Data mining, Electricity consumption, K-means clustering, MATLAB, WEKA. --- Date of Submission: Oct 16, 2018 Date of Acceptance: Nov 13, 2018 ---
---I.
Introduction
D
ata mining is the nontrivial extraction of implicit, previously unknown, and potentially useful information from data. The process of employing one or more computer learning techniques to automatically analyze and extract knowledge from data contained within a database. Data mining is used to make good decisions. It's divided into predictive and descriptive models. The predictive model is known as supervised learning. It predicts unknown values based on known data. Association rule is a rule-based machine learning method for discovering interesting relations between variables in large databases. It is intended to identify strong rules discovered in databases using some measures of interestingness. The descriptive model is known as unsupervised learning. It identifies the patterns in data. Clustering is the process of organizing objects into groups whose members are similar in some way. K-means clustering is the most common partitioning algorithm. K-Means re-assigns each record in the dataset to only one of the new clusters formed. A record or data point is assigned to the nearest cluster (the cluster which it is most similar to) using a measure of distance or similarity.India is the world’s third largest electricity producer. The electricity usage is inevitable to each and everyone. The biggest reason for less consumption of electricity is to conserve our electrical energy. The emerging challenges and issues in the energy market of the twenty first century is the changes in the electrical systems are inevitable. Generally the electricity is generated by renewable and nonrenewable energies. Fossil fuels which come under
nonrenewable energy is not a clean source of energy either.
1.1 Renewable resource
A natural resources is fairly straightforward to interchange that embrace wood, wind, sunshine, heat energy, biomass and water hold on behind dams in lakes and reservoirs. Electricity are often created victimization many forms of renewable resources.
Wind energy will turn out electricity in regions wherever steady winds blow. Giant wind turbines capture the wind's energy and use it to power generators.
Biomass is material that is shaped from living organisms, like wood or agricultural wastes. Biomass are often burned to provide electricity, or regenerate to a gas and used for fuel. Geothermalenergy uses predicament or steam from deep to a lower place the layer to supply electricity. Hydroelectric power is generated victimization the energy created by falling water to spin the generator turbines of electricity power plants and build electricity. Solar energy may also be accustomed turn out electricity. star cells modification the energy of the sun into voltage. Some calculators and moveable radios square measure supercharged by star cells. star panels, or modules, placed on a top side will offer electricity to the building below.
1.2 Nonrenewable resource
II.
Literature Survey
Analysis and predicting electricity energy consumption using data mining techniques[1], The research objective is analyzing the electricity consumption rate in recent years and predicting future consumption. Energy is the foundation of economic development, and electricity is one of the major energy sources.
In this research, based on the conducted analyses, the regression model generated less error rate on the hesitant data compared to other models towards the electricity consumption prediction. The predictor variables in this research include inhabitants, temperature, damp, and electricity consumption price. Based on the research, the electricity consumption growth rate in the year 2020 will increase by 22.28% compared to the year 2013. While the electricity consumption growth rate between the years 2006 to 2013 and the years 1999 to 2006 equaled 28.41 and 73.53, respectively. Moreover, the results obtained from these predictions indicate that the electricity consumption on average will have a 3.2% increase per year. In the conducted analysis, population is the most important factor participating in electricity consumption and has a great effect on the increase in electricity consumption rate.
Electricity Consumption Time Series Profiling: A Data Mining Application in Energy Industry[2], the electricity utilities have classified customers according to their business nature (i.e., industrial, commercial, and residential) and their consumption bands (e.g., annual consumption < 2,000kWh, >5,000kWh, or > 18,000kWh) and housing types (e.g., detached houses, town houses, and multi-Storeyed buildings) for household customers. Even in the same customer class, the consumption patterns may vary considerably due to customers’ business nature / lifestyle diversity. SOM-based visual data mining approach used to investigate how the electricity utilities can fully explore smart meter data to gain better knowledge about their customers’ time electricity consumption patterns, and in turn to support pricing decision-making.
Technical and non-technical losses in power system and its economic consequence in Indian economy[9], The electricity demand is increasing every year in almost every sector. Installing and starting new electricity generation plants is difficult due to environmental preservation awareness and pollution control policies of government. To overcome this problem, proper electricity consumption profiling can be used to find alternate ways for managing electrical loads in the near future with existing electricity generation capacity. Electricity profiling can be carried out for individual consumers, on a small area and at regional levels.
Different regions in a city have a different electricity consumption pattern with respect to locality and nearest man-made geographical features. Similarly, regions at different geographical locations may have similar or matching electricity consumption pattern in
association with similar geographical features such as cities on the bank of rivers or at the same altitude (hilly areas). The consumption pattern of a region is highly influenced by geographical features and environmental conditions like atmospheric temperature, humidity and rainfall.
Regional electricity consumption analysis for consumers using data mining techniques and consumer meter reading data [3], The present study focuses on examining consumer’s electricity consumption within the electricity distribution region and impact of spatial feature’s proximity to consumer’s location (region). Spatial features nearer to consumer’s electricity distribution region are identified, such as water body (river and pond), playing ground, farm (agricultural land) and the highway. Any geographic feature dependencies on electricity consumption are reflected in generating association rules. The summarized association rule depicts the changes in consumption patterns for consumers residing nearer to the highway or farm (high and low electricity consumption respectively). The semantic knowledge about geographic features closer to consumer’s location helps to predict their electricity consumption behavior. Moreover, such patterns are helpful for prediction of electricity usage in such regions and town planning.
A detailed study of individual consumers profiling is needed to characterize each consumers’ electricity consumption pattern using spatial features such as location, type and size of residence (bungalow or apartment), vegetation surroundings and nearer to the road. Some non-spatial features are also important to consider including income, number of people in residence and appliances. Detailed consumer and regional profiling using GIS, GPS and remote sensing is helpful for prediction and demand analysis, theft and fraud detection, planning and growth in an electricity distribution network.
III.
Case study of a consumer
’
s electricity
consumption data from Sangli city [3]
The study has been carried out on consumer’s data from Sangli city (16.86_ N, 74.57_ E) located on the banks of river Krishna in the western part of Maharashtra state, India. The valley of the river Krishna offers many irrigation and agricultural advantages to Sangli city and district. Due to large scale irrigation, agriculture, farming is the main business around Sangli district and nearby region. The physical location of Sangli city comes under Deccan plateau, nearly 120 km away from the Arabian Sea and at 549 m height from mean sea level. Fig. 1 shows the location map of Sangli city used for study.
3.1 Data selection, cleaning and pre-processing
consumption pattern at various levels, such as individual consumers, zone and at regional level in an electricity distribution network. To analyze huge data, data pre-processing operations are carried out in first step before applying data mining algorithm [11,12]. Data pre-processing includes preparation of data in desired form to work, which is clean and free from any noise. It is also used for reduction of actual huge data into summative workable data to avoid unnecessary processing of unwanted, meaningless data. Consumers monthly electricity consumption values are checked and inconsistent consumers are removed from the study data. 3.2 Clustering
Clustering is an important technique applied to form groups or clusters of data, which represents a common property of entire elements within the group [16–19]. Each element within cluster represents a class or common property among them. Clustering algorithms are used for various data types including numerical, categorical and multimedia [20,21]. In this proposed study, work clustering algorithm is applied to consumer’s monthly electricity consumption data and atmospheric temperature of study location. The detailed implementation is discussed as follows.
3.2.1 Consumers clustering
K-means clustering algorithm is used to form clusters of consumers using monthly electricity consumption data over the year 2013. The results of implementation in Matlab are compared with WEKA software results to validate correctness and validity of implementing the clustering algorithm. The K-means clustering algorithm using Euclidean distance is executed on consumer data to form 4, 8, 16 and 32 clusters of consumers. It has been observed that 8 clusters represent useful information about consumers as the results are very close to WEKA results. Table 1 shows a comparison of both results.
3.2.2 Atmospheric temperature clustering
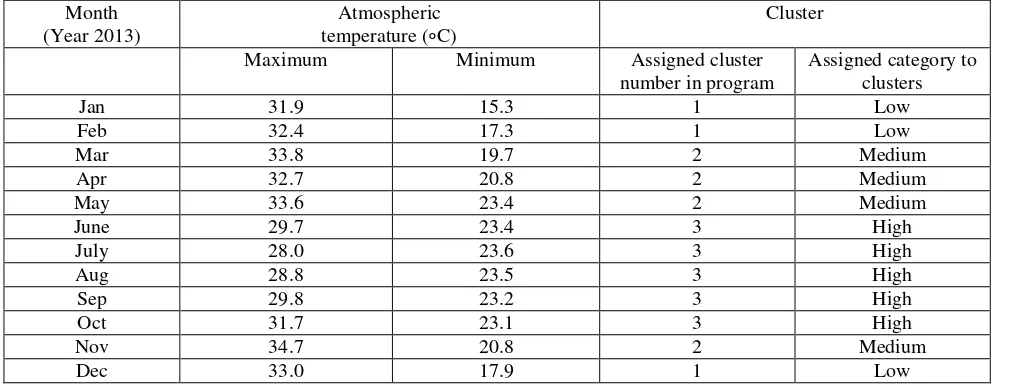
Atmospheric temperature plays a substantial role in consumer behavior with respect to economic and health conditions. The atmospheric temperature of the Sangli city is amassed for the duration of the year 2013 with daily minimum and maximum temperature. Clustering of monthly average temperature is carried out to form 3 and 4 clusters of months with similar weather conditions to examine the impact of weather on electricity consumption in the period. The obtained clusters of months based on atmospheric temperature using K = {3;4} are {3;4;5} and {1;3;3;5} respectively. For further analysis, 3 clusters are used as it gives a proper classification of months over the year with respect to atmospheric temperature since the Indian weather has broadly 3 seasons). Table 2 shows average minimum and maximum atmospheric temperature for all months in the year 2013. K-means clustering algorithm for three clusters (K = 3) is executed and each month is attributed to its class (low, medium and high temperature).
Table 1 Result comparison of Matlab program and WEKA software.
Cluster Id.
Consumer count Consumers misclassification K-means
clustering
WEKA results
Count % Difference
C 11,995 11,873 122 0.63
A 5866 5948 82 0.42
B 990 1028 38 0.19
F 165 170 5 0.02
E 88 88 0 0.00
G 47 47 0 0.00
H 20 20 0 0.00
D 3 3 0 0.00
Total 19,174 247
3.3 Association rule generation of geographic features and electricity consumption
Agrawal et al.[3] proposed ‘Apriori’ algorithm for finding an association rules using support and confidence measures. Support and confidence of a rule are expressed by Eqs. (1) And (2).
𝑆𝑢𝑝𝑝𝑜𝑟𝑡(𝑋) =Support(X)N ;
N= Total number of transactions (1) 𝐶𝑜𝑛𝑓𝑖𝑑𝑒𝑛𝑐𝑒(X → Y) =Support (X∪Y)Support (X) (2)
Geographic features play a vital role in leaving style of human beings. Day to day life is highly affected by climatic conditions which depend on related geographic natural features. All historical and major cities are situated either on the bank of the river, at the bottom of mountains or at specific geographical condition to meet day to day needs for a better lifestyle.
Association rules are best to depict the relationship between dependent entities. The impact of nearest geographical features of electricity consumption is to be studied with the help of the association rule building. For study purposes, geographical distance criteria are looked at to compare electricity consumption of six regions that have been used for clustering analysis. The geographic features selected for study are river, farm and open space (ground). Table 3 shows the relative distance of all regions from selected geographical features.
3.4 Data mining model, analysis and results
The proposed data mining model works in two modules. In phase 1; relationship between atmospheric temperature and electricity consumption is established using electricity consumption data of one year and in phase 2; the effect of geographical objects on the electricity consumption of city at regional level.
The K-means clustering algorithm used to form clusters from consumer’s monthly electricity consumption (units) data and average monthly temperature of the city to get 3 and 8 clusters of data respectively (the number of clusters formed with respect to Sections ‘Consumers clustering’ and ‘Atmospheric temperature clustering’ respectively). In second module association rules are generated using
‘Apriori’ algorithm [11] to generate association rules between (a) atmospheric temperatures and consumer’s electricity consumption, and (b) consumers in the electricity distribution region and geographical objects. Geographical objects are selected in such a way to check the impact on electricity consumption by consumers.
Table 2 Atmospheric temperature and its clustering result. Month
(Year 2013)
Atmospheric temperature (∘C)
Cluster
Maximum Minimum Assigned cluster
number in program
Assigned category to clusters
Jan 31.9 15.3 1 Low
Feb 32.4 17.3 1 Low
Mar 33.8 19.7 2 Medium
Apr 32.7 20.8 2 Medium
May 33.6 23.4 2 Medium
June 29.7 23.4 3 High
July 28.0 23.6 3 High
Aug 28.8 23.5 3 High
Sep 29.8 23.2 3 High
Oct 31.7 23.1 3 High
Nov 34.7 20.8 2 Medium
Dec 33.0 17.9 1 Low
Table 3 Geographic features of all regions (feeder) Feeder Name Feeder Id Geographical Features Proximity to Highway
Average annual electricity Consumption
River Ground Farm Units Assigned
Category Government
colony
F-1 Yes No Yes No 108.18 Low
Vijay Nagar F-2 No Yes No Yes 190.97 High
Vishrambagh F-3 No Yes No Yes 139.82 Medium
Datta Nagar F-4 Yes No Yes No 120.93 Low
Doordarshan F-5 Yes No Yes Yes 133.29 Medium
Industrial F-6 No No No No 132.97 Medium
3.5 Consumer electricity consumption data
Nearly twenty thousand consumers are used for study purpose. These consumers are clustered into 8 clusters using monthly electricity unit’s consumption. It is found that nearly 62% consumers use less than 100 units per month while 30% consumers’ consumption is ranging in between 100 and 200 units of electricity per month and only 20 consumers uses more than 3000–8000 units per month, which is about 80% of total electricity use (few commercial offices and common buildings). Table 4 gives details of maximum and minimum monthly electricity consumption in each cluster.
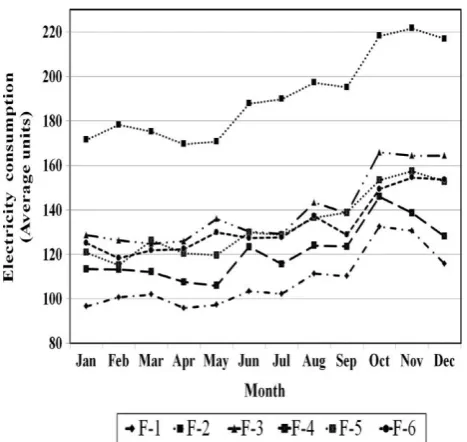
It has been observed that each region has a specific pattern of electricity consumption, which represents regions locality and
economic status. In all regions, electricity consumption pattern over the year is similar with variations in actual electricity consumption units. Figs. 3 and 4; show average monthly electricity consumption of all regions and electricity consumption clusters.
3.6 Atmospheric temperature
monthly temperature for the year 2013 and average temperature of assigned clusters.
3.7 Relationship between atmospheric temperature and electricity consumption
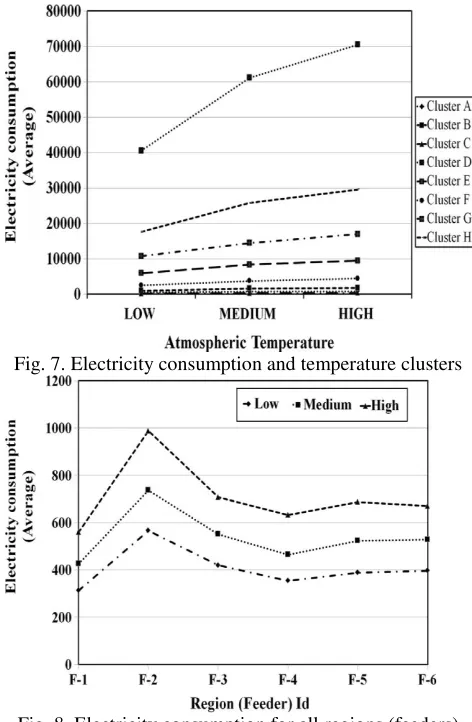
It has been observed that the electricity consumption is directly proportional to temperature. The electricity use increases as an increase in minimum temperature, because the maximum temperature is comparatively small for high temperature cluster than low and medium temperature clusters, but the lower limit temperature is comparatively larger than others. Normally minimum temperature is recorded at night time; it suggests that the electricity consumption increases during night time due to excessive consumption of electrical and electronic appliances for cooling, entertainment and lighting. It has been observed that the electricity consumption pattern is similar in all clusters. The electricity consumption variation in clusters (arranging in decreasing order: D, H, G, E, F, B, A and C) highlights the electricity consumption pattern of clusters, it is noticed that the electricity consumption varies drastically in response to temperature on high electricity using consumers than low. Figs. 7 and 8 represents the relationship between atmospheric temperature and electricity consumption for all clusters.
Fig. 3. Average monthly electricity consumption of all regions for year 2013.
Fig. 4. Average monthly electricity consumption of all consumer clusters.
Fig. 5. Average monthly temperature for year 2013.
Fig. 7. Electricity consumption and temperature clusters
Fig. 8. Electricity consumption for all regions (feeders) with temperature (clusters)
3.8 Association rule analysis
Matlab implementation of Apriori algorithm is executed on the data prepared using Table 3. With a minimum confidence of 30%; fourteen association rules are refined as follows.
(a) Geographical_feature(River, Near)⟶ Electricity_consumptions (Low) Conf: (66.67%)
(b) Geographical_feature (River, Near) ⟶Electricity_consumptions (Medium) Conf: (33.33%)
(c) Geographical_feature (Farm, Near)⟶Electricity_consumptions (Low) Conf: (66.67%)
(d) Geographical_feature (Farm, Near)⟶ Electricity_consumptions (Medium) Conf: (33.33%)
(e) Geographical_feature (Ground, Near)⟶ Electricity_consumptions (High) Conf: (50.00%)
(f) Geographical_feature (Ground, Near) ⟶Electricity_consumptions (Medium) Conf: (50.00%)
(g)Geographical_feature (Highway, Near) ⟶ Electricity_consumptions (High) Conf: (33.33%)
(h)Geographical_feature (Highway, Near) ⟶ Electricity_consumptions (Medium) Conf: (66.66%)
(i) Geographical_feature (River, Near) ^
geographical_feature(Farm, Near)
⟶Electricity_consumptions (Low) Conf: (66.67%)
(j) Geographical_feature (River, Near) ^
geographical_feature(Farm, Near)
⟶Electricity_consumptions (Medium) Conf: (33.33%) (k) Geographical_feature (River, Near) ^ geographical_feature (Highway, Near) ⟶Electricity_consumptions (Medium) Conf: (100%)
(l) Geographical_feature (Farm, Near) ^ geographical_feature (Highway, Near) ⟶Electricity_consumptions (Medium) Conf: (100%)
(m) Geographical_feature (Ground, Near) ^ geographical_feature (Highway, Near) ⟶Electricity_consumptions (High) Conf: (100%)
(n) Geographical_feature (River, Near) ^ geographical_feature (Farm, Near) ^ geographical_feature (Highway, Near) ⟶Electricity_consumptions (Medium) Conf: (100%)
Obtained association rules are simple and give information about electricity consumption patterns of regions. These association rules explain the effect of geographic proximity on electricity consumption. Lower consumption of electricity with 66.67% confidence is observed in the nearby region of river or farm; alone or together, whereas medium electricity consumption is in regions, where either ground or highway is near with a confidence in the range 50–66.67%. The regions adjacent to the ground and nearer to the highway use highest electricity as compared with other regions having 100% confidence. It has been observed that highway is the main cause of an increase in electricity consumption, whereas natural features river and farm decreases electricity consumption. Finally, generalized association rules are summarized in following five rules:
(a) IF (River AND Farm, Near) THEN Electricity consumption (Medium OR Low)
(b) IF (River OR Farm, Near) THEN Electricity consumption (Medium OR Low)
(c) IF (Ground OR Highway, Near) THEN Electricity consumption (High OR Medium)
(d) IF ((River OR Farm, Near) AND (Highway, Near) THEN Electricity consumption (Medium)
(e) IF (Ground AND Highway, Near) THEN Electricity consumption (High)
association rule depicts the changes in consumption patterns for consumers residing nearer to the highway or farm (high and low electricity consumption respectively). The semantic knowledge about geographic features closer to consumer’s location helps to predict their electricity consumption behavior. Moreover, such patterns are helpful for prediction of electricity usage in such regions and town planning.
IV.
Conclusion
Different regions in a city have a different electricity consumption pattern. Association rule is used to study about the brunt of nearest geographical. Lower consumption of electricity with 66.67% confidence is observed in the nearby region of river or farm. The regions adjacent to the ground and nearer to the highway use highest electricity as compared with other regions. Whereas natural features river and farm decrease electricity consumption. Geographical distance criteria are looked at to compare electricity consumption of six regions that have been used for clustering analysis. The Matlab and Weka tool predicts nearly same results using clustering for electricity consumption.
References
1. Noorollah Karimtabar, Sadegh Pasban, Siavash Alipour. Analysis and predicting electricity energy consumption using data mining techniques. 2nd International Conference on Pattern Recognition and Image Analysis (IPRIA 2015), 6,2015.
2. Hongyan Liu, Zhiyuan Yao, Tomas Eklund, and Barbro Back. Electricity Consumption Time Series Profiling: A Data Mining Application in Energy Industry. Turku Centre for Computer Science, Abo Akademi University. pp. 52–66, 2012.
3. Ravindra R. Rathod, Rahul Dev Garg. Regional electricity consumption analysis for consumers using data mining techniques and consumer meter reading data. Indian Institute of Technology Roorkee, India. Elsevier Ltd, Vol. 78, pp. 368–374, 2016.
4. Usman Ali, Concettina Buccella, Carlo Cecati. Households Electricity Consumption Analysis with Data Mining Techniques. IEEE,2016.
5. Aaron Jaech et al. Real-Time Prediction of the Duration of Distribution System Outages. http://www.seattle.gov/light/sysstat/map.asp
6. W. Kersting and R. Dugan, “Recommended practices for distribution system analysis,” in Power Systems Conference and Exposition, 2006. PSCE’06. 2006 IEEE PES. IEEE, 2006, pp. 499–504.
7. Bogdan Constantin Neagu, Gheorghe Grigoras. Data Mining Tools in Electricity Distribution Systems. 6th
International Conference on Modern Power Systems MPS2015, 18-21 May 2015.
8. Salawudeen OS, Rashidat U. Electricity distribution engineering and geographic information system (DeGIS). Shape the change, 23 FIG congress, Munich Germany, pp. 1–14, 2006.
9. Navani JP, Sharma NK, Sapra S. Technical and non-technical losses in power system and its economic consequence in Indian economy. Int J Electron Comput Sci Eng;1, 2012,757–61.
10.D. Shakthi Prasad and B. Subba Reddy. Digital Image Processing Techniques for Estimating Power Released from the Corona Discharges. IEEE Transactions on Dielectrics and Electrical Insulation Vol. 24, No. 1; pp.75-82, February 2017.
11.Tintarev N, Masthoff J. Recommender systems handbook; 2011. http://dx.doi.org/10.1007/978-0-387-85820-3.s
12.Venkatadri M, Reddy L. A review on data mining from past to the future. Int J Comput Appl 2011;15:19–22. http://dx.doi.org/10.5120/1961-2623
13.Agrawal R, Srikant R. Fast algorithms for mining association rules. In: Proc. 20th int. conf. very large data bases, VLDB. Santiago de Chile, Chile. p. 1–32, 1994.
14.D. Amarasinghe, U. Sonnadara, M. Berg and V. Cooray, Correlation between Brightness and Channel Currents of Electrical Discharges, IEEE Dielectr. Electr. Insul., Vol. 14, pp.1154-1160,2007.
15. Karampelas SLVVP, Ekonomou L. A power system simulation platform for planning and evaluating distributed generation systems based on GIS. pp.379–91, 2013.
16. Leonard M, Wolfe B. Mining transactional and time series data. In: Nelson Gregory S, editor. Proceedings of the 30 annual SAS users group international (SUGI) Conference. Philadelphia; 2005. p. 1–26. 17. Berkhin P. A survey of clustering data mining
techniques. In: Kogan J, Nicholas C, Teboulle M, editors. Grouping multidimensional data. Springer; 2006. p.25–71.
18. Fu T. A review on time series data mining. Eng Appl
Artif Intell 2011; 24:164–81.
http://dx.doi.org/10.1016/j.engappai.2010.09.007. 19. Wang Z, Tu L, Guo Z, et al. Analysis of user
behaviors by mining large network data sets. Future Gener Comput Syst 2014;37:429–37. http://dx.doi.org/10.1016/j.future.2014.02.015.
20. Djeraba C. Data mining from multimedia. Int J Parallel Emergent Distrib Syst 2007;22:405–6. http://dx.doi.org/10.1080/17445760701207561. 21. Su X. Data mining methods and models. Am Stat