INTRODUCTION
Amino acids with peptide bonds (-NH~~CO-) make large sized protein molecule known as biopolymers. Glycine (NH2-CH2-COOH) is model amino acid with CH3CH2[(COOH)NH2] (α-alanine) and NH2-CH2CH2CH2-COOH (γ-butyric acid), the alpha (α) and α, omega (ω) series respectively. Thus the -NH~~CO- bonds adjoin many amino acid in chain that undergoes primary, secondary, tertiary and quaternary structures with optimization denoted as folded state of the proteins or globular proteins. Due to different electron density on NH and CO groups, the -NH~~CO- bonds remain accessible for interaction with water with distortion or the unfolding of an optimized structure with much entropic change noted as biothermodynamic1-3 phenomenon. Due to peptide bonds with several amino acids, the globules develop many void spaces and polar sites inside the molecules. So largely the proteins remain hydrophobic and weakly hydrophilic
Biophysical behavior and hydrophobic interactions
of globular proteins with aqueous binary solutions
MAN SINGH
Chemistry Research Laboratory, Deshbandhu College, University of Delhi, New Delhi - 110 019 (India).
(Received: July 18, 2008; Accepted: August 19, 2008)
ABSTRACT
Densities (r) and viscosities (η) for 0.5 to 2.0 mg %/100 mLaqueous solutions of Bovine Serum Albumin (BSA), Egg Albumin (E Alb), Lysozyme (Lyso), Gram and Soya Bean proteins with 0.5 mg % mL subsequent increment at temperatures from 293.1, 298.1 and 303.1 Kelvin (K) 0.05°C temperatures were obtained. The densities decrease with concentrations and temperatures except BSA, Gram and Soya with stronger structural interactions for BSA at lower temperatures. The viscosities increase with increase in conc. The Gram shows higher densities at 293.1 K with weaker hydrophobic and slightly higher hydrophilic interactions. The viscosities are higher than those of the water and infer entanglement of biopolymer molecules with drag of a solvent flow. So the proteins undergo structural unfolding with aqueous solutions due to a moderately polar (-NH~~CO-) peptide bond of the protein. Each protein showed stronger hydrophobic interactions than hydrophilic Interaction and Gram protein showed maximum densities at 293.1 K.
Key words: Structure breaking, making, hydrodynamic sphere, Newtonian flow.
where structured or hydrogen bonded water enters inside the molecule with exertion of pressure inside the molecules. So the biothermodynamics infer conformational state and activity in biological processes. So our data are useful for proteins interactions with water, salts, membranes, nucleic acids4-6. Barry and Irving7 studied the viscosities of concentrated aqueous electrolytic solutions and Eisenberg and Pouyet8 the electrostatic interactions of polyvalent systems with coupling approximation9-11 with reduced viscosity. Rice and Kirkwood12 studied the charged sites of macromolecules and a role of counter ion13 with temperature14 under voltage and current as external force affecting a natural behavior of proteins. The viscosities depict structure making and breaking effects on solvents, so the ηsp/c (reduced viscosity) is ηsp/c=ηinta/c+ηinter/c and defines intramolecular hydrodynamic cage15. The η
inta/c and
electronic unoccupied states in structural cavities caused by folding of polypeptides20, 21. Density functional theor y with Silicon Graphics implementation of code22 and local density approximate protein packing. Our data belong to a process where molecules freely move detaining a natural behavior and amino and carboxyl groups with intrahydrogen bonds23-25 contribute to intrinsic viscosities26. Van der Waals forces often denote energy potential, as a function of distance with both
the attractive and repulsion forces at close range depicted by Lennard-Jones potential27. The physical data on bioactive molecules are novel assistance for drug designing and protein engineering30, 31. The Soya lowers down cholesterol in human serum and explains a mechanism of lysine and arginine rich Soya protein with hypocholesterolemic effect. The LDC and HDC cholesterol are interrelated to physical data of the proteins32-37 with hydrodynamic hydrate38-41.
Table1: Densities, ρρρρρ in103kg m-3 and viscosity, ηηηηη in kg m-1s-1 at different temperatures, in Kelvin K
293.15 K
mg %/ BSA E-Alb Lyso
100mL-1 ρρρρρ ηηηηη ρρρρρ ρρρρρ
0.5 0.99788 1.0181 0.99865 1.0139 0.99861 1.0107
1.0 0.99862 1.1054 0.99863 1.0213 0.99849 1.0231
1.5 0.99854 1.1061 0.99855 1.0277 0.99847 1.0245
2.0 0.99835 1.1059 0.99839 1.0269 0.99831 1.0241
298.15 K
0.5 0.99698 0.8929 0.99699 0.8774 0.99700 0.8785
1.0 0.99686 0.8956 0.99696 0.8836 0.99686 0.9068
1.5 0.99673 0.8991 0.99684 0.8876 0.99684 0.9317
2.0 0.99668 0.8989 0.99679 0.8859 0.99679 0.9312
303.15 K
0.5 0.99641 0.7895 0.99625 0.7614 0.99634 0.8039
1.0 0.99622 0.7992 0.99623 0.7769 0.99621 0.8041
1.5 0.99619 0.8085 0.99623 0.7917 0.99607 0.8065
2.0 0.99617 0.8079 0.99619 0.7913 0.99601 0.8059
29315 K
0.5 Gram Soya
1.0 1.00015 1.0011 0.99702 1.0528
1.5 1.00019 0.9970 0.99702 1.0520
2.0 1.00027 0.9963 0.99704 1.0505
0.5 1.00032 0.9961 0.99707 1.0475
298.15 K
0.5 0.99543 0.8691 0.99546 0.8774
1.0 0.99544 0.8684 0.99547 0.8773
1.5 0.99545 0.8670 0.99548 0.8770
2.0 0.99547 0.8640 0.99551 0.8765
303.15 K
0.5 0.99379 0.7358 0.99436 0.7386
1.0 0.99381 0.7351 0.99404 0.7376
1.5 0.99386 0.7338 0.99406 0.7357
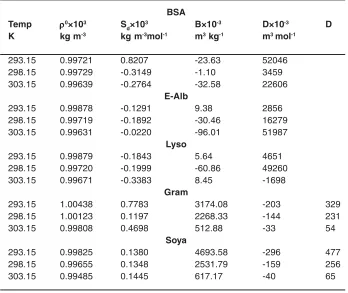
Table 2: Regression constants of densities and viscosities data. BSA
Temp ρρρρρ0×103 S
d×10
3 B×10-3 D×10-3 D
K kg m-3 kg m-3mol-1 m3 kg-1 m3 mol-1
293.15 0.99721 0.8207 -23.63 52046
298.15 0.99729 -0.3149 -1.10 3459
303.15 0.99639 -0.2764 -32.58 22606
E-Alb
293.15 0.99878 -0.1291 9.38 2856
298.15 0.99719 -0.1892 -30.46 16279
303.15 0.99631 -0.0220 -96.01 51987
Lyso
293.15 0.99879 -0.1843 5.64 4651
298.15 0.99720 -0.1999 -60.86 49260
303.15 0.99671 -0.3383 8.45 -1698
Gram
293.15 1.00438 0.7783 3174.08 -203 329
298.15 1.00123 0.1197 2268.33 -144 231
303.15 0.99808 0.4698 512.88 -33 54
Soya
293.15 0.99825 0.1380 4693.58 -296 477
298.15 0.99655 0.1348 2531.79 -159 256
303.15 0.99485 0.1445 617.17 -40 65
EXPERIMENTAL
Aqueous protein solutions were prepared with Millipore water, w/v, the densities and viscosities were measured with 20x10-3dm3 bicapillar y pyknometer and Survismeter42, 43 to ± 0.050C, with Beckman thermometer. The BSA, E-Alb and Lyso were procured from Sigma and the Gram and Soya were extracted from raw dried seed powder of Soya and Gram, respectively and purified with standard methods. The measurements were carried out in a thermostatically controlled water bath with ± 0.050C temperature accuracy, read on Beckman thermometer. Pyknometer and Survismeter were calibrated with aqueous42 NaCl solutions at 298.15 K, with 1×10⁻⁵ mol kg-1 accuracy of solution concentration. Densities for water were used from literature43. Kinetic corrections to energy of Survismeter were with negligible shear on natural flow.
RESULTS AND DISCUSSION
The ρ values were calculated with
equation 1.
...(1)
The ρ solution, ρ0 solvent and 0.0012x10³ kg mol-1 air densities, respectively. The (1-(w-w
e)/ (w0-we)) is buoyancy correction for air, m molality, we, w0 and w are weights of empty, solvent and solution filled pyknometer, respectively. Errors in the densities were with standard statistical methods43. The viscosities (h) are calculated with equation 2.
...(2)
The ρ and ρ0 densities of solution and solvents, t and t0, the flow times, respectively. The ρ data were regressed with equations 3.
The ρ0 is limiting density at infinite dilution c→0, the Sd is slope. An extended Jones Dole equation was used for viscosities data with equation 4.
...(4)
The B (kg mol-1) Jones-Dole coefficient, D (kg mol-1)2 and D’ (kg mol-1)3 are slopes. The D is conc. for protien-protien interactions. The ηr = η/η0 is relative viscosity, the regression constant data are given in table 2.
The densities at 293.1, 298.1 and 303.1 K are as Gram > E Alb > Lyso > BSA > Soya, Lyso > E Alb > BSA > Soya > Gram and BSA > Lyso > E Alb > Soya > Gram respectively. The Gram, Lyso and BSA at 293.1, 298.15 and 303.1 K respectively infer stronger internal pressure with Gram on water molecules associated with –NH- and >CO polar groups due to a compact hydrated structure with higher densities.
The densities at 293.1 K are as Gram > E Alb > Lyso > BSA > Soya. So Gram and E-Alb-water interactions at 293.1 K are stronger which strengthen with increase in composition with a prominent caging of water around protein molecules. But the Lyso, BSA and Soya predict comparatively less internal pressure of polar groups with the weaker interactions and caging. With increase in compositions the interacting strength of the E-Alb remains similar but the strength of BSA, Gram and Soya slightly enhanced than those of the Lyso. With concentrations, the densities at 298.1 K are as Lyso > E Alb > BSA > Soya > Gram. Their densities with increase in compositions decrease except BSA, Gram and Soya but at 293.1 K, the densities for dilute solutions increase and then decrease for subsequent compositions. At 303.1 K, the densities of E Alb for 1.8 and 2.0 mg % are equal and also lower than those of 0.5 mg % (table1).
The trends predict a compact conformational structure at 1.6 mg % with the BSA due to stronger intramolecular interactions with higher densities. The densities of Gram and Soya slightly increase with increase in compositions with stronger protein-protein interactions. The E Alb shows weaker hydrogen bonding with water so the
concentration hinders the protein-water interactions and develops protein-protein-water interactions rather than protein-water interactions (table1). The densities at 303.1 K are as BSA > Lyso > E Alb > Soya > Gram, with lowest densities for Gram and maximum densities for BSA with stronger peptide bond disruption with BSA and least with the Gram. Perhaps unfolded peptide bond develops stronger interaction with water dipoles while the water molecules enter inside void spaces of the Gram molecule and exert higher pressure with larger expansion and lower densities. Probably behavior of the Soya is near Gram while of the Lyso is near BSA. The E Alb shows moderate interaction with water. The densities decrease with temperature that weakens the protein-water interactions.
Limiting densities (ρ0) of proteins with temperature are as 293.1 > 298.1 > 303.1 K except BSA. The values at 293.1 K are as (Lyso = E Alb) > BSA but at 298.1 K the Lyso and E Alb show equal and lower values than that of the BSA. The temperature weakens the intermolecular forces with comparatively lower internal pressure that lead to produce lower densities with temperature increase (table 2). The ρ0 data at 293.1, 298.1 and 303.1 K are as Gram > Lyso > E Alb > Soya > BSA, Gram > BSA > Lyso > E Alb > Soya and Gram > Lyso > BSA > E Alb > Soya, respectively. It infers stronger interaction with Gram and weaker with Soya, respectively.
develop weaker London/dispersive forces with several interactions as per For t and Moore observations40, 41.
The Sd data at 293.1, 298.1 and 303.1 K are as BSA > Gram >Soya> E Alb > Lyso, Soya> Gram > E Alb > Lyso > BSA and Gram >Soya> E Alb > BSA > Lyso, respectively. With higher concentration effects with BSA, Soya and Gram at 293.1, 298.1 and 303.1 K respectively. An increase in concentrations does much disruption in structured water causing stronger interaction with BSA, Soya and Gram at lower, normal and slightly higher temperatures, respectively.
The Sd values are as BSA>E Alb>Lyso, E Alb>Lyso>BSA and E Alb > BSA > Lyso at 293.1, 298.1 and 303.1 K, respectively, and infer composition effect on the protein–water and protein-protein linkages. The higher Sd values at 293.1 K infer higher concentration effect on water structure disruption and the lower values at 298.1 and 303.1 K with slightly weaker composition effects29 (table 2). Attractive forces multipoles of proteins are weaker than those of the ions and dipoles of water. The proteins with multipoles form intrahydrogen bonds between the -NH- and >CO groups to contribute to the interactions.
The viscosities at 293.1, 298.1 and 303.1 K are as Soya > BSA > E Alb > Gram > Lyso, BSA > Lyso > E Alb > Soya > Gram and Lyso > BSA > E Alb > Soya > Gram, respectively, with higher viscosities for Soya, BSA and Lyso at 293.1, 298.1 and 303.1 K. The biopolymers do cause entanglement of the solvents that drag down a flow with higher viscosities. Probably a primary hydration sphere of proteins detains its identity with increase in viscosities with concentration and decrease with temperature (table 1). As the protein-protein sphere of larger size hinders a viscous flow with torsional forces. An increase in the viscosities of polyelectrolyte with dilutions30 could be attributed to an expansion effect of polyionic chains. The solutions show an alignment of counter ions that weakens a screening effect with concentration31 with an increase in molecular size. This increases intramolecular forces with an increase in viscosities which increase with increase in concentrations causing stronger structural reorientation. But at
293.1 K, the disparity is noted with the BSA and Lyso where it first increases and then decreases as 16.2 < 73.8 > 57.8 and 8.8 < 15.1 > 12.5. The viscosities of a Lyso at 303.1 K, decrease from 0.5 to 1.6 mg % and then increase for 2.0 mg % as 7.1 > 5.3 < 5.8. The E-Alb develops weakly non-Newtonian solutions with viscosities at 293.1 K for 0.5 mg % as BSA > E Alb > Lyso, 1.8 mg % BSA > E Alb < Lyso and 2.0 mg % BSA > E Alb > Lyso (table1). The viscosities at 298.1 K are positive but at 298.1 and 303.1 K, are negative and increase with compositions, the BSA and Lyso show positive values with a weaker cage around the protein molecules32. Molecular size enhances the viscosities33.
The B values are as Soya > Gram > E Alb > Lyso > BSA, Soya > Gram > BSA > E Alb > Lyso and Soya > Gram > Lyso > BSA > E Alb at 298.1, 293.1, 303.1, respectively (table 2). It infers lager sized hydrodynamic sphere with both the Soya and Gram while small sized with BSA, Lyso and E Alb at 298.1, 293.1, and 303.1, respectively. The B values are as 298.1 > 293.1> 303.1, 293.1 > 298.1 > 303.1 and 303.1 > 293.1 > 298.1 K for the BSA, E Alb and Lyso (table 2). The protein-water interactions are indirect because with time and temperature, the viscosity changes. The hydration is temperature dependent and varies with size of hydrated sphere. For example at 293.1, 298.1 and 303.1 K, the B values are as E Alb > Lyso > BSA, BSA > E Alb > Lyso and Lyso > BSA > E Albumin. It infers a state of hydration and disruption of hydrogen bonds with structural spontaneity.
and 293.1 for E Alb and 298.1 and 303.1 K for Lyso, respectively. It infers a larger sized protein-water sphere at 298.1 K that develops stronger torsional forces with higher B values for BSA, E Alb and Lyso at 298.1, 293.1 and 303.1 K. The higher D values with BSA, E-Alb and Lyso at 293.1, 303.1 and 298.1 K illustrate higher hydrodynamic volume contribution at respective temperatures. The D’ values are Soya > Gram at 3 temperatures and illustrate interaction dynamics (table 2) and structural reorientations.
CONCLUSION
The ρ0 data decrease with temperature weakening in van der Waals forces, and higher
internal pressure shrinks a protein hydrate size. The compositions affect the proteins interaction. Hydrophobic structure making or hydrophilic breaking tendency was rationalized with the densities and viscosities. The ρ0 and B data denote solute-solvent interactions with Soya-Soya stronger interactions than that of the Gram-Gram.
ACKNOWLEDGEMENTS
Author thanks, University Grants Commission, New Delhi, for financial support and Dr. A. P. Raste, Principal, Deshbandhu College, University of Delhi.
REFERENCES
1. Bassez, M. P.; Lee, J.; Robinson, G.W., J. Phys. Chem. 91: 5818 (1987).
2. Cho, C.H.; Singh, S.; Robinson, G.W., J. Phys. Chem., 107: 7979 (1997).
3. Kamb, B. in Structural Chemistr y and Molecular Biology; Rich, A., Davidson, N., Eds. W.H. Freeman: San Francisco, 507-542 (1968).
4. Burley, S.K.; Petsko, G. A., Adv. Protein Chem. 39: 125 (1988).
5. Nishida, K.; Kaji, K.; Kanaya, T. Polymer 42: 8657 (2001).
6. Arakawa, K.; Takenaka, N. Bull. Chem. Soc. Jpn. 40: 2739 (1967).
7. Barry, R. B.; Irving, F. M., J. Phys Chem. 74: 1056 (1970).
8. Eisenberg, H.; Pouyet, J. J. Polym. Sci. 13: 85 (1954).
9. Tamaki, K.; Ohara, Y.; Isomura, Y. Bull. Chem. Soc. 46: 289 (1973).
10. Chichard, K.; Skinner, J. F. J. Phys. Chem. 73: 2060 (1969).
11. Rice, S.A.; Kirkwood, J.G. J. Chem. Phys., 31: 901 (1959).
12. Wolff, C. J. Phys. France, 39: C2-169 (1978). 13. Nishida, K.; Kaji, K.; Kanaya, T.; Fanjat, N.
Polymer 43: 1295 (2002).
14. Cohen, J.; Priel, Z.; Rabin, Y. J. Chem. Phys. 88: 7111 (1988).
15. No, K.T.; Nam, K-Y.; Scheraga, H. A. J. Am. Chem. Soc. 119: 12917 (1997).
16. Aparicio, F.; Ireta, J.; Rojo, A. J. Phy. Chem. 107: 1692 (2003).
17. Taylor, R. J. Amer. Chem. Soc. 105: 5761 (1983).
18. Man Singh, J. Instr. Exp. Techn., 48(2): 270-271 (2005).
19. Fuoss, R. M.; Strauss, U. P. J. Polym. Sci. 3: 602 (1948).
20. Manning, G. S. J. Chem. Phys. 51: 924 (1969).
21. Singh, Man, J. Chem. Sci., 118(3): 269-274 (2006).
22. Su, T.J., et al J., Langmuir, 14: 438-445 (1998).
23. Potter, S. M J. Nutr., 125: 606S-611S (1995). 24. Beretta, S., et al J. Chem. Phys. 106:
8427-8435 (1997).
25. Aparicio, F., et al J. Phys. Chem. B, 107: 1692-1697 (2003).
26. Burley, S. K. Petsko, G. A. Adv. Protein Chem. 39: 125-189 (1998).
27. Farnum, M., et al Biophys. J. 76: 2716-2726 (1999).
28. Mottonen, J., et al. Nature, 355: 270"273 (1992).
29. Singh Man, J. Chem. Thermodynamic. 39: 241 (2006).
30. Marshall, W. L J. Soln. Chem., 22: 539-554 (1993).
31. Liew K.Y., et al, J. Sol. Chem. 22: 11 (1993). 32. Fort, R. T, et al Trans. Farad. Soc., 62: 1112
(1996).
33. Shitara, Y., et al J. Pharmacol. Exp. Ther. 304(2): 610-616 (2003).
34. Singh Man, J. Biochem. Biophy. Methds, 67(2-3): 151-161 (2006).