INTRODUCTION
The Cucurbitaceae family, a plant group that occurs in the world’s tropical regions, consists of about 120 genera that contain more than 800 species (Heneidak and Khalik, 2015). In Brazil, there are about 30 genera and 200 species (Rubatzky and Yamaguchi, 1997). Among cucurbitaceous vegetables, pumpkin has been appreciated for its high yields, long storage life, and high nutritional values, especially due to its high amounts of carotenoids which act as antioxidants in the human body (Jamali et al., 2018).
When pumpkins are ripe, with yellow or orange flesh, they are rich in vitamins, minerals, dietary fibers, and b-carotene, a precursor of vitamin A. Pumpkins can be converted into a large variety of value-added products such as jam, jelly, marmalade, candy, puree, sauce, chutney, and pickle (Dhiman, Sharma and Attri, 2009; Egbekun et al., 1998; Sharma and Rao 2013). Thus, they may be easily included
in daily diets. They have many health benefits, such as antidepressant, antidiabetic, antioxidant, anticarcinogenic, and anti-inflammatory properties, as the result of compounds which belong to the categories of alkaloids and flavonoids, in addition to palmitic, oleic, and linoleic acids found in various parts of the plant (fruit, seed and leaf) (Yadav et al., 2010).
Cucurbita maxima Duch., known as moranga, moganga, mogango, and bugango in Brazil, is a dark green fruit before ripening, with striations which vary from bright yellow to beige but are intense orange when fully ripe. The shape of the moranga pumpkin is globular and relatively broad; its usually well-shaped buds give it a fluted form. It weighs between 2 and 3 kg (Sharma and Rao 2013). Cucurbita moschata Duch., known as scented pumpkin or squash, is a species native to the mid-Atlantic and southeastern United States and tolerant to hot and humid weather (Carvalho et al. 2012). Since pumpkin is a widely consumed vegetable in the human diet, this study aimed to evaluate the relation between physicochemical characteristics and sensory profiles of pumpkin varieties. Samples were coded as follows: PS is the scented pumpkin (PS01, PS02, PS03), MP is the moranga pumpkin (MP01), HP is the hybrid pumpkin (HP02, HP03, HP12), and CP is the commercial hybrid Tetsukabuto pumpkin. Pumpkin varieties were evaluated as to total titratable acidity, pH, soluble solids, carotenoid content, cooking time, color, hardness, descriptive sensory analysis, preference, and purchase intention (affective sensory analysis). Consumers’ profiles were evaluated by an online questionnaire. The highest values of total soluble solids and scores for sweet taste in the sensory evaluation were shown by PS02 and CP. The former exhibited the highest carotenoid content (172.88 mg 100g-1) while the hybridization process resulted in pumpkins (HP02,
HP03 and HP12) with the lowest total carotenoid content (50.94-51.90 mg 100g-1). All pumpkin varieties were mostly yellow (positive
b* value). The consumers’ profile shows their preference for small fruits (mass between 1.0 and 1.5 kg) that are peeled and whose pulp is orange. Association between the descriptive test and the preference one showed that orange pumpkins were prefered by the sensory panel. The sensory profile and physicochemical characteristics are important tools to the production of hybrids and breeding of genetic pumpkin varieties. This is a field of research that has grown lately and may result in higher productivity and quality of this vegetable.
Keywords: Cucurbita maxima Duch; Curcubita moschata Duch; Consumption; New varieties
A B S T R A C T
http://www.ejfa.me/
Relation between physicochemical characteristics and
sensory profiles of cooked pumpkin varieties
Adrielle Borges de Almeida1, Thayanara Mayara de Lima1, Josemar Gonçalves de Oliveira Filho1,
Railany Vieira Santana1, Daniele Silva Lima1, Estenio Alves Moreira2, Mariana Buranelo Egea1*
1Goiano Federal Institute of Education, Science and Technology, 75901-970, Rio Verde, GO, Brazil, 2Goiano Federal Institute of Education, Science and Technology, 75.650-000, Iporá, GO, Brazil
*Corresponding author:
Mariana Buranelo Egea,Goiano Federal Institute of Education, Science and Technology, Campus Rio Verde, Rod. Sul Goiana, Km 01, Cx Postal 66, CEP: 75901-970, Rio Verde, GO, Brazil. Phone: +55 64 3620 5600. E-mail: [email protected]
In recent decades, research conducted by national agricultural research programs and other research organizations has looked for new methods for growing vegetables such as pumpkins to improve their productivity and resistance to pests and diseases (Steiner-Asiedu et al., 2014). In the process of selecting a particular variety of fruit or vegetable, consideration is given to characteristics such as taste and appearance, which may be considered as decisive characteristics in the choice of product. Studies on consumers’ sensory perception of fresh fruits or vegetables have shown that sensory and nutritional quality parameters are critical to the perception of consumer satisfaction in selecting new varieties (Leighton et al., 2010, Luz et al., 2018).
The Tetsukabuto hybrid is produced in larger numbers than other pumpkin hybrids and varieties. Its main characteristics are yellow-orange pulp, globular shape, and hard and dark green rind. Its fruits have significant amount of mineral salts, such as calcium, potassium, magnesium, iron, and vitamins, mainly β-carotene (provitamin A), B, C, and E. Tetsukabuto pumpkins have characteristics that correspond to commercial purposes, such as increased productivity, climate suitability, and high resistance to pest attacks (Zhou et al., 2014).
Pumpkin, a widely consumed vegetable in Brazil, has been grown in different regions in the country. Consumers have been increasingly demanding regarding the identity and quality standards of products in the market. Thus, quality criteria and references must be established so that the raw material, ingredients, and final products can be classified and evaluated by consumers’ perceptions. The present work aimed to evaluate the quality aspects and sensory profile of eight pumpkin varieties and to estimate the correlation between them.
MATERIALS AND METHODS
Plant material
Pumpkins were grown in Iporá, a city in Goiás (GO) state, Brazil (16°22’26”S; 51°09’21”W), and transported to the Instituto Federal Goiano – Campus Rio Verde. Tetsukabuto F1 (TET) seeds were purchased in the local commerce (commercial hybrids) and seeds of experimental hybrids resulted from the hybridization process carried out with scented pumpkin and moranga pumpkin lines from the active germplasm bank (AGB) that belongs to the institution. Cultivation was performed as described by Alves et al. (2017) and the experiment was conducted in a direct transplant system.
Samples were coded as follows: PS is the scented pumpkin (PS01, PS02, PS03), MP is the moranga pumpkin (MP01),
HP is the hybrid pumpkin (HP02, HP03, HP12), and CP is the commercial hybrid Tetsukabuto pumpkin.
Pumpkins were selected, washed, sanitized with sodium hypochlorite solution (200 mg kg-1) for 15 minutes, peeled, and manually cut. Cooking time was evaluated by the method described by Whetley (1987) with adaptations. Samples of pumpkin pieces (1 cm³) were weighed and placed in boiling water. They were periodically poked with a fork to check the stage of cooking and determine cooking time. Pumpkins were considered cooked when they offered little resistance to the fork penetration, perpendicular to the length. The process was always carried out by the same researcher.
Physicochemical analysis
Titratable acidity (TA), pH, and soluble solids (SS) were determined in agreement with recommendations issued by the Association of Official Analytical Chemists (AOAC, 1997). In order to calculate the SS/TA ratio, SS content was divided by TA of samples.
The method proposed by Talcott and Howard (1999) was applied to determine carotenoid content. The extract volume was completed to 100 mL with the solvent acetone: ethanol and read by a spectrophotometer at 470 nm. Total carotenoid content was calculated using Equation 1 (Gross, 1991).
Total Carotenoids (µg g-1)=(A
470x V x 106)/(A1% x 100 x g) (1)
where A470 is the absorbance measured at 470 nm, V is the total extract volume (100 mL), A1% is the extinction coefficient for the solvent mixture (2500), and g is the weight of the sample in grams.
The instrumental color was determined in the pulp (mesocarp) and epicarp of pumpkin genotypes in agreement with the CIELab system (n=10). Color parameters L*, a*, and b* were evaluated by a Color Flex EZ spectrophotometer (Hunter Lab, Reston, VA, USA) (Pardo et al. 2000) while parameters C* (chroma, color saturation) and h (hue, chromatic hue angle) were calculated.
Sensory analysis
The sensory analysis was previously approved by the Research Ethics Committee of the Goiano Federal Institute (CAAE 1.853.603).
Consumer’s profile and affective analysis
In order to characterize pumpkin consumers, a 10-question survey was performed with 231 individuals about their preferences related to visual and affective characteristics that influence their intention to buy the fresh product. The survey was answered online in a Survio website for 15 days in October 2017. Answers were expressed as percentages.
Affective tests of preference ordering (1 – less preferred and 8 – most preferred) were applied to evaluate pumpkin color, taste, and texture. Pre-cooked pumpkins were served on Styrofoam trays coded with random three-digit numbers, salt biscuit, and water as palate cleanser between sample evaluations (Fig. 1). Tests were conducted with 70 judges (18.75% men and 81.25% women, students and employees) aged between 17 and 50 years old. Judges were asked to order samples from the least preferred one, which was assigned score 1, to the most preferred one, which got score 8 (Meilgaard and Civille, 1991).
Affective tests of purchase intention (1 and 2: negative attitude; 3: indifference and 4 and 5: positive attitude) were applied. Judges were asked to evaluate all varieties which had been cut in half, lengthwise, on a stainless steel table and coded with random three-digit numbers. Percentage of frequency was calculated by multiplying the number of judges found in each attitude (positive, negative, or indifferent) by the total number of judges and divided by 100.
Sensory profile
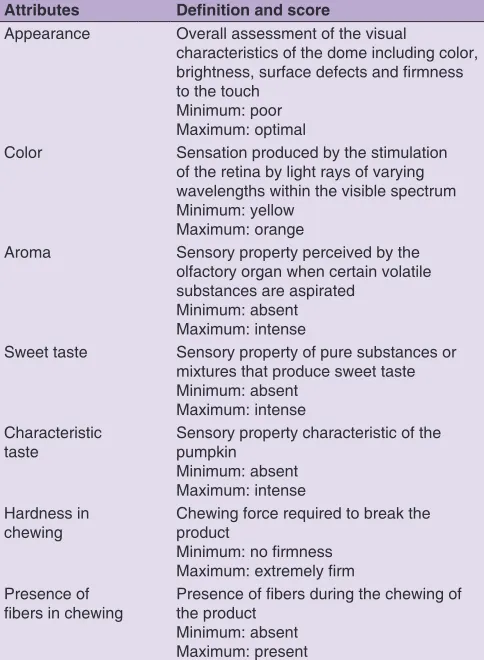
Sensory profiles of the eight pumpkin varieties were carried out with 9 expert judges aged from 17 to 35 years old. Development of terminology and definition was performed as shown by Table 1. A 9-point non-structured hedonic scale anchored at 0.5 cm was employed. The sensory panel assigned scores and averages were used for elaborating the attribute profile graph.
Statistical analysis
Statistical evaluation of preference ordering was performed by the Friedman test while the Christensen table was used for comparing samples at 5% significance level. In the case of both the attribute profile test and the physicochemical analysis, the analysis of variance and the comparison of means by the Tukey’s test at
5% significance level were performed by the Statistica software.
The Principal Component Analysis (PCA) was performed by Stat Action 3.4.124.1308 (2016). In order to evaluate results from a multidimensional point of view, results of quality parameters were analysed by the Principal Component Analysis (PCA), a well-known method of extraction of relevant information from multivariate data sets by means of a small number of orthogonal variables called principal components (PCs).
Table 1: Attributes, definitions and minimum and maximum
score used in sensory analysis
Attributes Definition and score
Appearance Overall assessment of the visual
characteristics of the dome including color,
brightness, surface defects and firmness
to the touch Minimum: poor Maximum: optimal
Color Sensation produced by the stimulation of the retina by light rays of varying wavelengths within the visible spectrum Minimum: yellow
Maximum: orange
Aroma Sensory property perceived by the
olfactory organ when certain volatile substances are aspirated
Minimum: absent Maximum: intense
Sweet taste Sensory property of pure substances or mixtures that produce sweet taste Minimum: absent
Maximum: intense Characteristic
taste Sensory property characteristic of the pumpkin Minimum: absent
Maximum: intense Hardness in
chewing Chewing force required to break the product
Minimum: no firmness Maximum: extremely firm
Presence of
fibers in chewing Presence of fibers during the chewing of the product
Minimum: absent Maximum: present
Attributes and definitions used in the sensory analysis with 9 judges to describe the pumpkin varieties
RESULTS AND DISCUSSION
The chemical composition (TA, pH, SS, and carotenoid content) of cooked pumpkin varieties is shown in Fig. 2A and 2B. CP and PS02 varieties were similar regarding their TA content (0.20 %) and exhibited high SS (9.33 and 9.07 ºBrix, respectively). García-Parra et al. (2018) reported a SS value of 11.7 ºBrix for pumpkin puree (Cucurbita moschata cv. Butternut), which was higher than other varieties studied. Amaro et al. (2017) reported higher soluble solid contents than those reported in this paper (18.44 ° Brix) in their work with Tetsukaboto variety. The higher the soluble solid content in pumpkins, the higher the industrial yield and, therefore, the genetic improvement should select genotypes that satisfy this trait (Lima et al., 2019). The highest value
of SS/TA ratio (65.1-65.5) was found for PS01 and MP02 varieties, which was significantly different from other varieties. Kovaçevic et al.(2008) reported that high SS/TA ratio of strawberries is often positively correlated to sweet taste sensory attributes.
Values of pH of all varieties (6.18-6.88) were similar to the value found in pumpkin puree (6.30) (García-Parra et al., 2018) and experimental hybrid of pumpkin (HC05) (6.14) (Lima et al., 2019). The pH value of PS01 differed from all other varieties. Nawirska-Olszanska et al. (2014) showed that the pH of C. moschata was lower than the one of C. maxima. In this study, opposite behavior was observed. These authors reported that the type and amount of organic acids in pumpkins may vary, since it depends
Fig 2. Chemical characteristics of pumpkin varieties. A) TTA, pH, TSS and TSS/TTA ratio; and B) Total carotenoids. Values identified by equal
lowercase letters in the same column do not differ by the Tukey’s test (p≤0.05). Analysis of pumpkin varieties, (n = 9).
on the species and storage time. Therefore, it is difficult to establish a relation between this value and the pumpkin species.
Concerning carotenoid contents (Fig. 2B), the highest average was the one of PS02 (172.88 mg 100g-1), differing from all other varieties, while PS03 and CP (108.44 and 89.68 mg 100g-1, respectively) did not exhibit any significant difference. In this study, hybridization (HP02, HP03 and HP12) resulted in pumpkin with low total carotenoid content (50.94-51.90 mg 100g-1). All varieties under evaluation had high total carotenoid content; this agrees with results of pumpkin (236.10 µg g-1) reported by Carvalho et al. (2014).
Carotenoids are substances that exhibit a broad spectrum of health promotion when supplied in the diet because they have antioxidant properties based on quenching of singlet oxygen and free radical scavenging. Thus, carotenoids may minimize the development of cardiovascular diseases (Kulczyński et al., 2017). The World Health Organization (WHO) recommends that 3 servings of vegetables should be eaten per day and pumpkin may contribute to this intake. Pumpkin is one of the major contributors of b-carotene as a food source to the Brazilian population (0.14 mg/person/ day). It is considered high by comparison to contribution given by fruits, such as mango. Therefore, pumpkin is the largest contributor of α-carotene (0.06 mg/person/day), which is offered by a limited number of foods (Vargas-Murga et al., 2016). Provesi et al. (2011) evaluated the most common carotenoids found in raw pumpkin and reported All-trans-β-carotene and α-Carotene in the case of C. moschata and all-trans-β-carotene and Lutein in the case of C. maxima. They added that these carotenoids are maintained after cooking, thus demonstrating nutritional importance of frequent consumption of this vegetable by the Brazilian population.
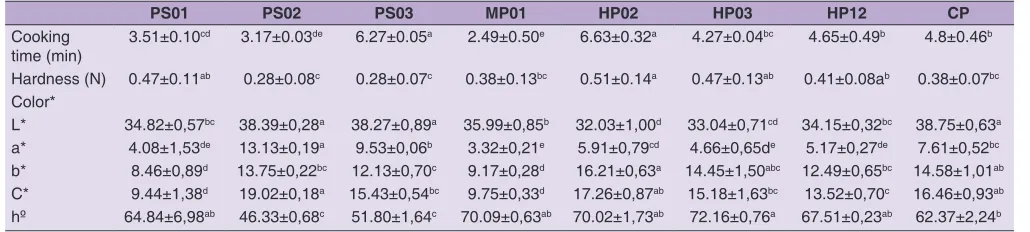
Table 2 shows physical characteristics of pumpkin varieties. Average cooking time of each sample under evaluation differed in every pumpkin variety (from 2.49 to 6.63 minutes). There was no significant difference between
HP02 (0.51 N), HP03 and PS01 (0.47 N), and HP12 (0.41 N) varieties, which showed higher hardness than other varieties. However, lower hardness was found in MP01 and CP (0.38 N), as well as PS02 and PS03 (0.28 N) varieties.
High hardness in vegetables implies slow eating rate, which is generally beneficial from a public health perspective, but it may make it difficult for consumers to meet the recommended vegetable intake (Poelman, Delahuntya and de Graaf, 2017). Hardness of vegetables can be modified by the method chosen for the cooking process. In this study, hardness of pumpkin was lower than that of other produce, such as broccoli and carrot, when cooked in water for about 20 minutes(Guillén et al. 2017).
The L* (lightness, 100 and 0 for black), a* (negative for green and positive for red), and b* (negative for blue and positive for yellow) were measured for pumpkin varieties. Regarding L* value, PS02 (38.39), PS03 (38.27), and CP (38.75) varieties were significantly similar with higher values than other varieties. This shows that the pulp obtained higher luminosity. All varieties showed positive (red color) and low (close to 0) a* value. PS02 variety showed higher a* value than all samples under evaluation (13.13). As a result, it was the sample with more intense pulp color. All pumpkin varieties showed predominance of yellow (positive b* value). Neither HP02 (16.21) nor HP03 (14.45) exhibited significant difference from CP (14.58) variety. PS02 variety had the highest C* value (19.02), which represents color intensity, without any significant difference from HP02 (17.26) and CP (13.52) varieties. The hº angle defines the hue of the color and, in the cases of the pumpkin varieties under evaluation, it was between 51.80 and 72.16, in the range from light orange to yellow. Results of this study corroborated the ones described by García-Parra et al.(2016) in the case of pumpkin puree, which was red and yellow.
Characterization of the pumpkin consumer’s profile was carried out by a questionnaire, whose questions were divided into two stages. The first one was related to the consumer’s basic characteristics, such as sex, age, and residence place
Table 2: Physical characteristics of cooked pumpkins varieties
PS01 PS02 PS03 MP01 HP02 HP03 HP12 CP
Cooking
time (min) 3.51±0.10
cd 3.17±0.03de 6.27±0.05a 2.49±0.50e 6.63±0.32a 4.27±0.04bc 4.65±0.49b 4.8±0.46b
Hardness (N) 0.47±0.11ab 0.28±0.08c 0.28±0.07c 0.38±0.13bc 0.51±0.14a 0.47±0.13ab 0.41±0.08ab 0.38±0.07bc Color*
L* 34.82±0,57bc 38.39±0,28a 38.27±0,89a 35.99±0,85b 32.03±1,00d 33.04±0,71cd 34.15±0,32bc 38.75±0,63a a* 4.08±1,53de 13.13±0,19a 9.53±0,06b 3.32±0,21e 5.91±0,79cd 4.66±0,65de 5.17±0,27de 7.61±0,52bc b* 8.46±0,89d 13.75±0,22bc 12.13±0,70c 9.17±0,28d 16.21±0,63a 14.45±1,50abc 12.49±0,65bc 14.58±1,01ab C* 9.44±1,38d 19.02±0,18a 15.43±0,54bc 9.75±0,33d 17.26±0,87ab 15.18±1,63bc 13.52±0,70c 16.46±0,93ab hº 64.84±6,98ab 46.33±0,68c 51.80±1,64c 70.09±0,63ab 70.02±1,73ab 72.16±0,76a 67.51±0,23ab 62.37±2,24b
while the second stage was related to consumption habits. In the questionnaire, 71.4% of answers were given by women and 28.6% by men. In a study performed by Jaime et al. (2015), women’s daily recommended consumption of fruits and vegetables in Brazil was higher than the one of men. This shows the importance of women’s opinions regarding the characteristics of these products, since they are the most frequent consumers.
Moreover, most answers were given by adults between 26 and 35 years old (37.7%), followed by those from 19 to 25 (32.9%), 36 to 45 (13.9%), over 45 (10%) and, finally, people under 18 (5.6%). Age is a relevant factor because dietary habits change from generation to generation (Jaime et al., 2015).
The questionnaire was mostly answered by people that live in central-western Brazil (81%); GO was the state
with the highest representation (71.9%). Frequency of pumpkin consumption can be considered relatively high (92.6% of participants). Most of the participants (36.8%) reported that they consumed it only once a month, 26.8% consume twice a month, and 23.8% consume once a week. Salty dishes with pumpkin were preferred by 83.5% of participants over sweet disches. Cooked and braised pumpkin were the favorite preparations (61.9% and 26.4%, respectively). Participants’ cultural habits and economic conditions influence their product consumption in their daily lives (Satterthwaite, McGranahan and Tacoli, 2010).
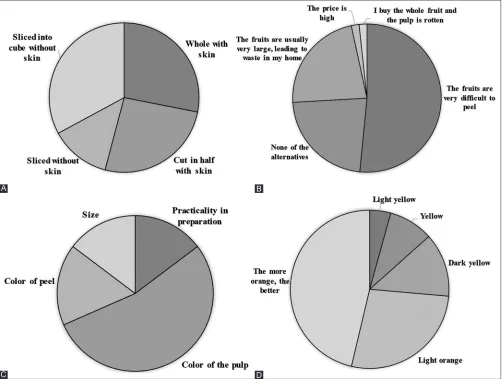
Individuals preferred to buy whole fruits (45.5%), followed by fruits cut in half (44.2%). In addition, 32.9% of respondents said they would choose pumpkin cut into cubes without skin, which would be more convenient and easier to prepare at home, while 28.1% of respondents keep buying whole pumpkins with skin (Fig. 3A). In the
Fig 3. Answer the questions: (A) If there were a choice at the point of sale, which option would you choose?; (B) What do you consider to be inconvenient for pumpkin consumption?; (C) Which are essential characteristics to choose a pumpkin at the time of purchase?; and (D) Which
pulp color do you find most attractive in pumpkin? Search for the pumpkin consumer profile with 231 individuals. Each figure represents a question
from the questionnaire. The results were calculated as a percentage of individuals that selected each response option. D
C
interviewees’ opinions, the biggest drawback in the case of pumpkin consumption is that the fruit is very difficult to peel (51.5%, Fig. 3B).
Pumpkin consumers seem to appreciate when the vegetable is minimally processed (peeled, cut, and refrigerated), although they may not know the name of the applied technology. However, some of the advantages of processing are ease of preparation of food with nutritional values and sensory attributes, such as flavor, aroma, texture, and taste (Jideani et al., 2017).
The participants most preferred small pumpkins (mass between 1.0 and 1.5 kg) (96.1%), possibly because they may recognize the importance of a sustainable future in food economy. Vegetable wastes are mainly generated by agricultural production, post-harvest, distribution stages, and, in households, consumption that leads to absence of proper preservation strategies for perishable crops(Plazzotta, Manzocco, and Nicoli, 2017).
The color of pumpkin pulp seemed to be the most relevant characteristic at the time of purchase with 53.7% of answers (Fig. 3C). Individuals indicated that the most attractive color is intense orange (46.3%, Fig. 3D).
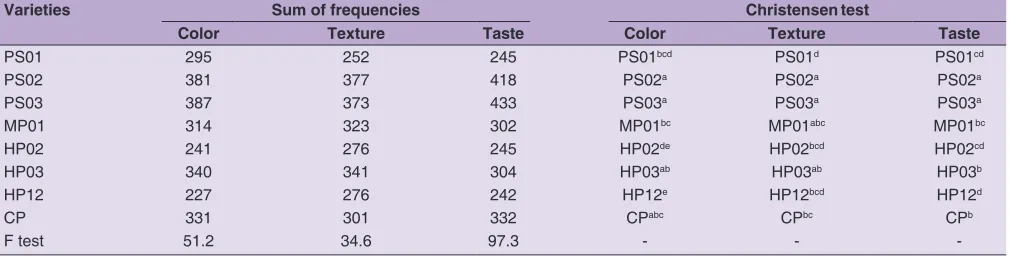
Results of affective tests of preference are shown in Table 3. The sum of frequencies assigned by judges to pumpkin varieties was used in the Friedman test. Values which were found by the F test for each pumpkin variety were higher than the F table value (12.59), showing that there are differences among samples regarding color, texture, and flavor attributes. Differences in the sum of frequencies by the Christensen test at 5% significance are shown in Table 3.
The sum of frequencies attributed by the judges showed that there was high preference for PS03, PS02, HP03, and CP varieties concerning the color attribute; PS02, PS03, HP03, and MP01 varieties in terms of the texture attribute; and PS02 and PS03 varieties regarding the taste
Table 3: Sum of frequencies of the ordering by preference and Christensen test for attributes color, texture and taste
Varieties Sum of frequencies Christensentest
Color Texture Taste Color Texture Taste
PS01 295 252 245 PS01bcd PS01d PS01cd
PS02 381 377 418 PS02a PS02a PS02a
PS03 387 373 433 PS03a PS03a PS03a
MP01 314 323 302 MP01bc MP01abc MP01bc
HP02 241 276 245 HP02de HP02bcd HP02cd
HP03 340 341 304 HP03ab HP03ab HP03b
HP12 227 276 242 HP12e HP12bcd HP12d
CP 331 301 332 CPabc CPbc CPb
F test 51.2 34.6 97.3 - -
-The affective tests of ordering by preference (1–less preferred and 8–most preferred) were applied to evaluated color, taste and texture of the pumpkin. -The values in this table represent the sum of the 70 judges used in the test
attribute. However, the sum of frequencies attributed by the judges showed low preference for HP12 and HP02 varieties regarding the color attribute; PS01, HP02, and HP12 varieties in terms of the texture attribute; and HP12, HP02, and PS01 varieties concerning the taste attribute.
Comparison between experimental varieties and the commercial variety (CP) showed difference between HP02 and HP12 varieties in terms of the color attribute. In the case of the texture attribute, the commercial variety (CP) showed significant difference from PS01, PS02, and PS03 varieties. The CP variety had significant difference, by comparison with PS02, PS03, HP02, and HP12 varieties, in the taste attribute. Importantly, the HP03 hybrid variety was preferred in terms of color, texture, and taste attributes, without any significant difference from the commercial variety (CP).
The attribute profile of cooked pumpkin is shown in Table 4. Concerning appearance, only HP02 and MP01 varieties differed from the CP variety. However, taste, aroma, and hardness exhibited no significant difference. PS02 (6.27), PS03 (5.76), and CP (5.36) varieties did not show any difference in terms of sweet taste. In comparison between the sensory profile and TSS, varieties under evaluation showed higher SS contents (9.07, 7.47, and 9.33 ºBrix). This was expected as SS found in the vegetable pulp include important compounds, such as sugars and organic acids, which are responsible for the sweet taste and consequent acceptance by consumers.
In the color scale, 9-point was attributed to orange color while 1 was attributed to yellow color. The average was higher in the case of PS02 and PS03 varieties (7.91 and 6.99, respectively) and lower in the case of HP02, MP01, and HP12 varieties (1.78, 1.93, and 2.27, respectively). The association between the descriptive test and the affective test of preference showed that these samples were the most and least preferred ones, respectively. Thus, pumpkins (PS02 and PS03 varieties) with more orange pulp were more preferred by the sensory panel. Koch and Koch (2003) consider that preconceptions regarding taste impressions, based on the color of food, can be easily formed. Their sensory tests corroborated results obtained in the present study for pumpkin consumers’ characterization (Fig. 3D) of the question “Which pulp color do you find most attractive to pumpkin?”. The highest percentage was found in the answer “The more orange, the better”.
Correspondingly, color results can be related to the physicochemical composition, since the three samples considered orange (PS02, PS03, and CP) reached the
highest levels of carotenoid contents (172.88, 108.44, and 89.68 mg 100g-1, respectively). Carotenoids are often associated with color, but they can also have relevant effects on both aroma and flavor (Christensen et al., 2007; Pérez and Sanz, 2008). Lewinsohn et al.(2005) found that pigmentation in tomato and watermelon was responsible for volatile compounds, besides influencing aroma and global flavor of the fruit under analysis. Even though values of aroma and taste found by this study did not differ significantly, Table 3 shows that the averages of aroma and taste were higher in samples with higher carotenoid contents (PS02 and PS03).
Texture of pumpkin varieties was sensorially evaluated as hardness attributes and the presence of fibers. Hardness is considered the force required to deform a product over a given distance. Although samples did not differ significantly at the 5% Tukey test, the highest hardness indicated by the judges was found in sample HP02 (4.8), which was 2-fold the hardness of the commercial pumpkins (2.42). The value of instrumental texture of the HP02 variety (0.51)
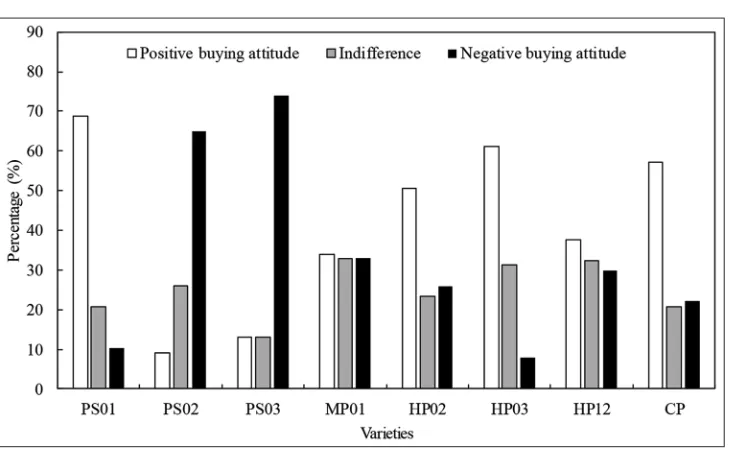
Fig 4. Attitude of purchase the whole fruits and cut in half of the pumpkin varieties.For this analysis the pumpkins were presented whole and cut in half. The percentage of frequency was calculated by multiplying the number of judges obtained for each attitude (positive, negative or indifferent) by the number of total judges and divided by 100.
Table 4: Means of sensory evaluated attributes in eight pumpkin genotypes
Appearance Color Taste Aroma Sweet taste Hardness Fibers presence
PS01 5.49ab 4.32cde 3.36a 5.09a 1.58d 3.18a 6.84a
PS02 7.14a 7.91a 6.10a 6.44a 6.27a 3.06a 2.57bc
PS03 7.31a 6.99ab 5.16a 4.33a 5.76ab 2.53a 1.45c
MP01 4.44b 1.93ef 3.59a 3.88a 2.38d 2.79a 4.97ab
HP02 4.46b 1.78f 3.32a 3.91a 2.39d 4.80a 6.62a
HP03 5.73ab 4.49bcd 3.44a 4.14a 3.0bcd 3.42a 4.08b
HP12 4.99ab 2.27def 3.41a 3.83a 2.53cd 3.65a 4.18b
CP 5.36ab 4.83bc 5.24a 4.05a 5.36abc 2.42a 4.16b
was higher than that of the CP variety (0.38) (Table 1). The highest averages of fiber were attributed to PS01, HP02, and MP01 (6.84, 6.62, and 4.97). In sensory terms, texture properties are very important to solid vegetable foods. The term ‘presence of fibers’ is frequently used, since it refers to the geometric properties of the food particles and is applied to fibrous materials (mainly materials containing hemicellulose and cellulose). This properties can be perceived during the sensory analysis by chewing (ABNT, 1993). These characteristics are undesirable, since the consumer usually associates the presence of large amounts of fiber with the lack of succulence in food (Botelho, 2005).
Evaluation of the attitude of purchase was carried out with whole fruits and fruits cut in half. The test of attitude of
purchase showed positive attitude of purchase in the case of PS01, HP02, HP03, and CP varieties (>50%) while PS02 and PS03 varieties (<50%) showed negative attitude (Figure 3). This evaluation demonstrated rejection at the time of purchase of fruits that externally resemble fruits of the species C. maxima. Furthermore, although PS02 and PS03 varieties were the most preferred when cooked (Table 3), there was rejection of their external appearance. However, MP01 and HP12 varieties showed approximately the same percentage of frequency of negative, indifference, and positive attitudes shown by judges (~30%).
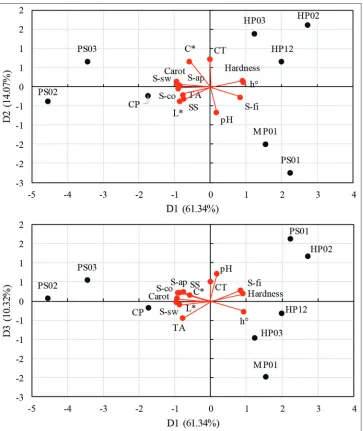
Data on physicochemical characteristics and sensory profile were analyzed by Principal Component Analysis (PCA). Factors were orthogonally rotated, following the
Fig 5. Sensory map of principal components after VARIMAX transformation (D): Attributes (vectors) and Pumpkin Varieties (circles) of gluten-free
breads. A: D1 versus D2; B: D1 versus D3. Carot – carotenoids; S-ap, S-co, S-sw and S-fi are apparence, color, sweet taste fiber presence of
sensory profile; SS – soluble solids; TA – titratable acidity; CT – cooking time; L*, C* and h° - color paramets. PS01, PS02, PS02, MP01, HP02,
VARIMAX transformation with the Kaiser normalization method. In this analysis, attributes that exhibited significant difference among the pumpkin varieties were used. The first three components of the PCA had eigenvalues above 1, indicating that they should be used for interpreting results (Kaiser criterion) (Bayarri et al., 2011). The first principal component (D1) explained 61.34% of the total variability found in the original variables, the second principal component (D2) explained 14.07%, and the third principal component (D3) explained 10.32%, totaling 85.73% of explanation (Fig. 5).
In each axis, attributes that had correlation with the axis above 0.7 were considered important. In D1, hardness, angle h°, and fibers (sensory profile) showed positive correlation, while titratable acidity, soluble solids, carotenoids, luminosity, appearance, color, and sweet taste (sensory profile) showed negative correlation. In D2, cooking time was positively correlated. In D3, pH had positive correlation and the whole grain bread aroma had negative correlation. Chroma had no correlation with any component (r<0.7).
The first principal component (D1) separated varieties: on the right, there were PS01, PS03, HP02, HP03, HP12, and MP01 varieties, whereas, on the left, there were CP, PS02, and PS03 varieties. Formulations on the right had high intensity of h° angle, hardness, and fibers in the sensory profile; and higher carotenoid content, chroma, totable acidity and color, appearance, and sweet taste (sensory profile). For the second principal component (D2), varieties with longer cooking time were above the axis (HP02, HP03, HP12, and PS03).
CONCLUSION
Physicochemical characteristics were related to sensory characteristics of cooked pumpkin varieties under study. When consuming cooked pumpkin, consumers had negative attitude regarding the external appearance and preference (mainly PS02 and PS03). The hybridization process should be studied to obtain properties, such as orange pulp, small fruit, higher soluble solid contents, and carotenoids. In this study, the HP03 hybrid variety stood out, since it has many important characteristics.
ACKNOWLEDGMENTS
The authors thank CNPq for its financial support (MCTI/ MAPA/CNPq No. 40/2014). This study was partially funded by the Coordenação de Aperfeiçoamento de Pessoal de Nível Superior – Brasil (Capes) – Finance Code 001.
Authors’ contributions
A.B. Almeida, T.M. Lima and J.G. Oliveira Filho worked on the execution of experimental work, interpretation of results, and also contributed to manuscript writing. D.S. Lima contributed to manuscript writing. R.V. Santana worked in the experiments. E.A. Moreira designed the research and contributed to manuscript writing. M.B. Egea (corresponding author) designed the research plan, organized the study, coordinated the data analysis and contributed to manuscript writing.
REFERENCES
ABNT. Associação Brasileira de Normas Técnicas. 1993. Análise Sensorial Dos Alimentos e Bebidas NBR 12806. Terminologia, Rio de Janeiro, p. 8.
Alves, E. M., L. J. dos Santos, G. S. Batista, S. R. de Souza, F. L. Claudio, G. C. Junior and T. do Prado Paim. 2017. Characteristics and productivity of experimental hybrid of JAPANESE pumpkin in Iporá Brazil. PUBVET. 11: 646-743. Amaro, G. B., G. O. da Silva, L. S. Boiteux, A. D. F. de Carvalho
and J. F. Lopes. 2017. Agronomic performance of pumpkin type Tetsukabuto hybrids for fruits traits. Hortic. Bras. 35: 180-185. AOAC (Association of Official Analytical Chemists). 1997. In:
P. A. Cunniff, (Ed.), Official Methods of Analysis of AOAC International. 16th ed., Vol. 1. AOAC International. Association
of Official Agricultural Chemists, Arlington, Virginia, USA, p. 1. Bayarri, S., I. Carbonell, E. X. Barrios and E. Costell. 2011. Impact of
sensory differences on consumer acceptability of yoghurt and yoghurt-like products. Int. Dairy J. 21: 111-118.
Carvalho, L. M. J., L. D. A. Smiderle, J. L. V. Carvalho, F. D. S. Cardoso and M. G. B. Koblitz. 2014. Assessment of carotenoids in pumpkins after different home cooking conditions. F. Sci Tech. 34: 365-370.
Christensen, L. P., M. Edelenbos and S. Kreutzmann. 2007. Fruits and vegetables of moderate climate. In: Flavours and Fragrances. Springer, Berlin, Heidelberg, pp. 135-187.
Dhiman, A. K., K. D. Sharma and S. Attri. 2009. Functional constitutents and processing of pumpkin: A review. J. Food Sci. Technol. 46: 411.
Egbekun, M. K., E. O. Nda-Suleiman and O. Akinyeye. 1998. Utilization of fluted pumpkin fruit (Telfairia occidentalis) in marmalade manufacturing. Plant Foods Hum. Nutr. 52: 171-176. García-Parra, J., F. González-Cebrino, J. Delgado, R. Cava and
R. Ramírez. 2016. High pressure assisted thermal processing of pumpkin purée: Effect on microbial counts, color, bioactive compounds and polyphenoloxidase enzyme. Food and Bioprod. Process. 98: 124-132.
García-Parra, J., F. González-Cebrino, J. Delgado-Adámez, R. Cava, O. Martín-Belloso, P. Elez-Martínez and R. Ramírez. 2018. Application of innovative technologies, moderate-intensity pulsed electric fields and high-pressure thermal treatment, to preserve and/or improve the bioactive compounds content of pumpkin. Innov. Food Sci. Emerg. Technol. 45: 53-61.
Guillén, S., J. Mir-Bel, R. Oria and M. L. Salvador. 2017. Influence of cooking conditions on organoleptic and health-related properties of artichokes, green beans, broccoli and carrots. Food Chem. 217: 209-216.
identification. Acta Bot. Bras. 29: 129-142.
Jaime, P. C., S. R. Stopa, T. P. Oliveira, M. L. Vieira, C. L. Szwarcwald and D. C. Malta. 2015. Prevalence and sociodemographic distribution of healthy eating markers, National Health Survey, Brazil 2013. Epidemiol. Servi. Saúde. 24: 267-276.
Jamali, S. N., M. Kashaninejad, A. A. Amirabadi, M. Aalami and M. Khomeiri. 2018. Kinetics of peroxidase inactivation, color and temperature changes during pumpkin (Cucurbita moschata) blanching using infrared heating. LWT. 93: 456-462.
Jideani, A. I., T. A. Anyasi, G. R. Mchau, E. O. Udoro and O. O. Onipe. 2017. Processing and Preservation of Fresh-Cut Fruit and Vegetable Products. Postharvest Handling. InTech, p 47. Koch, C. and E. C. Koch. 2003. Preconceptions of taste based on
color. J Psychol. 137: 233-242.
Kulczyński, B., A. Gramza-Michałowska, J. Kobus-Cisowska and D. Kmiecik. 2017. The role of carotenoids in the prevention and treatment of cardiovascular disease current state of knowledge. J. Funct. Foods. 38: 45-65.
Leighton, C. S., H. C. Schönfeldt and R. Kruger. 2010. Quantitative descriptive sensory analysis of five different cultivars of sweet potato to determine sensory and textural profiles. J. Sens Stud. 25: 2-18.
Lewinsohn, E., Y. Sitrit, E. Bar, Y. Azulay, M. Ibdah, A. Meir and Y. Tadmor. 2005. Not just colors carotenoid degradation as a link between pigmentation and aroma in tomato and watermelon fruit. Trends Food Sci Technol. 16: 407-415.
Lima, T. M., A. B. Almeida, R. V. Santana, E. M. Alves and M. B. Egea. 2019. Physical-chemical and technological quality of an experimental hybrid of cabotia pumpkin. Vértices. 21:220-232. Luz, L. N., J. C. Vettorazzi, R. Santa-Catarina, F. R. Barros, G. Barros,
M. G. Pereira, and D. L. Cardoso. 2018. Sensory acceptance and qualitative analysis of fruits in papaya hybrids. An. Acad. Bras. Ciênc. 90: 3693-3703.
Meilgaard, M., G. V. Civille and B. T. Carr. 1991. Sensory Evaluation Techniques. 2nd ed. CRC Press, Boca Raton.
Nawirska-Olszańska, A., A. Biesiada, A. Sokół-Łętowska and A. Z. Kucharska. 2014. Characteristics of organic acids in the fruit of different pumpkin species. Food Chem. 148: 415-419. Pérez, A. G. and C. Sanz. 2008. Formation of fruit flavour. In Fruit and
Vegetable Flavour. Woodhead Publishing, pp. 41-70.
Plazzotta, S., L. Manzocco and M. C. Nicoli. 2017. Fruit and vegetable waste management and the challenge of fresh-cut salad. Trends Food Sci. Technol. 63: 51-59.
Poelman, A. A., C. M. Delahunty and C. de Graaf. 2017. Vegetables and other core food groups: A comparison of key flavour and texture properties. Food Qual. Prefer. 56: 1-7.
Provesi, J. G., C. O. Dias and E. R. Amante. 2011. Changes in carotenoids during processing and storage of pumpkin puree. Food Chem. 128: 195-202.
Rubatzky, V. E and M. Yamaguchi. 2012. World Vegetables: Principles, Production, and Nutritive Values. Springer Science and Business Media, New York.
Satterthwaite, D., G. McGranahan and C. Tacoli. 2010. Urbanization and its implications for food and farming. Philos. T. R. Soc. B. 365: 2809-2820.
Sharma, S. and T. R. Rao. 2013. Nutritional quality characteristics of pumpkin fruit as revealed by its biochemical analysis. Int. Food Res. J. 20: 2309.
Steiner-Asiedu, M., P. Nuro-Ameyaw, I. Agbemafle, S. H. Hammond and K. Tano-Debrah. 2014. Nutrient composition and protein quality of four species of the Cucurbitaceae family. Adv. J. Food Sci. Technol. 6(7): 843-851.
Talcott, S. T. and L. R. Howard. 1999. Phenolic autoxidation is responsible for color degradation in processed carrot puree. J. Agric. Food Chem. 47: 2109-2115.
Vargas-Murga, L., V. V. de Rosso, A. Z. Mercadante and B. Olmedilla-Alonso. 2016. Fruits and vegetables in the Brazilian household budget survey (2008-2009). carotenoid content and assessment of individual carotenoid intake. J. Food Compos. Anal. 50: 88-96. Yadav, M., S. Jain, R. Tomar, G. B. K. Prasad and H. Yadav. 2010.
Medicinal and biological potential of pumpkin: An updated review. Nutr. Res. Rev. 23: 184-190.
Zeinstra, G. G., M. A. Koelen, F. J. Kok and C. De Graaf. 2007. Cognitive development and children’s perceptions of fruit and vegetables; a qualitative study. Int. J. Behav. Nutr. Phys. Act. 4: 30.