Original Research Article
Raised body mass index and cardiovascular indices in secondary school
students, South-South Nigeria
Bertilla U. Ezeonwu
1*, Clifford O. Okike
1, Hyginus I. Opara
1, Leonard E. Abonyi
1,
Obinna C. Ajaegbu
1, Efe E. Omoyibo
1, Ijeoma J. Nnodim
2, Ezinne Onyeka-Okite
1,
Emeka Okoli
1, Angela A. Okolo
1INTRODUCTION
Raised body mass index which includes obesity and overweight, is abnormal or excessive accumulation of fat that may impair health.1 It is an energy imbalance between caloric intake and caloric expenditure.1 Obesity in children between 5 and 19 years of age is defined as body mass index (BMI) for age greater than 2 standard deviations (SD) above the WHO growth reference median while overweight is between >1 and 2 SD.1
Globally, about 600 million people are obese out of which 220 million are school age children.2 In Africa, about 10.6 million children have raised BMI as of 2014.1 The prevalence of obesity in Nigerian adolescents ranges between 1 and 10%.3-7 In children, raised BMI is complicated with the development of cardiovascular (CV) diseases.8-10 Although risk increases with increased BMI, both obesity and overweight predispose to the same complications, hence the emphasis on raised BMI.1 Arterial stiffness (AS) occurs in raised BMI and CV events are the consequences.11 The hallmark of AS is
ABSTRACT
Background: Raised body mass index (obesity and overweight), is abnormal or excessive accumulation of fat that may impair health.The prevalence of obesity in Nigerian adolescents ranges between 1 and 10%.In children, raised body mass index is complicated with the development of cardiovascular diseases,which are consequences of arterial stiffness. The hallmark of arterial stiffness is wide pulse pressure which precedes isolated elevation of systolic blood pressure. Other manifestations of arterial stiffness are elevated diastolic blood pressure and increased mean arterial pressure. This study educated the students on healthy lifestyle and checked their cardiovascular indices.
Methods: This was a descriptive cross-sectional study of students. Their weight, height and blood pressure were measured and cardiovascular indices were calculated.
Results: There were 248 students, age between 8 and 16 years, 135 (54.4%) were males with adolescents comprising 96.8%. The prevalence rate of wide pulse pressure, raised body mass index, elevated blood pressure and increased mean arterial pressure was 26.6%, 16.1%, 8.5% and 4.0% respectively. More females and early adolescents comparably had raised body mass index.
Conclusions: The mean values for cardiovascular indices were comparably higher in those with raised body mass index.
Keywords: Obesity, Blood, Pulse, Pressure, Arterial, Stiffness
Department of Paediatrics, 1Federal Medical Center, Asaba, Delta State, 2Imo State University, Orlu, Imo State, Nigeria
Received: 09 March 2018 Revised: 03 April 2018 Accepted: 04 April 2018
*Correspondence: Dr. Bertilla U. Ezeonwu, E-mail: [email protected]
Copyright: © the author(s), publisher and licensee Medip Academy. This is an open-access article distributed under the terms of the Creative Commons Attribution Non-Commercial License, which permits unrestricted non-commercial use, distribution, and reproduction in any medium, provided the original work is properly cited.
wide pulse pressure (PP) which precedes isolated systolic hypertension (HTN).12 Other manifestation of arterial stiffness are elevated diastolic blood pressure (DBP) and increased mean arterial pressure (MAP).8,9,13-16 Systolic BP has always been the determinant of CV risk but recently PP has been shown to be the major determinant, and a rise in the prevalence of widened PP in children, as well as HTN have been noted in this era of childhood obesity.4,6,14,16,17 Fortunately, raised BMI and likewise, it’s complications are largely preventable.1 Maintenance
of good weight through reduction in caloric intake and increasing physical activity is the first step in the management of obesity-associated AS and subsequent HTN, although medical and/or surgical intervention may be required in the long run.18 It is therefore pertinent to promote education concerning the harmful consequences of raised BMI and its association with CV disease and advocate healthy lifestyle and health policy measures that make preventive behaviours an affordable option. The association of raised BMI with PP in our country has not gained publicity. The Junior secondary school student cohort is supposed to be in their early adolescence when AS due to obesity is likely to start developing, as this has been noted to start from adolescents (10 years) to old age.9,13 Influencing their lifestyle at this age will be most beneficial. This study educated secondary school children on healthy lifestyle, screened the junior students for raised BMI, elevated SBP, DBP, MAP and PP. Further lifestyle modification counselling was given to those who already have raised BMI and CV indices.
METHODS
This was a descriptive cross-sectional study of the junior students in two randomly selected secondary schools in Asaba: one boys’ school and one girls’ school.
The total population of secondary school students in Asaba was 14,148 and using the formula where estimated population is more than 10,000 and a prevalence rate of obesity of 10%, a minimum sample size of 166 was calculated. Using the Neymann allocationfor stratified sampling and the total population of junior students in both school (259), the number of subjects to be selected from each school was 90 from boys’ school and 76 from girls’ school.7 However, a total population study of all the
junior students in the two schools whose parents consented, was done. The students were grouped into 3 age cohorts: 6-9 years (childhood), 10-13 years (early adolescence) and 14-16 years (middle adolescence).
Permission was sought from the Principals of the selected schools and written informed consent obtained from parents of the students. For the students living in the dormitory, they took the consent form to their parents during the midterm break. A minimum of two visits were made to each of the selected schools; the first was to get approval from the school authorities and drop the parental consent forms, introduce the researchers, the study objectives and design. On subsequent visit, all the
students had an interactive session with the researchers on healthy lifestyle, obesity and complications and the junior students whose parents gave their consent were screened for raised BMI and cardiovascular indices.
A proforma designed for the study was used to record the biodata, the clinical history, the vital signs and anthropometric measurements. The clinical history included information on their physical activity and history of hypertension in the first-degree relatives: father, mother and siblings. Optimal physical activity was defined as at least 60 minutes of moderate- to vigorous-intensity daily physical activity (dancing, brisk walking, swimming, jumping rope), which can also be multiple shorter bouts such as 2 bouts of 30 minutes.19 Vigorous intensity activity (running, footballing) for at least 3 times a week also defined adequate physical activity in this study.19 Social class was determined using the classification proposed by Olusanya et al and a score was awarded to each child based on the father’s occupation and the mother’s highest educational attainment.20
The, SECA 750 mechanical floor scale (SECA GmbH a co.kg, Hamburg, Germany) and SECA 213 stadiometer (SECA Gmbh & co.kg, Hamburg, Germany) were used for measuring the weight and the height respectively. The weight was measured to the nearest 0.1kg with subjects on light clothing and without footwear and the standing height was measured to the nearest 0.1cm, with the subject’s head, buttocks and heel touching the metallic measuring tape fixed horizontally on the instrument. The body mass index for age and sex was computed using weight (kg)/height2 (m2) and BMI z-score chart was used to assign BMI status to each student.1 Blood pressure of the participants was measured after they were seated for at least 5 minutes, using the ACCOSON mercury sphygmomanometer (Essex CM19 5QP, DEKAMET MK.3, England) with appropriate cuff size. Those with raised BMI were referred to the paediatric endocrinology clinic of FMC, while those with elevated blood pressure and/or proteinuria were referred to the paediatric nephrology clinic to confirm persistency of findings and follow them up.
Definitions of cardiovascular indices
Elevated SBP and DBP is respective values greater than or equal to 95th centile for gender, age, and height.21
Pulse pressure is the difference between SBP and DBP, determined by stiffness of large arteries and elevated if >40 mmHg.14
Data analysis
Data obtained was entered into excel spread sheet and later analyzed using the Statistical Package for Social Sciences (SPSS) version 22.0. Descriptive statistics which includes frequency, percentages, means and standard deviations were used to summarize the variables. Determination of association between categorical variables was by chi-squared test. Results were presented in prose and tables as appropriate. All tests were 2-tailed and significant at less than 0.05.
RESULTS
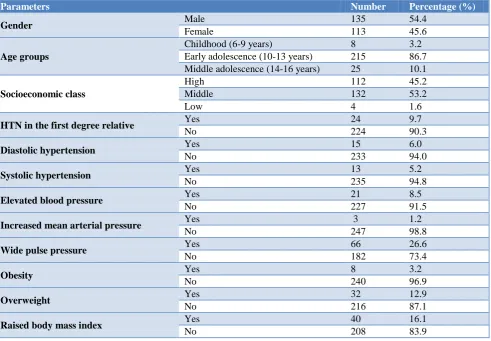
There were 259 junior students enrolled in both schools (119 girls and 140 boys), but only 248 were analyzed (5 did not give consent and 6 had missing data). The students’ age ranges between 8 and 16 years. There were 113 (45.6%) females and 135 (54.4%) males with F: M ratio of 1:1.2, majority (86.7%, 215/248) of who were in their early adolescence age and belong to middle SEC (Table 1). The prevalence rate of wide PP, raised BMI, HTN and increased MAP was 26.6%, 16.1%, 8.5% and
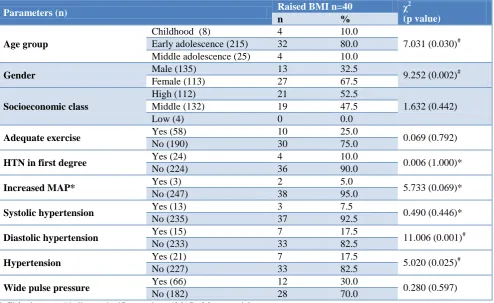
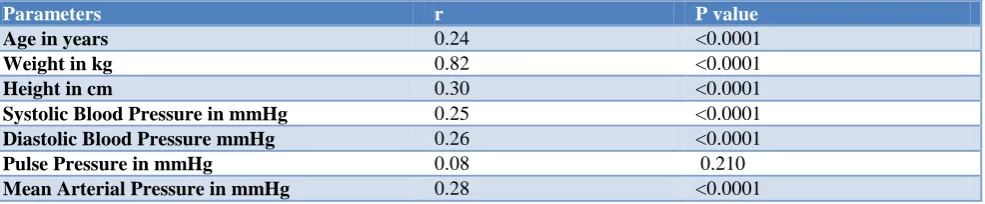
4.0% respectively, (table 1). Table 2 shows the mean age, BMI, SBP, DBP, PP and MAP, of the study population. Both schools have playground and games’ period was inculcated in their school curriculum: 1 hour per week in the girls’ school and 1 hour daily in the boys’ school. The prevalent physical exercise included sports activities such as football, basketball, swimming, dancing, lawn tennis, taekwondo, skipping and jogging. Only 23.4% (58/248) engage in optimal physical activity and those who have positive family history of obesity and HTN were 36.3% and 9.7% respectively. Females and early adolescents are more likely to have raised BMI, (table 3). Although majority of the students with raised BMI do not have increased SBP, DBP, MAP, PP and HTN as shown in table 3, those few with raised BMI still have higher mean systolic BP, diastolic BP and MAP, table 4. Students with elevated SBP and HTN have wide PP and increased MAP. Of the 13 students with elevated SBP, 11 had wide PP, p≤0.0001 and 55 other subjects with wide PP had no elevated SBP, p≤0.0001. The 3 students who had increased MAP also had elevated DBP and SBP, (P≤0.0001 respectively). There is weak but positive correlation between raised BMI and age, SBP, DBP and MAP.
Table 1: General characteristics of the study population.
Parameters Number Percentage (%)
Gender Male 135 54.4
Female 113 45.6
Age groups
Childhood (6-9 years) 8 3.2
Early adolescence (10-13 years) 215 86.7 Middle adolescence (14-16 years) 25 10.1
Socioeconomic class
High 112 45.2
Middle 132 53.2
Low 4 1.6
HTN in the first degree relative Yes 24 9.7
No 224 90.3
Diastolic hypertension Yes 15 6.0
No 233 94.0
Systolic hypertension Yes 13 5.2
No 235 94.8
Elevated blood pressure Yes 21 8.5
No 227 91.5
Increased mean arterial pressure Yes 3 1.2
No 247 98.8
Wide pulse pressure Yes 66 26.6
No 182 73.4
Obesity Yes 8 3.2
No 240 96.9
Overweight Yes 32 12.9
No 216 87.1
Raised body mass index Yes 40 16.1
Table 2: Mean parameters of the study population.
Parameters Mean± SD 95% CI, p value
Age in years 11.7±1.4 11.5 to 11.8, <0001
Weight in kg 43.3±9.5 42.0 to 44.4, <0.0001
Height in cm 155.2±9.6 154.0 to 156.4, <0.0001
Systolic blood pressure (mmHg) 101±13 99.0 to 102.2, <0.0001
Diastolic blood pressure (mmHg) 62±10 61.0 to 63.6, <0.0001
Pulse pressure 38±10 37.1 to 39.5, <0.0001
Mean arterial pressure 75.2±10.1 73.9 to 76.4, <0.0001
Body mass index in kg/m2 17.8±2.8 17.5 to 18.2, <0.0001
Table 3: Raised body mass index (BMI) and study population characteristics.
Parameters (n) Raised BMI n=40 χ
2 (p value)
n %
Age group
Childhood (8) 4 10.0
7.031 (0.030)# Early adolescence (215) 32 80.0
Middle adolescence (25) 4 10.0
Gender Male (135) 13 32.5 9.252 (0.002)#
Female (113) 27 67.5
Socioeconomic class
High (112) 21 52.5
1.632 (0.442)
Middle (132) 19 47.5
Low (4) 0 0.0
Adequate exercise Yes (58) 10 25.0 0.069 (0.792)
No (190) 30 75.0
HTN in first degree Yes (24) 4 10.0 0.006 (1.000)*
No (224) 36 90.0
Increased MAP* Yes (3) 2 5.0 5.733 (0.069)*
No (247) 38 95.0
Systolic hypertension Yes (13) 3 7.5 0.490 (0.446)*
No (235) 37 92.5
Diastolic hypertension Yes (15) 7 17.5 11.006 (0.001)#
No (233) 33 82.5
Hypertension Yes (21) 7 17.5 5.020 (0.025)#
No (227) 33 82.5
Wide pulse pressure Yes (66) 12 30.0 0.280 (0.597)
No (182) 28 70.0
*=Fisher’s exact. # indicates significant values; *MAP= Mean arterial pressure
Table 4: Mean parameters with cardiovascular indices and raised BMI.
Parameters Age in years SBP in mmHg DBP in mmHg BMI in
Kg/m2
PP in mmHg
MAP in mmHg Raised body mass index
Yes 11.3±1.5 106±13 67±11 22.7±2.1 38±9 80.3±11.1
No 11.7±1.4 100±13 61±10 16.9±1.8 38±10 74.2±9.7
P value 0.122 0.008# 0.002# <0.0001# 0.916 <0.0001#
Elevated systolic blood pressure (SBP)
Yes 11.8±1.2 128±8 74±11 19.4±3.0 54±13 92.3±8.2
No 11.7±1.4 103±67 62±10 17.7±2.8 37±9 74.2±9.4
P value 0.774 <0.0001# <0.0001# 0.034# 0.001# <0.0001#
Elevated diastolic blood pressure (DBP)
Yes 11.7±1.0 116±11 83±4 19.4±3.6 34±9 94.0±5.7
No 11.7±1.4 104±67 61±9 17.7±2.7 39±10 74.0±9.1
Parameters Age in years SBP in mmHg DBP in mmHg BMI in Kg/m2
PP in mmHg
MAP in mmHg Elevated blood pressure
Yes 11.8±1.2 123±10 77±10 19.4±3.2 46±16 92.1±6.8
No 11.6±1.4 103±68 61±9 17.7±2.7 38±9 73.6±8.9
P value 0.729 <0.0001# <0.0001# 0.006# 0.028# <0.0001#
Wide pulse pressure (PP)
Yes 11.6±1.3 111±12 61±11 18.1±2.6 51±7 77.6±10.5
No 11.7±1.4 102±76 63±10 17.7±2.9 34±6 74.3±9.9
P value 0.947 <0.0001# 0.112 0.410 <0.0001# 0.022#
Increased mean arterial pressure (MAP)
Yes 12.0 140 90 22.9 50 107
No 11.7±1.4 104±65 62±10 17.8±2.8 38±10 75±10
t (p value) 0.681 <0.0001# <0.0001# 0.032# 0.213 0.003#
#=significant values
Table 5: Correlation between BMI and age, anthropometric and CV indices.
Parameters r P value
Age in years 0.24 <0.0001
Weight in kg 0.82 <0.0001
Height in cm 0.30 <0.0001
Systolic Blood Pressure in mmHg 0.25 <0.0001
Diastolic Blood Pressure mmHg 0.26 <0.0001
Pulse Pressure in mmHg 0.08 0.210
Mean Arterial Pressure in mmHg 0.28 <0.0001
Only 3 students with raised BMI came for follow up in the paediatric endocrinology clinic and none of the students with elevated BP responded to the follow up visit.
DISCUSSION
The prevalence of raised BMI was high (16.1%) and predominant in females and could be explained partly by the physiologic differential increase in the percentage body fat in females from 5-6 years through adolescence, attributed to hormonal changes accompanying puberty.23 The abnormal CV indices observed in the index study showed no association with raised BMI. Although the few students with HTN, wide PP and increased MAP had comparably higher mean values for the CV indices, they did not have raised BMI. This may be explained by the fact that greater proportion of the raised BMI are overweight and it has been shown that complications from raised BMI occur with increasing BMI value and visceral adiposity (abdominal obesity and renal sinus fat).1,4,5,8,13,17 Moreso, complications from obesity and overweight are due to the excess fat mass which BMI does not directly assess because BMI does not differentiate between increased in mass due to fat, lean tissue and bone.18 Chandramohan et al found an association between wide PP and high waist circumference but not with obesity calculated from BMI.24 Mechanism of CV events in raised BMI has been linked to arterial stiffness following activation of renal sympathetic nervous system (SNS) by hyperleptinaemia,
CONCLUSION
The mean values for SBP, DBP, and MAP were comparably higher in those with raised BMI.
ACKNOWLEDGEMENTS
We are grateful to all the Resident doctors, interns and nurses in the different units of the Paediatric department. Our appreciation also goes to the Principals, teachers and students of St Brigid’s Girls Grammar school and St Patrick’s college Asaba.
Funding: No funding sources Conflict of interest: None declared
Ethical approval: The study was approved by the
Institutional Ethics Committee from FMC Health
Research Ethics committee
REFERENCES
1. World Health Organization. Obesity and Overweight. Fact sheet updated 2016. Accessed 13 August 2017.
2. Joint International Society of Nephrology (ISN) and the International Federation of Kidney Foundations (IFKF). Kidney Disease & Obesity: Healthy Lifestyle for Healthy Kidneys World Kidney Day 2017 fact sheet.
3. Ahmad MM, Ahmed H, Airede K. Body mass index among school adolescents in Sokoto, North-Western Nigeria. Sahel Med J. 2013;16:5-9.
4. Senbanjo IO, Oshikoya KA. Obesity and blood pressure levels of adolescents in Abeokuta, Nigeria. Cardiovasc J Afr. 2012;23:260–4.
5. Oduwole AA, Ladapo TA, Fajolu IB, Ekure EN, Adeniyi OF. Obesity and elevated blood pressure among adolescents in Lagos, Nigeria: a cross-sectional study. BMC Public Health. 2012;12:616. 6. Ujunwa FA, Ikefuna AN, Nwokocha ARC,
Chinawa JM. Hypertension and prehypertension among adolescents in secondary schools in Enugu, South East Nigeria. Ital J Pediatr. 2013;39:70. 7. Ezeonwu BU, Nwafor I, Nnodim I, Ayodeji A,
Ajaegbu O, Maduemem E et al. Risk factors for chronic kidney disease in children attending paediatric outpatient clinic in Federal Medical Center Asaba. J Prev Epidemiol. 2016;1(2):1-6. 8. Cote AT, Phillips AA, Harris KC, Sandor GGS,
Panagiotopoulos C, Devlin AM. Obesity and Arterial Stiffness in Children Systematic Review and Meta-Analysis. Arterioscler Thromb Vasc Biol. 2015;35:1038-44.
9. García-Espinosa V, Curcio S, Castro JM, Arana M, Giachetto G, Chiesa P, et al. Children and Adolescent Obesity Associates with Pressure-Dependent and Age-Related Increase in Carotid and Femoral Arteries’ Stiffness and Not in Brachial Artery, Indicative of Nonintrinsic Arterial Wall
Alteration. International Journal of Vascular Medicine. 2016;2016:4916246.
10. Cote AT, Harris KC, Panagiotopoulos C, Sandor GG, Devlin AM. Childhood obesity and cardiovascular dysfunction. J Am Coll Cardiol. 2013;62:1309–19.
11. Zieman SJ, Melenovsky V, Kass DA. Mechanisms, Pathophysiology, and Therapy of Arterial Stiffness. Arterioscler Thromb Vasc Biol. 2005;25:932-43. 12. Weisbrod RM, Shiang T, Al Sayah L, Fry JL,
Bajpai S, Reinhart-King CA, et al. Arterial stiffening precedes systolic hypertension in diet-induced obesity. Hypertension. 2013;62:1105-10. 13. Zebekakis PE, Nawrot T, Thijs L, Balkestein EJ,
van der Heijden-Spek J, Van Bortel LM, et al. Obesity is associated with increased arterial stiffness from adolescence until old age. J Hypertens. 2005;23:1839–46.
14. Zachariah JP, Graham DA, de Ferranti SD, Vasan RS, Newburger JW, Mitchell GF. Temporal Trends in Pulse Pressure and Mean Arterial Pressure During the Rise of Pediatric Obesity in US Children. J Am Heart Assoc. 2014;3:e000725. 15. Pierce GL, Zhu H, Darracott K, Edet I, Bhagatwala
J, Huang Y, et al. Arterial stiffness and pulse-pressure ampli cation in overweight/obese African-American adolescents: relation with higher systolic and pulse pressure. Am J Hypertens. 2013;26:20–6. 16. Blacher J, Staessen JA, Girerd X, Gasowski J, Thijs L, Liu L, et al. Pulse pressure not mean pressure determines cardiovascular risk in older hypertensive patients. Arch Intern Med. 2000;160:1085–9. 17. Uwaezuoke S N, Okoli C V, Ubesie A C, Ikefuna A
N. Primary hypertension among a population of Nigerian secondary school adolescents: Prevalence and correlation with anthropometric indices: A cross-sectional study. Niger J Clin Pract. 2016;19:649-54.
18. Hall ME, do Carmo JM, da Silva AA, Juncos LA, Wang Z, Hall JE. Obesity, hypertension, and chronic kidney disease. Int J Nephrol Renovasc Dis. 2014;7:75–8.
19. World Health Organization. Global strategy on diet, physical activity and health: Information sheet: global recommendations on physical activity for health 5-17 years. Accessed 5th September 2017. 20. Olusanya O, Okpere E, Ezimokhai M. The
importance of social class in voluntary fertility control in a developing country. W Afr Med J. 1985;4:205-12.
21. National High Blood Pressure Education Program Working Group on High Blood Pressure in Children and Adolescents: fourth report on the diagnosis, evaluation, and treatment of high blood pressure in children and adolescents. Pediatrics. 2004;114 (suppl 4th Report):555–76.
ultrasonic cardiac output monitor. Physiol Rep. 2017;5:e13195.
23. Forbes GB. Body composition. Growth in fat-free mass, fat mass and percent fat. In: Falkner F and Tanner JM eds. Human Growth: 2: Postnatal Growth: Bailliere Tindall London; 1978: 113–116. 24. Chandramohan G, Kalantar-Zadeh K, Kermah D,
Go SCM, Vaziri ND, Norris KC. Relationship between obesity and pulse pressure in children: results of the National Health and Nutrition Survey
(NHANES) 1988–1994. J Am Soc Hypertens. 2012;6:277–83.