http://www.ijcmph.com pISSN 2394-6032 | eISSN 2394-6040
Original Research Article
Assessment of nutritional status of children aged under five years in
tribal population of Jawadhu hills in Tamil Nadu
Gopinath T. T.
1*, M. Logaraj
2, K. R. John
2INTRODUCTION
Malnutrition is more common in India than in Sub-Saharan Africa. One in every three malnourished children in the world lives in India.1 Tribal population constitutes about 8% of the total population in India. They are particularly vulnerable to under nutrition, because of their geographical isolation, socio-economic disadvantage and inadequate health facilities.2 Children from scheduled tribes have the poorest nutritional status on almost every measure and the high prevalence of wasting in this group (28 per cent) is of particular concern.
India has the highest number of low birth weight babies per year at an estimated 7.4 million. Only 25 per cent of newborns were put to the breast within one hour of birth. Less than half of children (46 per cent) under six months of age are exclusively breastfed. Only 20 per cent children age 6-23 months are fed appropriately according to all three recommended practices for infant and young child feeding.1
According to the most recent estimates, child under nutrition contributes to more than one third of child deaths. Undernourished children who survive may enter
ABSTRACT
Background: Malnutrition is more common in India than in Sub-Saharan Africa. One in every three malnourished children in the world lives in India. Tribal population constitutes about 8% of the total population in India. They are particularly vulnerable to under nutrition, because of their geographical isolation, socio-economic disadvantage and inadequate health facilities. The objectives of this study were to assess the Nutritional status of children under five years in a Tribal area of Jawadhu hills under Puthurnadu PHC Sub-center and to find the associated risk factors accompanying the under five children.
Methods: A community based cross sectional study was conducted in a tribal area of Jawadhu hills Puthurnadu PHC sub-center. A total of 316 children participated in the study. A predesigned, pre tested questionnaire was used to collect data on socio demographic profile (age, sex, religion, education, income) from the Mother/Guardian and measured all possible anthropometric measurements.
Results: The overall prevalence of under nutrition was 26.9% in which Severely under nourished were 9.2%, the overall prevalence of stunting was 55.4% in which severely stunted were 23.4% and the overall prevalence of wasting was 10.4% in which severely wasted were 1.9% respectively. Male children were found to be more malnourished than Female children in our study. Children from joint family are more prone to get malnourished than Nuclear families. Conclusions: The overall prevalence of stunting was higher (55.4%) which is greater than the cut-off point stated by the World Health Organization to indicate that the severity of malnutrition. Adequate measures to be made to overcome malnutrition.
Keywords: Malnutrition, Children, Tribal, Questionnaire
Department of Community Medicine, 1Shri Sathya Sai Medical College and Research Institute, Thiruporur, 2SRM
Medical College and Research Institute, Kancheepuram, Tamil Nadu, India
Received: 26 December 2017 Accepted: 01 February 2018
*Correspondence: Dr. Gopinath T. T.,
E-mail: [email protected]
Copyright: © the author(s), publisher and licensee Medip Academy. This is an open-access article distributed under the terms of the Creative Commons Attribution Non-Commercial License, which permits unrestricted non-commercial use, distribution, and reproduction in any medium, provided the original work is properly cited.
the vicious cycle of recurring illness and faltering growth, with irreversible damage to their growth, cognitive development, school performance, and future productivity as adults.1
In India, around 46 per cent of all children below the age of three are too small for their age, 47 percent are underweight and at least 16 per cent are wasted. Many of these children are severely malnourished. Malnutrition in children is not affected by food intake alone; it is also influenced by access to health services, quality of care for the child and pregnant mother as well as good hygiene practices. Girls are more at risk of malnutrition than boys because of their lower social status.
Demographic characteristics such as the child’s age and sex, birth intervals (both preceding and following), and mother’s age at childbirth are also associated with child nutrition.3 The three main indicators used to define under nutrition, i.e., underweight, stunting, and wasting, represent different histories of nutritional insult to the child. Low weight-for-age indicates a history of poor health or nutritional insult to the child, including recurrent illness and/or starvation, while a low weight-for-height is an indicator of wasting and is generally associated with recent illness and failure to gain weight or a loss of weight.4
METHODS
The present cross sectional study was undertaken among children under five years in Puthurnadu PHC subcenter area in Jawadhu hills in between July 2014-15. Sample size was 290, which was estimated using the formula with prevalence as 38% (weight for age) as per NFHS-3 survey.5 Those who were not willing to participate in the study were excluded.
After obtaining ethical committee approval, data collection proceeded with informed consent. Initially a Pilot study was conducted in that field practice area of Puthurnadu PHC and then data collection was started on a regular basis. By using simple random sampling technique, Puthurnadu PHC was selected from 3 existing PHCs and from Puthurnadu PHC, one Sub center was selected by simple random sampling technique again and under which 7 villages are covered and all 316 under five children were examined clinically and all anthropometric measurements were taken in the selected sub-center.
Two follow-up visits of locked houses were done and data was obtained. According to WHO, the indicators of nutritional status are weight for age (under nutrition), height for age (stunting), weight for height (wasting).6 All measurements were made according to UNSCN MODULE-6.7
Data was entered in Excel software (2007). Data was analyzed using statistical package for social sciences version 20. The statistical tests used were proportions and
chi-square tests. P value of less than 0.05 was considered as statistically significant.
RESULTS
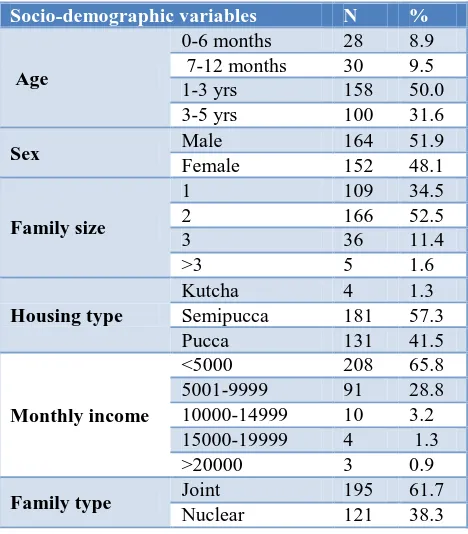
The present study carried out among 316 children shows the age-sex distribution of under five children out of 316 children 164 (51.9%), were males of which 85 (51.8%) were between the age group of 1-3 yrs. Female children were 152 (48.1%) of which 73 (48%) were between age group of 1-3 years. Out of 316, children 166 (52.5%) belongs to family with a family size of two followed by family size one 109 (34.5%) and family size three 36 (11.4%). majority of the income falls under Rs 5000 (65.8%) followed by between Rs 5001-9999 (28.8%) as per (Table 1). Also shows the education status of father as 95(30.1%) were illiterate followed by secondary education 73 (23.1%), middle 63 (19.9%), primary 59 (18.7%) and HSC 16 (5.1%) with graduate 10 (3.2%) and Education status of mother, out of 316 mothers, 99 (31.3%) had completed primary education followed by illiterate status 91 (28.8%), with secondary 55 (17.4%) and middle 50 (15.8%) with HSC 19 (6%) and graduate 2(0.6%). occupational status of both the parents, Shows 144 (52.8%) of the father were cultivator followed by labour 144 (45.6%) and others 5 (1.6%) and with mothers, 185 (58.5%) were cultivator followed by House wife 87 (27.5%) and labour 39 (12.3%).
Table 1: Socio-demographic variables of the study participants.
Socio-demographic variables N %
Age
0-6 months 28 8.9 7-12 months 30 9.5 1-3 yrs 158 50.0 3-5 yrs 100 31.6
Sex Male 164 51.9
Female 152 48.1
Family size
1 109 34.5
2 166 52.5
3 36 11.4
>3 5 1.6
Housing type
Kutcha 4 1.3 Semipucca 181 57.3 Pucca 131 41.5
Monthly income
<5000 208 65.8 5001-9999 91 28.8 10000-14999 10 3.2 15000-19999 4 1.3 >20000 3 0.9
Family type Joint 195 61.7 Nuclear 121 38.3
age, 32% of the children were moderately stunted followed by 30.4% with mild stunting and 23.4% with severely stunted in this study and then based on weight for height of the 316 children 16.1% had mild wasting, 8.5% had moderate wasting and 1.9% severely wasted in this study.
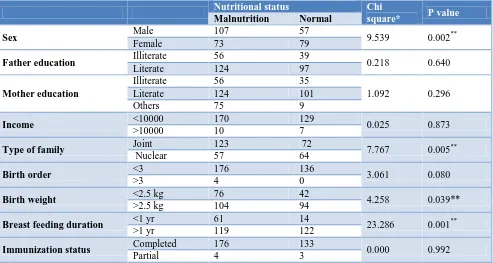
Table 3 shows association between the variables and malnutrition using Pearson’s Chi-square test. It was found that age, type of family, birth weight and breast feeding duration had statistically significance (p<0.05) with malnutrition.
Table 2: Distribution of malnutrition in study participants.
Malnutrition N %
Underweight (weight for age)
Mild 95 30.1 Moderate 56 17.7 Severe 29 9.2
Stunting (height for age)
Mild 96 30.4 Moderate 101 32.0 Severe 74 23.4
Wasting
(weight for height)
Mild 51 16.1 Moderate 27 8.5 Severe 6 1.9
Table 3: Association between malnutrition and study variables.
Nutritional status Chi
square* P value
Malnutrition Normal
Sex Male 107 57 9.539 0.002**
Female 73 79
Father education Illiterate 56 39 0.218 0.640
Literate 124 97
Mother education
Illiterate 56 35
1.092 0.296
Literate 124 101
Others 75 9
Income <10000 170 129 0.025 0.873
>10000 10 7
Type of family Joint 123 72 7.767 0.005**
Nuclear 57 64
Birth order <3 176 136 3.061 0.080
>3 4 0
Birth weight <2.5 kg 76 42 4.258 0.039** >2.5 kg 104 94
Breast feeding duration <1 yr 61 14 23.286 0.001**
>1 yr 119 122
Immunization status Completed 176 133 0.000 0.992
Partial 4 3
*Pearson chi square, **statistically significant.
Table 4: Logistic regression analysis.
B S.E. Wald df Sig. Exp(B) 95% C.I. for EXP(B)
Lower Upper Sex 1.120 0.267 17.542 1 0.000* 3.066 1.815 5.179 Family type 0.848 0.266 10.156 1 0.001* 2.335 1.386 3.934 Income 0.349 0.552 0.400 1 0.527 1.418 0.481 4.179 Breast feeding duration 2.662 0.579 21.134 1 0.001* 14.320 4.604 44.540 Mother occupation 0.975 0.318 9.421 1 0.002* 0.377 0.202 0.703 Father occupation 0.792 1.201 0.032 1 0.859 0.951 0.547 1.655 Immunization status 0.876 1.075 0.665 1 0.415 2.402 0.292 19.751
***Statistically significant.
Logistic regression model (Table 4) after controlling the effect of other variables showed that gender, family type, breast feeding duration and having mother’s occupation had an effect on malnutrition and this was associated with statistical significance.
DISCUSSION
females. This is similar to other studies10 while in some other studies there is equal distribution.8 There are studies which has proportion of girls more than boys and majority of the study subjects houses are semi pucca (57.3%) and this is similar with the study done by Indrapal Ishwarji Meshram et al which has 67% of them living in semi pucca houses.8,11 In our study, most of the subjects are from joint family (61.7%) and in contrast to our study, there are other studies which has Nuclear family as the most.11 In a study conducted by Seetharaman et al 70.8% were living in nuclear families.11
In the present study, majority of the literacy status of the father of the subjects were Illiterate (30.1%) and majority of the literacy status of the mother are with primary education (31.3%) followed by Illiterates (28.8%) and this was in contrast with other study conducted by Rao et al in which 96% of the subject mothers are Illiterates.15
A study done by Das et al among the Santal Tribal children with a total of 251 (116 boys and 135 girls) aged 2-6 years showed 38.2% underweight which was around 10% more than our present study and also with 26.3% (stunted) and 12.7% (wasted) in which wasted is more or like similar to our study and stunted being much more less compared with our study.16
Yet another study conducted by Bisai et al among Lodha children of Paschim Medinipur, West Bengal.9 Prevalence of underweight, stunting and wasting was 33.9%, 26.1% and 19.4%, respectively. Of these, 9.1%, 9.7% and 3.6% children were found to be severely underweight, stunted and wasted. This study has similar prevalence of underweight with our present study and all others vary with their respective indicators.
Similar study conducted by Nayak et al showed the difference between the prevalence of underweight, stunting and wasting based on WHO standards and NCHS standards and from our present study, the prevalence of stunting is more and the prevalence of wasting is less compared to this study.17
Similarly a study conducted by Ghosh-Jerath et al in villages inhabited by Sahariya tribal community in three districts of MP gave higher values compared to our study which is prevalence of underweight, stunting and wasting among under five children were 59.1%, 57.3% and 27.7% respectively.14
In our study, male children are more prone to get malnourished (underweight) than female children which was found to be statistically significant. Similarly, a study conducted by Meshram et al which has the prevalence of under-weight, stunting and wasting was significantly (p<0.01) higher among boys compared to girls.8 The prevalence of under nutrition was higher among boys than girls, which is similar with other studies.19
In our study, children from joint family are more prone to get malnourished (underweight) which was found to be statistically significant. Similarly in a study done Rao et al by the stunting was significantly higher among the children of joint families (46.8%) compared to nuclear (44.5%) or extended nuclear families (40.6%).18
Literacy status of both father and mother when compared to nutritional status shows children with Illiterate father and mother was more prone to get malnourished (underweight) compared to literate father and mother which is statistically not significant. Similarly, a study done by Mathad et al showed the prevalence rate of underweight was significantly associated with fathers literacy status (χ2=10.00, p=0.03) and not significantly associated with mothers literacy status of the children.12 In a study conducted in West Bengal, substantial difference was observed in the prevalence of malnutrition among children belonging to illiterate fathers (74.76%) and literate fathers (57.28%), which were statistically significant (p<0.05).22
In contrast with our present study, a study done by Chakrabarty et al that underweight was significantly associated with mother’s occupation and in other study done by Vijayaragavan et al showed the overall prevalence of under nutrition was highest among households engaged in tenant cultivation (75%) followed by agriculture labourers which has a mild contrary with our study.20,21
In our study, Among the children with family income less than 10000 Rs are 170 (57%) developed malnourishment and similarly 10 (59%) of those having income greater than 10000 Rs were also found be malnourished. similarly a study done by Vijayaragavan et al shows under nutrition decreased with increased percapita income and increased with increase in family size.21
In our study, children with birth weight less than 2.5 kgs were more chance of getting malnourished (underweight) compared to children with weight more than 2.5 kgs, which is not statistically significant. Similarly, a study done by Avachat et al has majority of malnourished children with birth weight less than 2500 gm (low birth wt) and have significant association between birth weight and malnutrition.13
CONCLUSION
Prevalence of under nutrition was 26.9% with Prevalence of Stunting was 55.4% and Prevalence of Wasting was 10.4%. This is a serious public health problem, by any scale which needs to be addressed immediately. Under such conditions, our intervention efforts need to be broader than providing supplementary nutrition alone.
More widespread use of the Z-Score system of classification, especially in community-based studies is recommended. This system enables us to estimate/express the prevalence of under nutrition using all the three indices – underweight, stunting and wasting.
Current measures of under nutrition were on their own unable to give a reliable estimate of the overall number of undernourished children in a population. Thus the study needs more number of repeated interventions among under five children especially so that better future can be obtained by minimizing the level of malnutrition.
Funding: No funding sources Conflict of interest: None declared
Ethical approval: The study was approved by the Institutional Ethics Committee
REFERENCES
1. UNICEF India. The children – Nutrition Available from http://unicef.in/Story/1124/Nutrition. Accessed on 12 September, 2015.
2. Rao KM, Balakrishna N, Laxmaiah A, Venkaiah K, Brahmam GNV. Diet and Nutritional Status of Adolescent Tribal Population in Nine States of India. Asia Pac J Clin Nutr. 2006;15(1):64-71. 3. Mishra VK, Lahiri S, Luther NY. Child Nutrition in
India. National Family Health Survey (NFHS) Subject Reports. 1999;14:1026-4736.
4. Bloss E, Wainaina F, Bailey RC. Prevalence and Predictors of Underweight, Stunting and Wasting among Children Aged 5 and Under in Western Kenya. J Tropical Pediatr. 2004;50(5):260-70. 5. National family health survey India (NFHS-3).
2005–2006. Available at: http://rchiips.org/nfhs/ nfhs3.shtml. Accessed on 12 September, 2015. 6. WHO child growth standards: Training course on
child growth assessment World Health Organisation.2008; Geneva, Switzerland. Available at: http://www.who.int/childgrowth/training/ module_h_directors_guide.pdf. Accessed on 12 September, 2015.
7. MODULE 6: Measuring malnutrition: Individual assessment. Available from http://www.unscn.org. Accessed on 12 September, 2015.
8. Meshram II, Arlappa N, Balakrishna N, Mallikharjuna Rao K, Laxmaiah A, Brahmam GNV. Trends in the prevalence of undernutrition, nutrient & food intake and predictors of undernutrition
among under five year tribal children in India. Asia Pac J Clin Nutr. 2012;21(4):568-76.
9. Bisai S, Bose K, Ghosh A. Nutritional Status of Lodha ChIldren in a Village of Paschim Medinipur District, West Bengal. Indian J Public Health 2008;52(4):203-6.
10. Mitra M, Kumar PV, Chakrabarty S, Bharati P. Nutritional status of Kamar tribal children in Chhattisgarh. Indian J Pediatr. 2007;74(4):381-4. 11. Seetharaman N, Chacko TV, Shankar SLR, Mathew
AC. Measuring Malnutrition -The Role of Z Scores and the Composite Index of Anthropometric Failure (CIAF). Indian J Community Med. 2007;1(1):35-9. 12. Mathad V, Metgud C, Mallapur MD. Nutritional
status of under-fives in rural area of South India. Indian J Med Sci. 2011;65:151-6.
13. Shubhada S, Vaishali D, Deepak B. Epidemiological Study of Malnutrition (Undernutrition) among under five children in a section of rural area. Pravara Med Rev. 2009;1(2):170-84.
14. Jerath SG, Singh A, Bhattacharya A, Ray S, Yunus S, Zodpey SP. Dimensions of Nutritional Vulnerability: Assessment of Women and Children in Sahariya Tribal Community of Madhya Pradesh in India. Indian J Public Health. 2013;57(4):260-7. 15. Rao KM, Kumar RH, Venkaiah K, Brahmam GNV.
Nutritional Status of Saharia – A Primitive Tribe of Rajasthan. J Hum Ecol. 2006;19(2):117-23.
16. Das S, Bose K. Assessment of Nutritional Status by Anthropometric Indices in Santal Tribal Children. J Life Sci. 2011;3(2);81-5.
17. Manjunath R, Kumar KJ, Kulkarni P, Begum K, Gangadhar MR. Malnutrition Among Under-Five Children of Kadukuruba Tribe: Need to Reach the Unreached. J Clin Diagnos Res. 2014;8(7):1-4. 18. Rao KM, Balakrishna N, Laxmaiah A, Venkaiah K,
Brahmam GNV. Diet and nutritional status of adolescent tribal opulation in nine States of India. Asia Pac J Clin Nutr. 2006;15(1):64-71.
19. Mittal A, Singh J, Ahluwalia SK. Effect of maternal factors on nutritional status of 1-5 year old children in urban slum population. Indian J Commu Med. 2007;32:264-7.
20. Chakrabarty S, Ghosh R, Bharati P. Breastfeeding Practices and Nutritional Status of Preschool Children among the Shabar Tribal Community in Orissa, India. Available at: http://www.researchgate. net/publication/239929301.htm. Accessed on 12 September, 2015.
21. Vijayaraghavan K, Brahmam GNV, Laxmaiah A, Kumar RH, Rao KM. Diet and Nutritional Status Of Rural Population. NNMB Technical Report Series No. 21.
23. Biswas T, Mandal PK, Biswas S. Assessment of Health, Nutrition and Immunization status amongst under -5 children in migratory bricklin population of periurban Kolkata, India. Sudanese J Public Health. 2011;6(1):1-4.