ISSN: 2372-5060 (Print), 2372-5079 (Online) Copyright © The Author(s). All Rights Reserved. Published by American Research Institute for Policy Development DOI: 10.15640/ijhs.v3n3a1 URL: http://dx.doi.org/10.15640/ijhs.v3n3a1
On the Causes of Cancer: The Argument for Inheritance
Doug Dix
1Abstract
Objective: To demonstrate that chance and environmental exposure cannot be principal causes of cancer, and, by elimination, that inheritance must be that principal cause. Methods: Age-specific rates for male cancers of the mouth, esophagus, bronchus, stomach, colon, rectum, pancreas, liver, kidney, and testis from 21 international populations were normalized, and the distribution of risk with age was analyzed. Results: Risk of cancer increases with age at a continuously decreasing rate until some age of peak risk, after which risk declines with age. Neither chance nor exposure can explain this distribution. Inheritance of universal aging genes offers the best explanation. Conclusion: Before the rise in risk, stem cells are quiescent. As they are called into active proliferation, risk rises to a peak, after which it declines with age because stem cells become non-proliferative either from differentiation or senescence.
Keywords: Cancer, Carcinogenesis, Aging, Inheritance
1.0 Introduction
Cancer can be caused by inheritance, chance, environmental exposure, or some combination of the above. But chance and exposure operate continuously. For either or both to be the principal cause(s) of cancer, risk would have to accelerate with advancing host age. Nordling (1953), Armitage and Doll (1954), and others (Dix et al 1980) working in an era when data from elders was considered unreliable, assumed this to be the case. Tomasetti and Vogelstein (2015) wrongly embraced this assumption: “These investigators showed that the relationship between age and incidence of cancer was exponential . . .” But Nordling, Armitage, and Doll didn’t look at the data for old elders. Cancer is a disease of aging (Klepin 2015). It is essential to analyze the data at old ages. That data shows clearly that beyond a certain old age, risk for the common cancers declines with age (Dix 1989). Beyond a certain age, risk for the uncommon cancers also declines with age. This opens the possibility that a similar process determines risk in most, if not all, tissues of tumor origin. For acute lymphoblastic leukemia, cerebellar and brain stem tumors, neuroblastoma, retinoblastoma, Wilms’ tumor, osteogenic and Ewing’s sarcomas, and rhabdomyocarcoma, this process peaks in childhood. For testicular cancer and Hodgkin’s disease, it peaks in middle-age. For the common cancers, it peaks in old age. Carcinogenesis, therefore, can be viewed as a milestone, the timing of which varies among the tissues of tumor origin. The key to understanding this milestone is explaining the age-dependent rise and fall in risk.
It isn’t possible to explain the fall in risk by a cumulative process such as chance or exposure to the environment. Inheritance, therefore, must be the prime culprit (Dix 2003; Nejako et al 2005). Tomasetti and Vogelstein dismissed inheritance because cancer concordance between identical twins is similar to that between fraternal twins (Roberts et al 2012; Lichtenstein et al 2000).). This eliminates inheritance of segregating genes as the principal cause of cancer. But if the relevant genes were the same in all people, they wouldn’t segregate, and they’d be invisible in twin studies (Dix 2003). The relevant genes cannot be those that control any continuous aging process. The spotlight, therefore, is on common genes that control one or more tissue milestones (Murthy and Ram 2014).
1
Cancers of the heart, nerve, muscle, and bone are rare in all populations, suggesting a commonly inherited property in these tissues, e.g., inactive stem cells (Bergmann et al 2009). Cancers of the lung and colon are common in most populations, suggesting a different commonly inherited property in these tissues, e.g., active stem cells. It is unlikely, however, that stem cell activity in itself is a sufficient explanation for the difference between resistant and susceptible tissue because some of the most cancer-resistant tissues have the most active stem cells, e.g., embryonic, hematopoietic, and small intestinal mucosal tissue. It is the purpose of this paper to a) establish that for most cancers in males, at least, the principal cause is an inherited, tissue-specific, aging milestone, and b) offer a viable model for this milestone.
2.0 Methods
Age-standardized and age-specific incidence rates for male cancers of the mouth, esophagus, stomach, small intestine, colon, rectum, liver, pancreas, bronchus, kidney, breast, and testis, as well as melanoma were obtained for the years 1983-87 from 21 sites, henceforth called “the global populations”: Canada, US-whites, US-blacks, New York City, New York State minus New York City, Los Angeles-blacks, Cuba, Puerto Rico, UK England and Wales, German Democratic Republic, Norway, Sweden, Finland, Warsaw City, St. Petersburg, Shanghai, Hong Kong, Miyagi, Osaka, Australia New South Wales, and New Zealand non-Maori (Parkin et al 1992 a). The editors of this source stress repeatedly “that these age-standardized rates are included only as a guide to possible differences between communities. The figures of greatest value are the age-specific rates given in Chapter 8 and these should always be consulted before any conclusions are drawn” (Parkin et al 1992 b). It is perplexing, therefore, that age-specific rates have not been recorded in this source beyond reference 10. So, although the rates are from the mid-80’s, they are the most recent, reliable, international age-specific rates available. To focus on the shape of age-distributions and minimize distraction by position on the incidence axis, I normalized specific rates by calculating ratios of age-specific rates for consecutive age groups. Specifically, I calculated the ratio of age-age-specific rates for age 35-39 to those for age 25-29, and then for ages 45-49/35-39, 55-59/45-49, 65-69/55-59, 75-79/65-69, and 85+/75-79. Henceforth each of these age-groups is identified by the first age, e.g., age-group 35-39 = 35.
The Pearson product-moment correlation coefficient, r, was calculated for different combinations of rates. The significance of r was determined by a t-test, where t equals the product of r and the square root of n-2/1 – r2.
Age-distributions were each based on more than 100 cases, except for the following: Warsaw City and Miyagi reported 96 and 60 cases, respectively, of mouth cancer, and Puerto Rico, Miyagi, US blacks, Cuba, and Los Angeles blacks reported 89, 74, 49, 33, and 15 cases, respectively, of testicular cancer. Male mortality rates from all causes in 1985 in the U.S. are reported in ten-year age- intervals (CDC 2009). Mortality rates at five-year intervals were determined by interpolation. These rates were normalized as they were for the cancer rates mentioned above by calculating the ratios of mortality rates at consecutive age groups, 35/25, 45/35, 55/45, etc.
3.0 Results
3.1 Shape of Age-Distributions for the Common Cancers
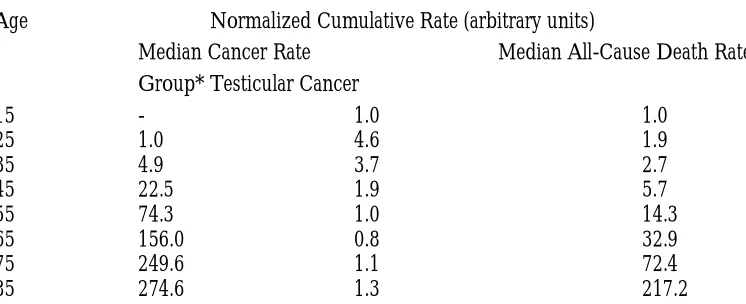
Clearly the three distributions are distinct in shape. But notice that the cancer distributions exhibit a decline in risk at old age, while the all-cause death distribution does not (Table 1).
3.2 Correlations between Adjacent Age-Specific Rates
Age-specific rates for cancers of the bronchus, colon, stomach, rectum, kidney, pancreas, esophagus, liver, and mouth were listed for each of the 21 global populations. Correlation coefficients were calculated between these lists for adjacent age-groups. Between ages 75 and 85+, r values were greater than .918 in all populations except Norway and Los Angeles black, where they were greater than .845. Between ages 65 and 75 and ages 55 and 65, r values were greater than .905 in all populations. Between ages 45 and 55, r values were greater than .912 in all populations except Shanghai and New Zealand non-Maori, where they were greater than .841. Between ages 35 and 45, r values were greater than .910 in all populations except German Democratic Republic, St. Petersburg, Sweden, LA black, Warsaw, New South Wales, Puerto Rico, Finland, and New Zealand non-Maori. Coefficients in these populations were greater than .858 except for Warsaw, New South Wales, Puerto Rico, Finland, and New Zealand non-Maori, where they were greater than .666.
3.3 Rank Order of Age-Standardized Rates for the Different Cancers
The median values for age-standardized rates in males in the 21 global populations are as follows: bronchus, 64.2, colon, 18.4, stomach, 14.8, rectum, 13.7, kidney, 8.9, pancreas, 8.5, esophagus, 5.3, liver, 4.2, melanoma, 3.0, testis, 2.9, mouth, 2.3, small intestine, .7, and breast, .4.
3.4 Is the Rank Order Fixed or Variable among Populations?
Bronchus cancer is common and small intestine and breast cancers are rare in all 21 global populations. The rank order of the other cancers, however, tends to vary except among populations of geographic similarity. In each of the 21 global populations, age-standardized rates were listed for cancers of the colon, stomach, rectum, kidney, pancreas, esophagus, liver, testis, and mouth as well as melanoma in that order. Correlation coefficients were calculated between these lists for all paired combinations of populations. Coefficients tended to be weak or moderate except between populations of geographic similarity. Of the 210 combinations of populations, 64 r-values were insignificant (r < .430, p > .05). Of the 146 significant r-values, the median was .758. Fifty-five were less than .697. Only 26 coefficients were greater than .899. Most of the populations exhibiting r > .899 were geographically similar, e.g.: Puerto Rico and Cuba, Shanghai and Osaka, Shanghai and Miyagi, Osaka and Miyagi, Sweden and Norway, U.S. blacks and Los Angeles blacks, New York City and New York State, Warsaw and Finland, Warsaw and St. Petersburg, Warsaw and German Democratic Republic, New South Wales and New Zealand, Canada and New York State, Canada and U.S. whites, Canada and Norway, Canada and Sweden, Canada and New Zealand, U.S. whites and New Zealand, U.S. whites and New York State, U.S. whites and New York City, New York State and New Zealand, New York City and Canada. Results for the above correlation coefficients were not substantially different if testicular cancer and melanoma were omitted.
3.5 Do Age-Standardized Rates for Different Cancers Share a Common Cause?
For each cancer, age-standardized rates were listed in fixed order for all 21 global populations. Correlation coefficients were calculated between these lists for all paired combinations of cancers of the colon, stomach, rectum, kidney, pancreas, esophagus, liver, testis, and mouth, as well as melanoma. Of the 55 cancer pairs, only 21 r-values were significant. Of these, only 14 were positive, the largest being .688 between cancers of the colon and rectum.
3.6 Is Age-Standardized Rate or Age-Distribution a Better Predictor of Cancer Risk?
For cancers of the bronchus, colon, stomach, rectum, kidney, pancreas, esophagus, liver, and mouth, the difference in age-specific rates between young and older ages is much greater than the difference in age-standardized rates between cancers or, for a given cancer, between populations. The greatest difference in population-median age-standardized rates is 28-fold, between cancers of the bronchus (64.2) and mouth (2.3). For a given cancer, the greatest difference in age-standardized rates is 24-fold, for liver cancer between Osaka (41.5) and UK (1.7). By comparison, the difference in median age=specific rates between ages 85 and 25 is 293 fold (Table 2).
4.0 Discussion
Cancer is common in some tissues and rare in others, and the reason for this difference is baffling. For instance, cancer of the mouth is rare and cancer of the bronchus common in all populations studied. But carcinogens enter the bronchus through the mouth. What protects the mouth and not the lung? Cancers of the colon and stomach are common, while cancer of the small intestine is rare in all populations. But carcinogens that leave the stomach or enter the colon pass through the small intestine. What protects the small intestine? Clearly, cancer risk is not simply a matter of exposure or chance. Some inherited property of mouth and small intestine must protect these tissues (Arturson and Knight 2015). Breast cancer is the most common cancer in females in all 21 populations studied except Shanghai, Osaka, and Miyagi, where it is second to stomach cancer, and Hong Kong, where it is second to bronchus cancer. But it is the least common cancer in males. The reason for this difference cannot be attributed to the environment or chance because it exists in all environments. Some inherited difference between the genders, e.g., hormones, must be responsible (Weiss et al 2005). Melanoma is rare except among whites. Sun exposure is thought to play a causal role (Lo and Fisher 2014). But it isn’t a simple or obvious role, for melanoma appears more often on the male chest and back than the more sun-exposed face, hands, and lower legs (Level et al 2009). And age-standardized rates across global sites don’t correlate well with latitude. Norway is farther from the equator than any of the 21 global populations, but it’s age-standardized rate for melanoma, 10.5, ranks behind only New South Wales at 25.9, New Zealand at 18.6, and US whites at 10.8. Inheritance might explain both the vulnerability to, and preference for, sun exposure.
Testicular cancer is rare except in whites, while liver cancer is rare only in whites. Differences in the inheritance of hepatitis virus and hormones might explain these differences. The uncommon cancers that occur in childhood or middle-age exhibit a rise in risk with age until some age of peak risk, and then a fall in risk with further advance in age. Testicular cancer is an example (Table 2). The common cancers that occur in old age exhibit the same pattern of rise and fall, but because the age of peak risk is old, there isn’t time to observe much of the decline in risk. The same model of carcinogenesis, therefore, might explain both types of cancers. The key to an effective model is explaining this rise and fall in risk. Among the cancers studied, r values between age-standardized rates, whether among cancers over all populations or among populations over all cancers are moderate, weak, or insignificant, precluding any common cause for age-standardized rates. Much of the difference in age-standardized rates among cancers and populations varies with geography. By contrast the impact of aging on cancer risk is invariant with geography and of larger impact. Correlations for a fixed list of cancers (bronchus, colon, stomach, rectum, kidney, pancreas, esophagus, liver, and mouth) between age-specific rates at adjacent ages are strong and positive in all populations, suggesting that, for these cancers, risk at a given age is caused by a process that occurs at younger ages. I suggest this process is the recruitment of quiescent stem cells into active proliferation (Coller 2011). And I offer a model for the rise and fall of risk with age.
5.0 References
Armitage P., Doll R (1954) the age-distribution of cancer and a multi-stage theory of carcinogenesis. Br J Cancer 8:1-12. doi: 10.1038/bjc.1954.1
Arturson P., Knight S.D. (2015) Breaking the intestinal barrier to deliver drugs. Science 347:716-717.
Bergmann O., Bhardwat R.D., Bernard D., et al. (2009) Evidence for cardiomyocyte renewal iin humans. Science 324:98-102.
Boman BM., Fields J.Z., Cavanaugh K.L., Gueter A., Runquist O.A. (2008) How dysregulated colonic crypt dynamics cause stem cell overpopulation and initiate colon cancer. Cancer Res 68:3304-3313. doi: 10.1158/0008-5472.CAN-07-2061.
CDC, National Vital Statistics System (2009), www.cdc.gov/nchs/nvss/mortality/hist290.htm. Coller H.A. (2011) The essence of quiescence. Science 334:1074-1075.
Dix D (1989) The role of aging in cancer incidence: An epidemiological study. Journal of Gerontology, Biological Sciences, Special Issue 44:10-18.
Dix D (2003) on the role of genes relative to the environment in carcinogenesis. Mech Ageing Dev 124:323-332. doi:10.1016/50047-6374(02)00113-6
Dix D (2015) Chemical control of cancer: The best way forward. In Rahman A U (ed) e-book, Frontiers in Clinical Drug Research – Anti-Cancer Agents, Vol. 2, benthamscience, pp 3-34, in press.
Dix D., Cohen P., Flannery J (1980) on the role of aging in cancer incidence. J Theor Biol 83:163-173. doi: 10.1016/0022-5193(80)90377-x
Hoei-Hansen C.E., Rajpert-DeMeyts C., Daugaard G., Skakkeback N.E. (2005) Carcinoma in situ testis, the progenitor of testicular germ cell tumours: a clinical review. Ann Oncol 16:863-868.
doi: 10.1093/annonc/mdi175.
Klepin (2015) Cancer in gerontological context. J. Gerontol A. 70:699-700 doi 1010.1093/Gerona/giv024
Levell N.J., Beattie C.C., Shuster S., Greenberg D.C. (2009) Melanoma epidemic: a midsummer night’s dream? Br J Dermatol. 161:630-634. doi: 10.111/j.1365-2133.2009.09299.x.Epub 2009 Jun 9.
Lichtenstein P. Holm N.V., Verkasalo P.K., et al (2000) Environmental and heritable factors in the causation of cancer – analysis of cohorts of twins from Sweden, Denmark, and Finland. N. Engl. J. Med. 343:78-85 doi: 10.1056/NEJM200007133430201.
Lo J. A., Fisher D.E. (2014) the melanoma revolution: From UV carcinogenesis to a new era in therapeutics. Science 346:945-949.
Murthy M, Ram J L (2014) Invertebrates as model organisms for research on aging biology. Invert Repro Dev 59: sup 1: 1-4 doi: a0.1080/07924259.2014.970002.
Nejako A., Aranton B., Dix D (2005) Carcinogenesis: A cellular model for the age-dependence. Anticancer Res 25:1385-1390.
Nordling C O (1953) A new theory on the cancer-inducing mechanism. Br J Cancer 7:68-72. doi: 10.1038/bjc.1953.8 Parkin D.M., Muir C.S, Whelan S., et al. (1992 a) Cancer Incidence in Five Continents, Volume VI, International
Agency for Research on Cancer, Lyon.
Parkin D.M, Muir C.S., Whelan S, et al. (1992 b) Cancer Incidence in Five Continents, Volume VI, International Agency for Research on Cancer, Lyon, pp 866-870.
Roberts N.J., Vogelstein J.T., Parmigiani G. et al (2012) The predictive capacity of personal genome sequencing. Science Translational Medicine. Doi: 10.1126/scitranslmed.3003380.
Russo J., Moral R., Balogh G.A., Mailo D., Russo I.H.(2005) The protective role of pregnancy in breast cancer. Breast Cancer Res 7:131-142.
Sharpless N.E., DePinho R.A. (2005) Cancer: crime and punishment. Nature 436:636-637. doi: 10.1038/436636A Tomasetti C, Vogelstein B (2015) Variation in cancer risk among tissues can be explained by the number of stem cell
divisions. Science 347:78-81.
Table 1: Normalized Age-Distributions
Ratio of Ages Ratio of Age-Specific Rates
Median Cancer Incidence Rates All-Cause Death Rates Group* Testicular Cancer
25/15 - 4.6 1.9
35/25 4.9 .8 1.4
45/35 4.9 .5 2.1
55/45 3.3 .5 2.5
65/55 2.1 .8 2.3
75/65 1.6 1.4 2.2
85/75 1.1 1.2 3.0
* Median over all 21 global populations over cancers of the bronchus, colon, stomach, rectum, kidney, pancreas, esophagus, liver, and mouth.
Table 2: Normalized Cumulative Age-Distributions
Age Normalized Cumulative Rate (arbitrary units)
Median Cancer Rate Median All-Cause Death Rate
Group* Testicular Cancer
15 - 1.0 1.0
25 1.0 4.6 1.9
35 4.9 3.7 2.7
45 22.5 1.9 5.7
55 74.3 1.0 14.3
65 156.0 0.8 32.9
75 249.6 1.1 72.4
85 274.6 1.3 217.2