Original Research Article
Evaluation of obesity and its risk factors among rural adults
in Tamil Nadu, India
Karthik R. C.
1, Gopalakrishnan S.
2*
INTRODUCTION
There has been a phenomenal rise in the prevalence of obesity in India in last few years, both in urban and rural areas.1 Obesity is a multi-factorial disorder, and is the leading cause of hypertension, diabetes, osteoarthritis, and various types of cancers in women like breast cancer and uterus cancer, menstrual disorder and infertility and many more diseases. Demographic transition combined with modernization and industrialization has resulted in
extreme changes in lifestyles all over the world, which has led to increase in the prevalence of obesity.2
The problem of obesity is now emerging in developing countries as well, where malnutrition and infectious diseases used to be the most serious problems. More than 1.1 billion individuals meet current definitions for overweight or obesity, which puts them at increased risk for number of chronic diseases including cardiovascular diseases and type 2 diabetes mellitus.3 Obesity is found to ABSTRACT
Background: Obesity is a largely emerging multi-factorial non-communicable disease, which is caused due to accumulation of fat cells either by an increase in the size or number. World over, obesity has been proven to be the leading cause for several non-communicable diseases like diabetes, hypertension, cancer, etc. This study was done to evaluate the prevalence and risk factors of obesity in a rural population of Tamil Nadu.
Methods: This cross sectional study was carried out among 600 adults residing in Sripuram, a rural field practice area of our medical college. Data was collected by systematic random sampling method, using a structured questionnaire, to assess the socio-demographic characteristics, anthropometry and physical examination findings. Body Mass Index was calculated and classified as per WHO classification for Asians. SPSS Software Version 17 was used to analyze the data.
Results: Among the 600 total study subjects, 317 subjects (52.8%) were males and 283 subjects (47.2%) were females. The age distribution among the study population ranged between 20-60 years. Prevalence of overweight (BMI>23) was 25.3% and prevalence of obesity (BMI>25) was 25.5%. About 11.5% of the study subjects were underweight (BMI>18.5) and 37.7% of the study population had normal weight. Sibling obesity and presence of thyroid disorders were significantly associated with the risk of overweight and obesity.
Conclusions: This study highlights the need for periodic screening to detect obesity at its incipient stages. It is pertinent that awareness is created periodically to modify the diet and lifestyle risk factors in order to prevent further complications of obesity.
Keywords: Non-communicable diseases, Overweight, Metabolic disorders 1
Assistant Professor, Department of Community Medicine, Tagore Medical College and Hospital, Rathinamangalam, Chennai, Tamil Nadu, India
2
Professor, Department of Community Medicine, Sree Balaji Medical College and Hospital, Bharath Institute of Higher Education & Research, Chrompet, Chennai, Tamil Nadu, India
Received: 30 May 2018
Accepted: 04 July 2018
*Correspondence:
Dr. Gopalakrishnan S., E-mail: [email protected]
Copyright: © the author(s), publisher and licensee Medip Academy. This is an open-access article distributed under the terms of the Creative Commons Attribution Non-Commercial License, which permits unrestricted non-commercial use, distribution, and reproduction in any medium, provided the original work is properly cited.
be the strongest risk factor for persistent hypertension, which is an important risk factor for coronary artery disease and stroke.2,4-6 Aside from being a potentially modifiable cardiovascular disease (CVD) risk factor on its own, this non-communicable disease predisposes to other CVD risk factors such as diabetes mellitus, hypertension, dyslipidaemia and metabolic syndrome among others.7
A phenomenal rise has been observed in the prevalence of overweight and obesity among Indian youth.8,9 Among developing countries; obesity is now fast growing problem especially in lower socioeconomic status.10 According to WHO, worldwide, at least 2.8 million people die each year as a result of being overweight or obese, and an estimated 35.8 million (2.3%) of global DALYs are caused by overweight or obesity. In 2014, more than 1.9 billion adults, 18 years and older, were overweight. Of these over 600 million were obese. Moreover, 39% of adults aged 18 years and over were overweight in 2014, and 13% were obese.11
Most of the world's population lives in countries where overweight and obesity kills more people than underweight. The prevalence of obesity is high both in the developed and developing countries, leading to suggestions of an ―obesity pandemic‖ or ―globesity‖. The impact of obesity has been considerable in both developed and developing countries. According to a WHO report, obesity has been identified as a major cause of disability and premature deaths in less developed countries. It has been estimated that obesity accounts for 2% to 7% of total healthcare costs. There are also other costs to consider such as reduced quality of life and productivity loss attributed to medical leave.12
Worldwide obesity has nearly tripled since 1975. In 2016, more than 1.9 billion adults, 18 years and older, were overweight. Of these over 650 million were obese.13 As per ICMR-INDIAB-3 study, which was done in 3 states and 1 union territory of India, the prevalence of
overweight/obesity in rural Tamil Nadu was
14.6+15.3=29.9%.14 Although there have been several studies on prevalence of obesity in Tamil Nadu, there is a paucity of information on factors associated with it. Establishment of associated factors will be potentially useful in the holistic approach to the prevention of the rising prevalence of obesity and other non-communicable cardiovascular diseases.
With this background this study was planned with the following Objectives
1. To estimate the prevalence of obesity in the rural population of Kancheepuram district, Tamil Nadu.
2. To evaluate the socio-demographic and medical risk factors associated with obesity in the study area.
METHODS
Study area and study population
This study was carried out as a community based cross sectional study among rural adults, in the rural field practice area of our medical college, Rural Health Training Centre (RHTC) located at Sripuram, Kancheepuram district of Tamil Nadu.
The total population of Sripuram covered in the field practice area is around 36648, which includes 15343 males and 13865 females and about 24498 adults. The study population identified was all adults in the age group 20 to 60 years living in Sripuram. The duration of the study was for six months, between November 2015 and April 2016.
Sample size and sampling technique
The sample size was calculated based on the prevalence of obesity in an earlier study done in Chennai among the general population, which was found to be 28.5%.15 Based on this prevalence, using the formula 4PQ/L2, with 95% confidence limits and 13.5% relative precision, the sample size was calculated to be 542. Allowing 10% for refusals and attritions, the final sample size was calculated as 596, which were rounded off to 600.
Systematic random sampling method was used to identify the sample population. The list of people in the village aged >20 years was obtained from the field staff of the RHTC. There were a total of 24498 adults in the area living in approximately 7329 households during the study period. The households were arranged in sequential order and sampling frame was prepared. The sampling interval was calculated by dividing the total number of households (7329) by the required sample size (600). The sampling interval obtained was 12. The first number was selected at random by lottery method as 4. From this number, every 12th household was visited for data collection. All eligible adult residents from each house were taken for the study to get the required sample size of 600. If a house was found locked or eligible subject not available, the next house was visited.
Inclusion and exclusion criteria
All the adults belonging to age group 20-60 years living in Sripuram area of Kancheepuram district and willing to participate in the study by giving informed consent were included in the study. The residents of Sripuram who were unavailable during the period when study or those who were not willing to give consent for the study and pregnant and lactating women were excluded from the study.
Ethical approval and informed consent
prior to the commencement of the study. All participants were explained about the purpose of the study and an informed consent was taken from each of them prior to data collection.
Data collection
Data collection was carried out after pre-testing the questionnaire on 30 adults from a different geographic area to test the feasibility and viability of the interview schedule. The pre-tested structured interview schedule was used for the data collection. The questions consisted of socio-demographic factors like type of family, marital status, educational status, occupation and socio- economic status of the participant. Details regarding the family history and medical history were obtained.
Physical examination was carried out to measure the height and weight. Body weight was measured with the subject standing still on weighing scale and weight equally distributed on each leg. Subjects were instructed to not wear footwear, while their weight was being measured. Height was measured using a non-stretchable tape with the subject in an erect position against a vertical surface.
Operational definitions
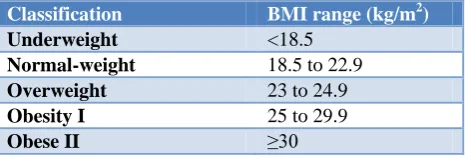
Body mass index was calculated by dividing the weight (in kilograms) with the square of height (in meters). For Asian populations the values of BMI have been reset, as their body composition is different from that of the western world. Proposed classification of weight by BMI in adult Asians: Underweight <18.5; Normal range: 18.5 - 22.9; Overweight >23; Obese I: 25 -29.9; Obese II >30. Overweight was defined as a BMI≥23 kg/m2 but <25 kg/m2 for both genders (based on the World Health Organization Asia Pacific Guidelines) with or without abdominal obesity.16 Generalized obesity was defined as a BMI ≥25 kg/m2
for both genders (based on the World Health Organization Asia Pacific Guidelines) with or without abdominal obesity.
Table 1: Body mass index classification (Asians).
Classification BMI range (kg/m2)
Underweight <18.5
Normal-weight 18.5 to 22.9
Overweight 23 to 24.9
Obesity I 25 to 29.9
Obese II ≥30
Statistical analysis
Data analysis was done using descriptive and analytical statistics. The descriptive statistics like frequency distribution and percentages is used to assess the various variables. The analytical statistics like P-value, Chi-
square, Odds ratio and Confidence interval were used to determine the association of obesity with selected variables. Data was analyzed using SPSS version 17. P<0.05 was considered as statistically significant value.
RESULTS
This study was carried out among 600 adults residing in the rural field practice area of our medical college. The demographic characteristics of the study participants are given in Table 2. Among the 600 total study subjects, 317 subjects (52.8%) were males and 283 subjects (47.2%) were females. The age distribution among the study population ranged between 20-60 years. As shown in the Table 2, majority of the subjects i.e. 67.2% belonged to less than 40 years age group and 32.8% subjects belonged to 40-60 years age group. Among the study population majority 551 (91.8%) belonged to the Hindu religion, 32 (5.3%) were Christians and 17 (2.8%) were Muslims. In this study 94.1% (565) of the study population were married, 5.2% (31) subjects were unmarried and 0.7% (4) of the study subjects were separated or widowed.
Table 2: Demographic characteristics of the study participants.
S. No Characteristics Frequency n=600
Percentage (%)
1.
Age distribution of the study group (in years)
20-30 131 21.83
31-40 272 45.33
41-50 153 25.50
51-60 44 7.34
2.
Sex
Male 317 52.8
Female 283 47.2
3.
Religion
Hindu 551 91.83
Muslim 17 2.83
Christian 32 5.34
4
Type of family
Nuclear 431 71.8
Joint family 160 26.7
Third
generation 9 1.5
5
Marital status
Married 565 94.16
Unmarried 31 5.2
Others 4 0.7
population belonged to upper middle class, 18.6% belonged to lower middle class.
The prevalence of obesity as per WHO classification of BMI is given in Figure 1. In the study population the prevalence of overweight (BMI>23) was 25.3%, the prevalence of obesity (BMI>25) was 25.5%. About 11.5% of the study subjects were underweight (BMI>18.5) and 37.7% of the study population had normal weight based on the WHO Asian classification of BMI.
Table 3: Socioeconomic characteristics of the study participants.
S. No Characteristics Frequency N=600
Percentage (%)
1. Literacy
Illiterate 51 8.5
Primary 25 4.2
Middle School 39 6.5
High School 86 14.3
Higher
Secondary 157 26.2
Graduate 212 35.3
Postgraduate 30 5.0
2
Occupation
Professional 157 26.2
Semi-professional 8 1.3
Clerical, shop
owner, farmer 8 1.3
Skilled worker 130 21.7
Semi skilled
workers 96 16.0
Unskilled
workers 8 1.3
Unemployed 193 32.2
3
Socioeconomic status (Modified BG Prasad Classification 2013)
Upper Class
(>5156) 91 15.2
Upper Middle Class (5155-2578)
387 64.5
Lower Middle Class (2577-1547)
112 18.6
Upper Lower Class (1546-773)
3 0.5
Lower Class
(<773) 7 1.2
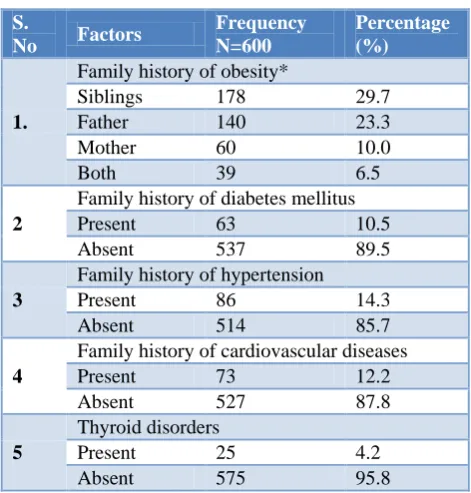
The medical risk factors of obesity are given in Table 4. In this study, 29.7% of the participants’ siblings were obese, while 39.8% had either one of the parent (father or
mother) being obese and 6.5% had both the parents being obese. About 10.5% of the study subjects had positive family history for diabetes, 14.3% of the study subjects had positive family history for hypertension, while 12.2% of the study population had positive family history for other cardiovascular diseases.
Figure 1: Prevalence of obesity among the study participants.
Table 4: Prevalence of medical risk factors among the study participants.
S.
No Factors
Frequency N=600
Percentage (%)
1.
Family history of obesity*
Siblings 178 29.7
Father 140 23.3
Mother 60 10.0
Both 39 6.5
2
Family history of diabetes mellitus
Present 63 10.5
Absent 537 89.5
3
Family history of hypertension
Present 86 14.3
Absent 514 85.7
4
Family history of cardiovascular diseases
Present 73 12.2
Absent 527 87.8
5
Thyroid disorders
Present 25 4.2
Absent 575 95.8
*The total will not be 100%.
The association between the medical factors and obesity is given in Table 5. In 146 participants out of 239 subjects who had BMI>23, had family history of obesity. There was strong statistically significant association between overweight/obesity and family history of obesity (p=0.0001). The association between history of sibling obesity and overweight/obesity was also statistically significant (p>0.009).
11.5
37.7
25.3
20.3
5.2 0
5 10 15 20 25 30 35 40
Under Wt <18.5
Normal 18.5-22.9
Over Wt 23-24.9
Obese.25-29.9 Very Obese >30 BMI% of participants [N=600]
Table 5: Association between BMI and family history of diseases.
S. No Risk Factors N=600 Overweight / obesity Chi square P value OR 95%CI
N %
1.
Family history of obesity
Present 239 146 61.1
17.4 0.001* 2.02 1.4-2.8
Absent 361 159 44.0
2.
Family history of diabetes mellitus
Present 229 108 47.2
1.9 0.158 0.8 0.6-1.1
Absent 371 197 53.1
3
Sibling obesity
Present 178 105 58.9
6.7 0.009* 1.6 1.1-2.3
Absent 422 200 47.4
4
Family history of hypertension
Present 86 49 56.9
1.5 0.218 1.3 0.8-2.1
Absent 514 256 49.8
5
Family history of cardiovascular diseases
Present 73 44 60.3
2.9 0.085 1.5 0.9-2.5
Absent 527 261 49.5
6
Thyroid disorders
Present 25 20 80
8.9 0.003* 4.07 1.5-10.9
Absent 575 285 49.6
*p value<0.05 is considered to be statistically significant
DISCUSSION
This study done among 600 adult people living in rural area of Kancheepuram district gives an interesting outcome, which is discussed in detail. In this study population, the prevalence of overweight (BMI>23) was 25.3%, the prevalence of obesity (BMI>25) was 25.5%. The prevalence of overweight / obesity observed in this study was comparable to a study done by Mohan et al. The Chennai urban rural epidemiology study (CURES-52), reported that the prevalence of generalized obesity among general population was 28.5%. The prevalence of overweight among general population was 22.5%.15 A study carried out by Prabakaran et al to determine the prevalence of generalized and abdominal obesity in urban area of Nellore, found that the prevalence of obesity by BMI was 48.12% (Male: 44.3%, Female: 51.9%). The prevalence of overweight was found to be more in males (9.33%).17
A study done by Venkatachalam et al in a rural population of South India, where it was found that 21.6% were obese and 23.8% were overweight.18 A study done by Deepa et al reported that the age-standardized prevalence of generalized obesity was 45.9%.19 A study by Wahab et al to determine the Prevalence and determinants of obesity in adult Northern Nigerian population, found that the prevalence of overweight and obesity was 53.3% and 21.0% respectively with a significantly higher prevalence in females compared to males.20
Changing dietary habits, using of junk food and limited physical activity pattern due to rapid urbanization,
modernization can be reasons for the increase in BMI in this rural area. Also the difference in prevalence rates could be due to different BMI cut off points being used in defining overweight/obesity and also differing age groups constituting the study population.
In most of these studies the prevalence of overweight and obesity was found to be higher in females compared to males but in our study there is a difference in the prevalence, which is found to be slightly more among males than females. About 51.7% males and 49.8% females were found to be overweight/ obese. Study by Prabakaran et al in Nellore also found that the prevalence of overweight was found to be more among males.17
In a study done by Chen et al found that approximately a third of the participants (34.0%) were obese and the prevalence of obesity was significantly higher in men (36.5%) than in women (31.6%).21 In studies carried out by Coll et al in the Balearic Islands in the Mediterranean Region and Reeder et al in Canada reported that men showed higher prevalence of overweight/obesity than women.22,23 A study carried out by Uthakalla et al in Hyderabad, found that men showed higher prevalence of overweight/obesity (34.82%) than females (19.67%).24
with obesity.26 In our study the association between known case of thyroid disorder and overweight/obesity was found to be statistically significant (p=0.003).
In this cross sectional study, the prevalence of overweight (BMI>23) was 25.3%, the prevalence of obesity (BMI>25) was 25.5%. The combined prevalence of Overweight/ Obesity was found to be 50.8% according to WHO Asia Pacific Guidelines for BMI. This study showed that risk factors like family history of obesity, history of sibling obesity, being a known case of thyroid disorder showed association with overweight/obesity.
Limitations
There are some limitations, which can be attributed to this study, which are briefly mentioned below.
The cross-sectional nature of the design does not allow for cause–effect relationships to be made.
The conclusions were based on metabolic risk factors rather than clinical end points or mortality data.
The study was conducted in a limited area with a limited sample size and does not necessary reflect the characteristics of the general population.
Dietary assessment was not included as part of the study.
CONCLUSION
The problem of obesity/overweight is on the rise in the study area, and there is a definite need to inculcate good habits of healthy eating and regular physical exercises. There is a further need to establish programmes for promoting good nutrition and healthy living awareness and lifestyle modifications among the population, regarding the health hazards and means of control for obesity in the study area
Combating the global epidemic of obesity requires action at the community and national levels. At the national level, framing appropriate policies based on primordial and primary prevention strategies for promotion of good balanced diet and adequate physical activity is needed. At the community level, we need to create a safe and healthy environment that promotes the adoption of healthy lifestyle behaviors among the population with due community participation.
ACKNOWLEDGEMENTS
We acknowledge with gratitude, the support and guidance given by Dr.R.Rama.MD, during data analysis and report writing. We also thank the Medical Officer and Field staff of the Sripuram RHTC for their support and guidance in carrying out the data collection by helping to organize house to house visits.
Funding: No funding sources Conflict of interest: None declared
Ethical approval: The study was approved by the Institutional Ethics Committee
REFERENCES
1. Yusuf S, Reddy S, Ounpuu S. Global burden of cardiovascular diseases: Part II: Variations in cardiovascular disease by specific ethnic groups and geographic regions and prevention strategies. Circulation. 2001;104(23):2855-64.
2. Rathod GB, Rathod S, Parmar P, Parikh A. Study of knowledge, attitude and practice of general population of Waghodia towards Diabetes mellitus. Int J Cur Res Rev. 2014;6(1):63-8.
3. Haslam DW, James WP. Obesity. Lancet.
2005;366(9492):1197-209.
4. Valente EA, Sheehy ME, Avila JJ, Gutierres JA, Delmonico MJ, Lofgren IE. The effect of the addition of resistance training to a dietary education intervention on apo-lipoproteins and diet quality in overweight and obese older adults. Clin Interv Aging. 2011;6:235-41.
5. Yadav K, Krishnan A. Changing patterns of diet, physical activity and obesity among urban, rural and
slum populations in north India. Obes
Rev.2008;9(5):400–8.
6. Guyton AC, Hall JE. Dietary balances;Regulation of feeding;Obesity and Starvation;Vitamins and Minerals. Textbook of Medical Physiology. 11th Ed. Elsevier, Saunders Inc, New Delhi, India; 2007: 843-857.
7. Must A, Spadano J, Coakley EH, Field AE, Colditz G, Dietz WH. The disease burden associated with overweight and obesity. JAMA. 1999;282(16):1523-9.
8. Kapil U, Singh P, Pathak P, Dwivedi SN, Bhasin S. Prevalence of Obesity amongst affluent adolescent school children in Delhi. Indian Pediatr. 2002;39(5):449-52.
9. Shetty PS. Nutritional Transition in India. Public Health Nutr. 2002;5(1A):175-82.
10. Monteiro CA, Moura EC, Conde WL, Popkin BM. Socioeconomic status and obesity in adult populations of developing countries: A review. Bull World Health Organ. 2004;82(12):940-6.
11. World Health Organization. Obesity and
overweight. Geneva: WHO; 2015. Available at: http://www.who.int/mediacentre/factsheets/fs311/en /. Accessed 19 May 2018.
12. Joint WHO/FAO Expert Consultation. Diet, Nutrition and the Prevention of Chronic Diseases.
Geneva: WHO; 2003. Available at:
http://www.msssi.gob.es/profesionales/saludPublica /prevPromocion/docs/OMS_Dieta_y_Enferm_Croni cas.pdf. Accessed 19 May 2018.
13. World Health Organization. Obesity and
http://www.who.int/news-room/fact-sheets/detail/ obesity-and-overweight. Accessed 18 May 2018. 14. Pradeepa R, Anjana RM, Joshi SR, Bhansali A,
Deepa M. Prevalence of generalized & abdominal obesity in urban & rural India—The ICMR-INDIAB Study (Phase-I) ICMR-INDIAB-3. Indian J Med Res. 2015;142:139–50.
15. Mohan V, Deepa M, Farooq S, Datta M and Deepa R. Prevalence, awareness and control of hypertension in Chennai-The Chennai Urban Rural
Epidemiology Study (CURES-52). JAPI.
2007;55:326-32.
16. World Health Organization, International
Association for the Study of Obesity, International
Obesity Task Force. The Asia-Pacific
Perspective:Redefining obesity and its treatment. Sydney:Health Communications, 2000. Available at: http://www.wpro.who.int/nutrition/documents/ docs/Redefiningobesity.pdf. Accessed on 19 May 2018.
17. Prabakaran J, Vijayalakshmi N, Jyothi C, Susmitha KM, Vinoth Kumar. Obesity-An Emerging Health Problem;A Community Based Study in Urban Nellore. A.P. India. Nat J Res Com Med. 2012;1(1):20-5.
18. Venkatachalam J, Purty AJ, Singh Z, Abraham SB, Narayanan S, Sathya GR. Prevalence of Non Communicable Diseases (NCDs) in a Rural Population of South India. IJCM. 2014;2(1):55-61. 19. Deepa M, Farooq S, Deepa R, Manjula D, Mohan
V. Prevalence and significance of generalized and central body obesity in an urban Asian Indian population in Chennai, India (CURES:47). Eur J Clin Nutr. 2009;63(2):259-67.
20. Wahab KW, Sani MU, Yusuf BO, Gbadamosi M, Gbadamosi A, Yandutse MI. Prevalence and determinants of obesity - a cross-sectional study of
an adult Northern Nigerian population. Int Arch Med. 2011;4:10.
21. Chen Y, Rennie DC, Karunanayake CP, Janzen B, Hagel L, Pickett W et al. Income adequacy and education associated with the prevalence of obesity in rural Saskatchewan, Canada. BMC Public Health. 2015;15:700.
22. Coll JL, Bibiloni MdM, Salas R, Pons A, Tur JA. Prevalence and related risk factors of overweight and obesity among the adult population in the Balearic Islands, a Mediterranean Region. Obes Facts. 2015;8(3):220-33.
23. Reeder BA, Angel A, Ledoux M, Rabkin SW, Young TK, Sweet LE. Obesity and its relation to cardiovascular disease risk factors in Canadian adults. Canadian Heart Health Surveys Research Group. CMAJ. 1992;146(11):2009-19.
24. Uthakalla VK, Kumar KJ, Sekhar KC, Tondare D,
Chandra VD. Prevalence Study of
Overweight/Obesity among Adults (20-60 yrs) of Rural Field Practice Area of Osmania Medical College, Hyderabad. Indian J Public Health Research Development. 2012;3(3):245-9.
25. Pachucki MC, Lovenheim MF, Harding M. Within-Family Obesity Associations. American Journal of Preventive Medicine. 2014;47(4):382–91.
26. Van der Sande MA, Ceesay SM, Milligan PJ, Nyan OA, Banya WA, Prentice A, et al. Obesity and Under nutrition and Cardiovascular Risk Factors in Rural and Urban Gambian Communities. Am J Public Health. 2001;91(10):1641-4.