This study extends the empirical evidence on the diversity on board and its impact to the financial performance in Indonesian context. Board diversity, as the independent variable uses three indicator variable of gender diversity, nationality diversity, and education diversity. Aside from traditional proportion measurement, Blau Index also used to measure the heterogeneity degree of each proxy of diversity in this study. This research is focused on the manufacturing companies since manufacturing industry is the largest contributor to the Indonesian GDP. The observation in this research including 525 firm-years from 105 listed manufacturing companies. The result of the study reveals that the heterogeneity in terms of nationality is beneficial for the company as it gives a positive impact to the financial performance measures, while gender and education heterogeneity is proven otherwise.
Penelitian ini menguji dampak keragamaan para dewan komisaris terhadap kinerja keuangan di Indonesia. Keragaman dewan komisaris sebagai variable bebas dalam penelitian ini diukur dengan menggunakan keragaman jenis kelamin, keragaman kewarganegaraan dan keragaman tingkat pendidikan. Keunikan dalam penelitian ini adalah, menggunakan Blau Index dalam mengukur tingkat keragaman dewan komisaris yang ada. Penelitian ini fokus pada perusahaan manufaktur, yang merupakan kontributor terbesar atas PDB Indonesia. Penelitian ini melakukan observasi atas 525 firm-years yang terdiri atas 105 perusahaan publik di sektor manufatur. Penelitian ini menunjukkan bahwa keragaman atas kewarganegaraan membawa dampak kinerja keuangan yang positif bagi organisasi. Namun penelitian ini tidak menunjukkan dampak yang sama atas keragaman jenis kelamin dan tingkat pendidikan.
© 2018 IRJBS, All rights reserved.
Keywords: board, board diversity, manufacturing industry, financial performance, blau index
Kata Kunci:
dewan komisaris,
keragaman dewan komisaris, industri manufaktur, kinerja keuangan, blau index
Corresponding author: [email protected]
Josua Tarigan, Christoforus Hervindra, Saarce Elsye Hatane
Faculty of Economics Petra Christian University,
Jl. Siwalankerto No.121-131, Siwalankerto, Wonocolo, Kota Surabaya, Jawa Timur 60236
A R T I C L E I N F O A B S T R A C T
Does Board Diversity Influence
Financial Performance?
S A R I P A T I
INTRODUCTION
Conflict of interest may emerge when separation of ownership and management exist in a company. The managers will have the interest of maximising their own welfare instead of maximising the shareholder’s wealth (Jensen & Meckeling, 1976). This condition is often called as the agency conflicts (Hart, 1993). A corporate governance is a concept that is needed to reduce the agency conflicts (Dimitropoulos, 2014). An optimal board composition is required as a proper governance of companies. The composition of the board will affect the effectiveness of the board, how the board perform their roles, hence will affect the financial performance of the company (Gordini & Rancati, 2017). There are various definition of board composition by the researchers, such as percentage of insider on board (Agrawal & Knoeber, 1996), directors and managers term of service (Hermalin & Weisbach, 1991), board size (Kini, Kracaw, & Mian, 1995), and remuneration scheme used (Rose, 2007). In recent times, many researchers such as Campbell and Minguez-Vera (2008), Masulis et al. (2012), Mensi Klarbach (2014), Ntim (2015), Rose (2007), and Wynarczyk (2007), draw the interest to the board diversity topic as it will affect the effectiveness of the firm and ultimately the firm financial performance.
Gender, cultural and racial composition of the board of directors is among the significant governance issues that current modern corporation managers, directors and shareholders are facing. It also draws the attention from popular press, proposal from advocacy group, and major institutional investors (Carter, et al., 2003). Moreover, following the major corporate scandals around the globe such as Enron, WorldCom, HIH Insurance, and Parmalat, many practitioners also encourage the diversity on board (Ujinwa et al., 2012). This issue also supported by Securities and Exchange Commission (SEC) approve a rule that requires company to disclose the diversity information on board in December 2009 (Wahid, 2012). In conclusion, the board diversity is become
a significant issue among global corporations.
There are several prior studies about board diversity and financial performance. Gordini & Rancati (2017) study the Italian corporation about board diversity measured with the percentage of women on board which has a positive impact to the financial performance measured with Tobin’s Q. Positive impact of board diversity and financial performance also found in the research by several other researchers such as Kilic & Kuzey (2016) using samples from Turkish corporation, Mahadeo et al. (2012) with Mauritius corporation as the sample, and Campbell & Minguez-Vera (2008) using Spanish firms data. However negative link (Ahern & Dittmar, 2012) is found in the relationship between board diversity and financial performance. Moreover, most of the above researches defines the diversity on board only related to the gender mixture that presence on the board.
On the other hand, the study conducted by Fidanoski, et al. (2014) using a different way in defining the board diversity in terms of gender, education and nationality differences on board. Research conducted Fidanoski et al. (2014) aimed to find the effect of board diversity to the company performance which depicted in form of Tobin’s Q and return on asset (ROA). The result of the research conclude that companies with members on the board consisting of more educated members and women were more profitable and overvalued on the market than those companies composed of more foreigners on the board.
in Indonesia. Manufacturing companies are companies which engage in production of merchandise for use or sale using labour and machines, tools, chemical and biological processing, or formulation (Kapoor, 2017). Listed manufacturing companies in Indonesia divided into three sectors, which are basic and chemical sector, miscellaneous industry, and consumer goods industry (IDX, 2017). This makes the market share in the industry is more evenly spread, better competition and future prospects. Aside from that, manufacturing industry is the largest contributor for 2016 economy with 20,51%, followed with two other large industries, agriculture as well as retail and wholesale industry with 13.45% and 13.19% respectively (BPS, 2016).
Thus this study aims to find the empirical evidence on the impact of board diversity towards the company performance in Indonesia. The journals and papers that has already been made by some authors are mostly talking about their country’s scope, and rarely are talking about the relationship and impact of board diversity towards the company performance in Indonesia. One of the research talking about Indonesian scope is written by Darmadi (2010) using gender, nationality, and age as the proxy of diversity. The difference from Darmadi (2010) research with this paper is the different proxy of diversity used. This paper is using gender, nationality and education as the proxy of diversity. The control variable used in this chapter also different with those used in Darmadi (2010) research. Hence, it differs with the previous studies and could fill the research gap.
Through this research, author would like to measure the impact of board diversity towards the company financial performance in listed company in Indonesia particularly in manufacturing sector. Whereas the earlier paper majorly talked about all sectors of the stock exchange, which created another research gap. Furthermore, the manufacturing industry is being highlighted because it is the largest contributor of Indonesian
GDP in 2016 according to the Central Bureau of Statistics. Related to the measurement of diversity proxies, proportion alone is not a suitable measure, therefore a second measurement using Blau Index is used to measure the degree of diversity (Campbell & Minguez-Vera, 2008). The research will be done through the process of collecting secondary data, testing the hypothesis, as well as analyzing regression to identify the impact of each variable. The board of directors have an important role to make sure a good corporate governance. Supposedly, this paper would like to help the company’s directors, to examine whether or not the diversity on board is needed. Hence, the directors can take the result of this research as a tool to make better decision, particularly related to the board composition policy.
LITERATURE REVIEW
Corporate Governance
Same as countries such as China, Finland, Netherland, and Germany, Indonesia also divide the board structure into two-tier (Weimer & Pepe, 1999). This means that the separation of CEO and chairman role in the company is needed (OECD, 2017). Indonesian law oblige companies to have two boards in the structure of organization, namely board of managements and board of commissionaires (Darmadi, 2010). Board of commissionaires duties is also called as the business oversight because the obligation to monitor growth, survival, the company’s practice of business, as well as advising the board of managements. More importantly, board of commissionaires hold a strategic role to supervise the formulation and implementation of policies by the company management team (OECD, 2017). The members could be associated (non-independent) or unassociated ((non-independent) with the company (Darmadi, 2010). In contrast, the board of managements act as the representative of the company, internally and externally. Moreover, they act as the company agent act as the manager and supervisor of company assets. Thus the board of managements is fully responsible to the day-to-day controlling of the company (OECD, 2017). The two boards has different members and duties, so that the debatable duality problem exist in the single tier board structure can be eliminated (Darmadi, 2010). The board of commissionaire is considered equivalent with the board of directors (chairman). While, the board of managements is considered equivalent with the CEO. Therefore, not to be confused that this paper would like to discuss only about the board of directors not the CEO.
Board Diversity
It is believed that the benefits of diversity on the board are a broader perspective, successful marketing for different types of markets, innovation and creativity (Cox and Blake, 1991). Carter, et al. (2003) stated that as the marketplace becoming more diverse, better understanding can be obtained by the board diversity. A diverse
board also believed to reduce the group-think phenomenon, where the board effort to achieve agreement taken over the ability to see alternative actions, as the negative effect of non-diverse board (Ujinwa, et al., 2012). On the other hand, Cox and Blake (1991) also states that communication and interpersonal problems or conflict, may become a potential costs to the organization, as a result of the diversity of senior management members. Moreover, an increased cost associated to the time to make decision, as well as the problems coordination especially in competitive environment are possible to happen due to the diversity on board (Smith, et al., 2006). Despite the positive and negative outcome that may arise in the implementation of diverse board, company should take action to reduce the negative outcome while maximize the positive ones.
The method for distinguishing between unobserved and observed attributes can be used to categorize different proxy of diversity. Unobserved or also known as the implicit attributes, including cognitive characteristics, namely: education, employment, professional background and personal values. On the other hand, observed attributes are the easily detected matter including demographic characteristics such as gender, race, ethnicity, and age (Milliken & Martins, 1996). According to Erhardt et al (2003) most research focused on observed attributes of diversity. However, change can be made in different orientation on organizational issues and interaction styles with unobserved attributes of diversity (Milliken & Martins, 1996).
research such as, occupational funds (Goodstein et al., 1994), level of education (Herrmann & Datta, 2005), and tenure (Tihanyi et al, 2000). This research will use three explanatory variables for the board diversity, which are women on board, foreigners on board, and education on board.
Women on Board
Previous researchers such as Campbell & Minguez-Vera (2008) proxies the board diversity in terms of the gender diversity on board. Greater gender diversity have a tendency to benefit the company according to several arguments by researchers. Creativity and innovation can be increased as the result of gender diversity (Campbell & Minguez-Vera, 2008). Choi and Yoo (2007) suggest that women are considered “tough”, which gives them a great environment respect. Hurst et al. (1989), stated that women are focused on harmony as they considered to have a “feeling” of cognitive style. Moreover, it is believed that as the part of their behavior, women can facilitate the distribution of information (Earley & Mosakowski, 2000).
In contrary, there are several arguments that against the diversity on board, even harmful to companies. It may cause longer decision-making process (Hambrick et al., 1996), risk response difference (Jianakoplos & Bernasek, 1998) increase the probability of conflict (Joshi et al., 2006). High turnover and absenteeism of women also contribute to increase on firm cost (Cox & Blake, 1991). Moreover, a diverse group will increase the likelihood of conflict and less cooperative (Earley & Mosakowski, 2000), as well as they are less likely to have more frequent communication and also less likely to share common opinion (Williams & O’Reilly, 1998). Therefore, can be concluded that the previous researches have a mixed finding regarding the positive or negative effect to the company.
In current real world condition, the number of women pursuing career in managerial position are increasing. However, the percentage of women
representation on board are relatively low (Omar & Davidson, 1989). According to Equal Opportunity for Women in Workspace Agency, in 2009 the percentage of women on board in developed country such as Canada, United States, United Kingdom, and New Zealand are respectively 14%, 15.2%, 9%, and 8.7%. These data are showing an increase in general compared to the preceding year’s data for the same countries, 13%, 14.8%, 8.5%, and 7.1%. Even if the data shows increase in women participation on board in general, the survey conducted by Spencer Stuart (2016) showed that almost 75% of the respondent deny to support the boardroom diversity quota. This concluded that the according to the directors, the diversity on board should not be mandatory but voluntarily.
Foreigners on Board
Aside from the diversity in terms of gender, the view of board as collective body of key expertise and background representation are increasingly needed. Therefore, several large companies have appointed foreign board member from the company’s important markets (Virtanen, 2009). Researchers have different opinions in terms of the citizenship diversity and management team member’s culture. Some researchers believe that citizenship diversity can cause higher problems in cross-cultural communication (Lehman & Dufrene, 2008), as well as interpersonal conflict (Cox, Jr., 1991). Hence, it will make the board operate less effectively. However, a competitive advantage to the company such as, international linkage, shareholder right commitment, and managerial entrenchment avoidance can be obtained from the presence of foreign nationals (Oxelheim & Randoy, 2003).
are currently enjoying capital inflows from foreign investors. Companies with large amount of foreign investors are more likely to have a heterogeneous citizenship of board member. Unluckily, the research that link the foreigners on board and the corporate financial performance in the emerging markets is very rare (Darmadi, 2010).
Educational Diversity on Board
More diversity is needed at the board level. People from non-commercial environments such as the military, academia, and certain professions, also find it difficult to access a scale of non-executive directors due to an association of idleness on the company’s side and the unsuitable candidate’s experience (Fidanoski, et al., 2014). Diversity is necessary where the board have made conventional promises. A well-trained and inquisitive mind that can see different things can often be beneficial for idea gathering and therefore help advance board thinking (Waine & Green , 2012).
In the field of psychology, research shows that the educational diversity leverages performance in problem-solving groups. Putting many MBAs in a room and reaching a lower solution, and reaching them slower than if the MBA with lawyers, accountants and engineers (Dobbin & Jung , 2011) are mixed. Educational and intellectual acquisition in boards, assessed by the existence of executives with PhD degrees, is related with a decrease in risk taking. Moreover, highly educational directors would likely to enjoy social ties to other directors, government officials, executives, which may bring resources, information, and knowledge that may be beneficial for the company (Kumar & Zattoni, 2013). Consequently, educational diversity becomes the focus for many researchers (Bathula, 2008; Coffey & Wang, 1998; Herrmann & Datta, 2005).
Measurement for Board Diversity
In this research, there are three explanatory variables for the board diversity, which are,
women on board, foreigners on board, and education on board. The measurement for each variable will be using the ratio of each category on board. The formula for proportion measurement of each variable will be shown below.
Number of Female Commissioners Women on Board =
Number of Commissioners
Number of Foreigner Commissioners Foreigners on Board =
Number of Commissioners
Number of Commissioners holding Ph.D Education on Board =
Number of Commissioners
However, ratio calculation alone is not suitable to measure diversity, since the higher the proportion measurement will indicate homogeneity instead (Campbell & Minguez-Vera, 2008). Hence, second measurement using Blau Index as the index of heterogeneity is introduced. The index was first introduced Peter M. Blau in 1977. Index is included in the measurement of the proxy to indicate the heterogeneity level of the proxy in the regression (Fidanoski,et al., 2014). The formulation of Blau Index is computed below:
Blau Index = 1 - Pi2
n
i=1
Where Pi2 is the percentage of board members in each category and n is the total number of categories used, in this case the category is male or female. The minimum value of the index is 0 and the maximum value is 0,5. Therefore this index would display whether or not the proxy is balanced (Kilic & Kuzey, 2016). The more balanced the proxy, will indicate that the company is actually heterogeneous.
Return on Asset
used to generate that income. Hence, the positive result of ROA meaning that the asset owned can generate income for the company. ROA has been used in numerous studies regarding the board diversity (Kilic & Kuzey, 2016; Fidanoski et al.. 2014; Mahadeo et al., 2012; Darmadi, S., 2010).
Mahadeo et al. (2012) research concludes that the board diversity have a positive influence towards ROA. Moreover, Fidanoski et al. (2014) also research the relationship between ROA and board diversity. The result conclude that women on board and education on board have a positive impact towards ROA, while foreigners on board have a negative influence towards ROA.
The Return on Assets measure is formulated below:
Net Income ROA =
Total Asset
Tobin’s Q
Corporate value is an important measure of shareholder value (Gill & Obradovich, 2012). Company value is defined as the market value of the company because it can provide prosperity for investors / shareholders if stock price increases. High stock prices indicate that the value of the company is also high (White, et al., 2003). The value of shareholders will increase if the value of the firm increases as indicated by the high return of investment to shareholders (Sujoko & Soebiantoro, 2009). One way to calculate corporate value is by calculating Tobin’s Q ratio developed by James Tobin in 1969 and assessed to provide the best information, because this ratio can explain various phenomena occurring within the company such as cross sectional differences in investment decision making.
The value of Tobin’s Q describes a condition of investment opportunities owned by the company or potential growth of the company (Lang, et al., 1989). Tobin’s Q can be used to measure the company’s
performance that is in terms of potential market value. Companies with a high value of Tobin’s Q or > 1.00 will be more attractive to investors and have good investment opportunities. Conversely, if Tobin’s value q <1.00 illustrates that the stock is under undervalued condition which means that management has failed to manage the company’s assets and the potential for low investment growth so that investor interest is low to invest (Kim, et al., 1993). Tobin’s Q is also used as the financial performance measure of the previous research such as Gordini & Rancati (2017), Fidanoski et al. (2014), Ahern and Dittmar (2012), Darmadi, Salim (2010), and Campbell & Minguez-Vera (2007).
The Tobin’s Q formula developed by (Chung & Pruitt, 1994) can be formulated as follows:
MVE + PS + Debt Tobin’s Q =
TA
Where:
MVE = Market Value of Equity (Share price at the end of year times amount of outstanding ordinary shares)
PS = Preferred Stock Debt = Total short term debt TA = Book value of total assets
Control Variables
HYPOTHESES DEVELOPMENT
Relationship of Women on Board to Financial Performance
The gender diversity of corporate boards has been the main theme of in depth exploration in many studies. However the results of the studies show differences. In particular, there are many quantitative researches on the impact of gender diversity on company performance. Carter et al. (2003) suggests a positive association between the board’s gender diversity and the firm value, as assessed by Tobin’s q. This result also supported by some other research by Campbell & Minguez-Vera (2007), and Gordini & Rancatti (2017). In contrast, Farrell & Hersch, (2005) stated that they found no strong evidence or found some negative effects (Adams & Ferreira, 2009; Ujinwa et al., 2012). On the other hand, the research from Mahadeo et al. (2012), shows a positive link between gender diversity and ROA. Kilic & Kuzey (2016), Fidanoski et al. (2014) also agree to the finding of positive impact on ROA.
Previous empirical researches on the impact of diversity in the board members on firm performance were inconclusive, and the results were dependent heavily on the methodology. Different results were found based on time, country, economic environment, type of company, and the size of diversity and different financial performance. The association between board characteristics and company performance may vary by country, due to different regulations and governance structures, economic and cultural constraints, and the capital market size (Rhode & Packel, 2010). In Indonesian context, where majority of the listed companies are family owned, the existence of women on board are mainly because of the family relationship instead of the actual professional expertise of the person. The lack of ability of women on board would negatively affect the corporate financial performance (Darmadi, 2010). Therefore, the following hypothesis is made.
H1a: The gender diversity have negative impact to return on asset (ROA)
H1b: The gender diversity have negative impact to corporate Tobin’s Q
Relationship of Foreigners on Board to Financial Performance
There has been lack of study on the association between the board member nation’s diversity and the company’s financial performance in emerging market scenarios. Facts on the linkage between diversity and financial performance mostly come from emerging economies. The results of prior empirical researches were ambiguous. Most empirical studies were from US and UK data, particularly from the large companies. The results of these studies indicated different conclusions. Empirical investigation on the proportion of board citizenship in England showed the slightest diversity. Merely 7% of directors were not British, and 1% was from minority ethnic groups (Burmajster, 2009). Oxelheim and Randoy (2003) examined the impact of diversity of foreign board members on the value of firms in Norway and Sweden, and the results showed better performance for firms with foreign board members.
Furthermore, Barta, et al., (2012) explored the proportion of councils, women and foreign nationals in the senior team, ROE, and profit margins before interest and taxes out of 180 public companies in France, Germany, the United Kingdom and the United States from 2008 to 2010. It indicated that companies with diverse executive boards enjoyed significant revenue and ROE. Similar results were also indicated by other researchers analyzing the same field (Ruigrok, 2009; Ujinwa et al., 2012). On the other hand, there were other studies showing different results. One of them showed that foreign directors were related with less important company performance (Masulis, et al., 2012), or found no significant relationship with financial performance (Fidanoski, et al., 2014; Rose, 2007).
foreigners. This is resulting from the high share of foreign ownership in some firms. Foreigners on board will be more likely to draw the interest of foreign investors, as the foreigner directors will protect their interest (Oxelheim & Randoy, 2003). The more foreign investors invest in the company, will have positive impact to the financial performance (Darmadi, 2010). Aside from that, the foreigners can also possess different way of thinking, knowledge and insight that will result in better decision making and policy that will be favorable to the financial performance (Kumar & Zattoni, 2013). Following many other research related to the nationality of board members with corporate performance, the hypothesis are constructed below:
H2a: The national diversity have positive impact to firm’s return on asset (ROA)
H2b: The national diversity have positive impact to firm’s Tobin’s Q
Relationship of Education on Board to Financial Performance
Some research found that the number of board members with PhD level education was positively impacted to firm performance (Fidanoski, et al., 2014). On the other hand Bathula (2008) find that Ph.D level education negatively impacted on corporate performance, while Fidanoski et al. (2014) suggested there was no significant association between the ratio of education and bank performance. The previous research related to the education on board and financial performance is showing a mixed results.
Nevertheless, eligible board members with PhD degrees are considered as the most valuable strategic source of the company (Ingley & van der Walt, 2001). Board members with PhDs will guarantee the effectiveness of the councils with high levels of intellectual capacity, experience, assessment, and integrity. Board members with higher qualification are more likely to improve company performance and competitiveness by means of their professional expertise and
proficiency. With this argument, the following hypothesis is made:
H3a: The educational diversity have a positive impact to return on asset (ROA)
H3b: The educational diversity have a positive impact to Tobin’s Q
METHODS
This research is conducting an analysis using multiple regression test. The regression test consist of the variables stated below;
a. Women on Board as the first independent variable which measured with proportion and Blau Index.
b. Foreigners on Board as the second independent variable which also measured with proportion and Blau Index.
c. Education on Board as the third variable measured with the proportion and Blau Index.
d. Financial performance as the dependent variable measured with return on asset (ROA) and Tobin’s Q.
e. Firm size (FSIZE), Leverage (LEV), and board independence (BIND) as the control variable.
The model of analysis are as follows;
ROAit = β0 + β1 PWOMANit + β2 PFOREIGNit +
β3PEDUit + β4FSIZEit +
β5LEVit+β6BINDit+εit
ROAit = β0 + β1 BLAUWOMANit +
β2 BLAUFOREIGNit +
β3BLAUEDUit + β4FSIZEit +
β5LEVit+β6BINDit+εit
TQit = β0 + β1 PWOMANit + β2 PFOREIGNit +
β3PEDUit + β4FSIZEit +
β5LEVit+β6BINDit+εit
TQit = β0 + β1 BLAUWOMANit +
β2 BLAUFOREIGNit +
β3BLAUEDUit + β4FSIZEit +
β5LEVit+β6BINDit+εit
obtained from the published annual report, sustainability report, Bloomberg, and publicly available information in the media. The data is chosen based on certain criteria from 5 years observation. The criteria on sample selection are;
a. The company should be publicly listed and traded in the Indonesia Stock Exchange and operates in consumer goods sector in manufacturing industry.
b. It produces complete annual report from year 2011 until 2015.
c. It produce report related the board of directors.
d. It published annual report’s figures are in Rupiah.
e. It published financial statements’ figures should show 1-year figure.
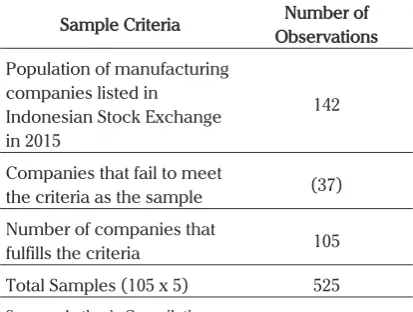
Table. 1 summarizes the total data sample used in this research paper.
Table. 1 Data Sample Summary
Sample Criteria ObservationsNumber of
Population of manufacturing companies listed in
Indonesian Stock Exchange in 2015
142
Companies that fail to meet
the criteria as the sample (37) Number of companies that
fulfills the criteria 105
Total Samples (105 x 5) 525
Source: Author’s Compilation
RESULTS AND DISCUSSION Classical Assumption Test
Classical assumption test is done to ensure that this study uses valid data. Because in this research panel data, then there are only three steps being performed in the classical assumption, namely normality test, multicollinearity testing and heteroscedascity testing.
Normality test aims to see distribution of the data that is going to be tested. In order to pass the
normality test, the data distribution must be near to the bell shaped that is showing the normal distribution of data. In this research Smirnov test will be conducted. Kolmogorov-Smirnov will test the residual of the data being researched, in order to know whether it has normal distribution or not. The residual itself will reflect the model as a whole so that it will represent the model in the normality test. The data is having normal distribution to be tested in the regression model if the significance level is more than 5%.
The next classical assumption test is multicollinearity test. This test is conducted to see whether there is any correlation between independent variables in the regression formula. In order to be considered as good regression model, there should be no significant affect between each independent variables. There are two parts which need to be observed to test the multicollinearity. First is the Variance Inflation Factor (VIF) that needs to be less than 10 and second is the Tolerance (TOL) that needs to be more than 0.1 in order to ensure that the research model used does not contain any multicollinearity.
The last classical assumption test is heteroscedasticity test. This test is conducted to see whether there are any differences of the residual variance. In order to be a good regression model, homoscedasticity should be achieved. It means that the residual variance is constant one to another for each observation. Spearman test is being done to test the heteroscedasticity through calculating the absolute residual value of the model (RES_2). In order to pass the test, the significance level must exceed 5%. Below table shows that the regression model 1 has passed the heteroscedasticity test. All the independent variables have significant levels more than 5%.
topic further as it has been proven valid.
Regression Test
This research is using four models to describe the impact of the board diversity to financial performance. Therefore the regression test will be conducted four times. The regression test will be conducted using R-Squared Test. This test will identify the influence of independent variable to explain the dependent variable. The summary of regression test will be shown below in the Table 2.
Table 2. Summary of R-Squared Test Result
Model R Square Adjusted R Square the EstimateStd. Error of
1 0,341 0,333 5,56008
2 0,432 0,334 5,55622
3 0,614 0,609 0,30399
4 0,618 0,612 0,29283
Source: Author’s Compilation
In test result above can be seen that model 1 has the R-Square value of 0,341. Meaning that 34,1% of the dependent variable can be explained from
the independent variable used in the model. The rest 65.9% is determined by other factors that is not explained in the model. Moreover, the result for model 2, 3, and 4, are respectively, 42.2%, 61,4%, 61,8%, of the dependent variable influenced by the independent variable that exist in each model.
Hypothesis Test
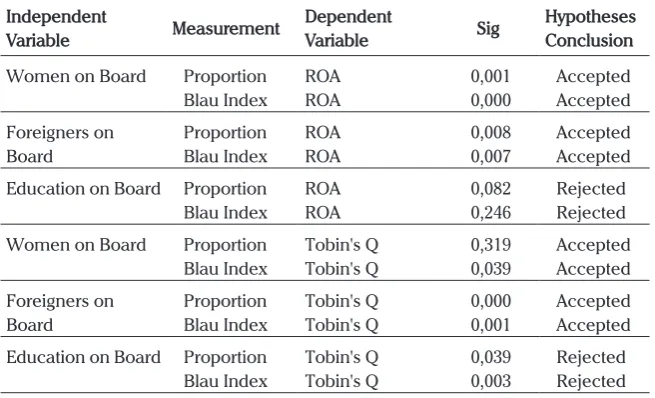
Significance level of 5% is used in this research. The T-Test that conducted on the four models existed in this research resulted in the four out of six hypotheses are accepted due to the significant value more than 5%. Table 3 will show the summary of the hypotheses test result.
Variable women on board measured with proportion has the significant value of 0,001 and negatively affecting ROA, as the β score is -4,693. Women on board measured with Blau Index has significant value of 0,000 and also negatively affecting ROA, as the β -4,661. Thus hypothesis
H1a is accepted. Foreigners on board measured with proportion and Blau Index respectively has the significant value of 0,008 and 0,007. This variable is positively affecting ROA with β of both
Table 3. Summary of Hypotheses Result
Source: Author’s Compilation Independent
Variable Measurement
Dependent
Variable Sig
Hypotheses Conclusion Women on Board Proportion
Blau Index
ROA ROA
0,001 0,000
Accepted Accepted Foreigners on
Board
Proportion Blau Index
ROA ROA
0,008 0,007
Accepted Accepted Education on Board Proportion
Blau Index
ROA ROA
0,082 0,246
Rejected Rejected Women on Board Proportion
Blau Index
Tobin's Q Tobin's Q
0,319 0,039
Accepted Accepted Foreigners on
Board
Proportion Blau Index
Tobin's Q Tobin's Q
0,000 0,001
Accepted Accepted Education on Board Proportion
Blau Index
Tobin's Q Tobin's Q
0,039 0,003
measurement respectively 2,950 and 3,467. Hence hypothesis H2a is accepted. The third variable of education on board measured with both proportion and Blau Index has significant value respectively 0,082 and 0,246 towards ROA. Which make the hypothesis H3a is rejected.
Women on board measured with proportion has significant value of 0,319 concerning Tobin’s Q. While measured using Blau Index has significant value of 0,039 and negatively affecting Tobin’s Q, as the β score is -0,152. Therefore, hypothesis
H1b is accepted. Foreigners on board measured with proportion and Blau Index respectively has significant value of 0,000 and 0,001. Foreigners on board is positively related to Tobin’s Q as the
β value of both measurement respectively shows 0,329 and 0,252 score. Hence hypothesis H2b is accepted. The last but not least, education on board shows significant value of both measurement respectively 0,039 and 0,003. This variable shows negative relation to Tobin’s Q, as both measurement shows β respectively, -0,265 and -0,277. Which conclude that H3b is rejected.
RESULTS AND DISCUSSIONS
Women on Board and ROA
The result of this research shows women on board measured by both proportion and Blau Index have a negative impct towards return on asset (ROA), hence the hypothesis H1a is accepted. The higher the proportion of women on board will lower the return on asset. The higher the evenness of women and men on board will also lower the return on asset. Negative impact of women on board and return on asset is in accordance with previous studies by Darmadi (2010) which found that women on board has negative significant result towards return on asset.
Table 4. Women on Board and ROA Data
Name Proportion Blau ROA
GJTL 2012 0,16667 0,27778 5,25065
INAI 2012 0,20000 0,32000 4,00438
SIPD 2012 0,33333 0,44444 0,75157
INDR 2012 0,40000 0,48000 0,20274
STAR 2012 0,50000 0,50000 0,11681
Source: Author’s Compilation
According to the result of Darmadi (2010) the condition of listed firms in Indonesia are mainly family controlled, the women that present on
board are more likely compelled by the family relationship rather than the actual competence of the person. Thus, will be more likely that the female directors have lack of necessary skills, expertise and, experience to conduct their responsibilities as directors. This lack of competence will result in a poor decision making process, and eventually will negatively affect the firm performance which is in this context is the return on asset (ROA).
Figure 1 is shown to understand the relationship of this two measurement further. From the figure 1 shown above, it is clear that the women on board have a negative impact with ROA. The higher the proportion and Blau Index measurement will result in lower ROA. Therefore, according to this research, it is better not to have female directors if a company want to have a good financial performance in terms of ROA.
Foreigners on Board and ROA
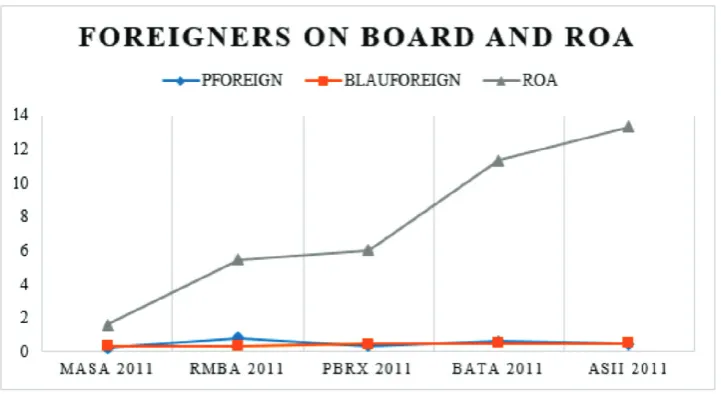
The result of this research shows that foreigners on board measured by both proportion and Blau Index has shown a positive impact, therefore the hypothesis H2a is accepted. The higher the proportion of foreigners on board will increase
the return on asset. The higher the evenness of foreigners and Indonesians on board will also increase the return on asset. Positive impact of foreigners on board and return on asset is in accordance with previous studies by Choi, et al. (2007) which found that foreigners on board has a positive significant result towards return on asset.
Table 5. Foreigners on Board and ROA Data
Name Proportion Blau ROA
MASA 2011 0,20000 0,32000 1,59444
RMBA 2011 0,80000 0,32000 5,44646
PBRX 2011 0,33333 0,44444 6,02112
BATA 2011 0,60000 0,48000 11,31282
ASII 2011 0,45455 0,49587 13,31332
Source: Author’s Compilation
Choi, et al. (2007) using the sample of Korean banks finds that foreigners that exist on board will be expected to take along competitive advantages towards the company. These competitive advantages is in the form of international networks, shareholder rights commitment and broader international perspective. These competitive advantage will in turns make the firm operates more efficient and effective and therefore will leads in a better performing firms. The better
performance can be interpreted as the higher income of the company. Hence, a higher return on asset (ROA).
From the figure 2, foreigners on board will have a positive impact towards return on asset. The mea-surement of both proportion and Blau Index have a positive impact to ROA. The higher the number of foreigners on board should be better to the return on asset measurement. However, the re-search is talking about whether or not the diversity or heterogeneity is needed on board. The higher number of foreigners relative to the number of di-rectors on board will eventually turn the board into a homogeneous board instead of heterogeneous. Therefore, a second measurement of Blau Index is introduced to measure the degree of evenness of the variable (Campbell & Minguez-Vera, 2008).
According to the data above, the higher the Blau Index, the higher the return on asset. A high Blau Index is not the same with the high proportion. Take the data from RMBA 2011 for example, 80% of the board is a foreigners. However, the Blau Index measurement shows a lower score compared to data from BATA 2011 where the proportion of foreigners is only 60%. This data suggest that in
case of both proportion and Blau Index shows a positive impact, it is better to the company to have an even amount of foreigners and Indonesian directors.
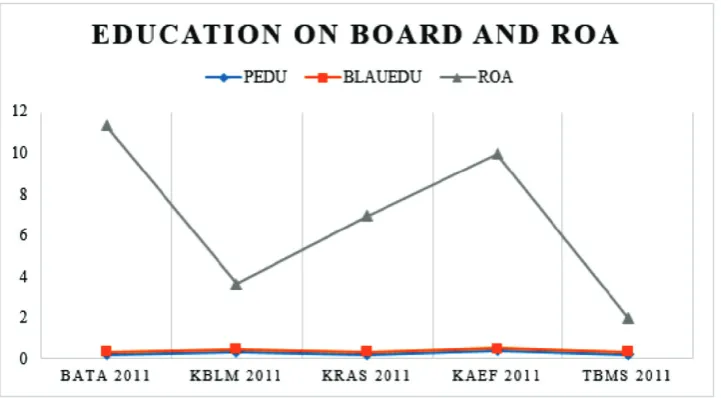
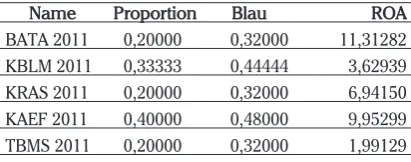
Education on Board and ROA
Observing the result of the data analysis, the result of both measurement of proportion and Blau Index has the same result which is not statistically significance, resulted that hypothesis H3a is rejected. The change in proportion of PhD holder as well as the degree of heterogeneity of PhD and non-PhD holder on board will not have any impact towards the financial performance of the company measured with return on asset. This result is not consistent with the previous researches conducted by Hilmer (1998), as well as Carpenter and Westphal (2001) which shows a positive relationship.
However, the result is in line with the study conducted by Fidanoski, et al (2014). Using Macedonian firms sample in banking industry, the study shows that the PhD holder does not have impact to financial performance measured with the return on asset ratio. The reason is because the PhD degree they have is on the field that is
not suitable with the nature of business field of the company. For example, the director have the degree in political science, while the company operates as a steel manufacturing company. Therefore, the PhD degree they have will not directly give the necessary competence to have a competitive advantage regarding their company operations. Eventually this condition will result in no impact towards the return on asset.
Table 6. Education on Board and ROA Data
Name Proportion Blau ROA
BATA 2011 0,20000 0,32000 11,31282
KBLM 2011 0,33333 0,44444 3,62939
KRAS 2011 0,20000 0,32000 6,94150
KAEF 2011 0,40000 0,48000 9,95299
TBMS 2011 0,20000 0,32000 1,99129
Source: Author’s Compilation
The board diversity in terms of education of the directors is measured using two measurement. To make it easier to understand the implication of the result of both measurement, several data is show in figure 3. Data shows that the impact of education on board to return on asset is not significant on both proportion and Blau Index measurement. Therefore, this study suggest that adding more PhD holder directors to the board will not have any impact to financial performance measured with return on asset.
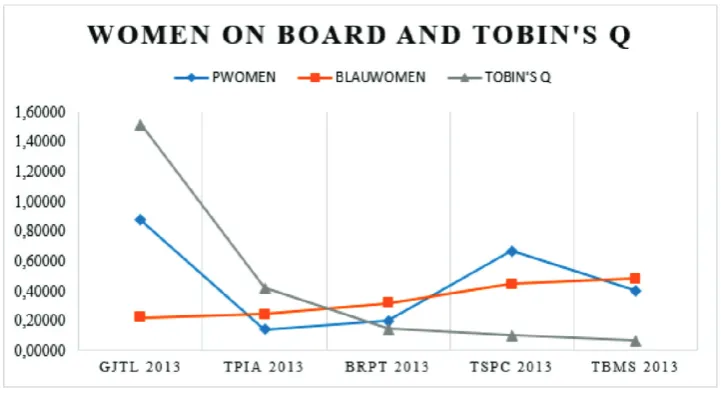
Women on Board and Tobin’s Q
The statistical analysis of women on board and Tobin’s q has a mixed finding. The result using proportion measurement shows that there is no significance towards Tobin’s q, meaning that the increase in in number of women on board will have no impact to financial performance of the company measured with Tobin’s q. This result is not consistent with the result from the previous result conducted by Darmadi (2010) which shows a negative relationship to Tobin’s q.
However, this result is agreed with Farell & Hersch (2005) where their studies shows that no strong evidence in this relationship between women on
board and financial performance measured with Tobin’s q. They find that the presence of women on board that does not have any significant diffe-rence with the presence of men on board since the women tend to follow the groupthink phe-nomenon that exist on board. The groupthink phenomenon is a condition where the decision making process and practice of thinking discou-rage personal responsibility and creativity, hence will eventually bring no change to the company (Farrell & Hersch, 2005). This will further have no impact towards the Tobin’s q. On the other hand, the result of Blau Index measurement shows that there is a negative relation between the women on board and Tobin’s q. Therefore, the hypothesis H1b is accepted. The result means that the higher the evenness or the heterogeneity degree of gen-der on board will result in lower calculation of Tobin’s q. This finding is consistent with the pre-vious research by Darmadi (2010) where women on board is negatively associated to Tobin’s q.
Table 7. Women on Board and Tobin’s Q Data Name Proportion Blau Tobin’s Q
GJTL 2013 0,87500 0,21875 1,51408
TPIA 2013 0,14286 0,24490 0,41940
BRPT 2013 0,20000 0,32000 0,14353
TSPC 2013 0,66667 0,44444 0,10090
TBMS 2013 0,40000 0,48000 0,06524
Source: Author’s Compilation
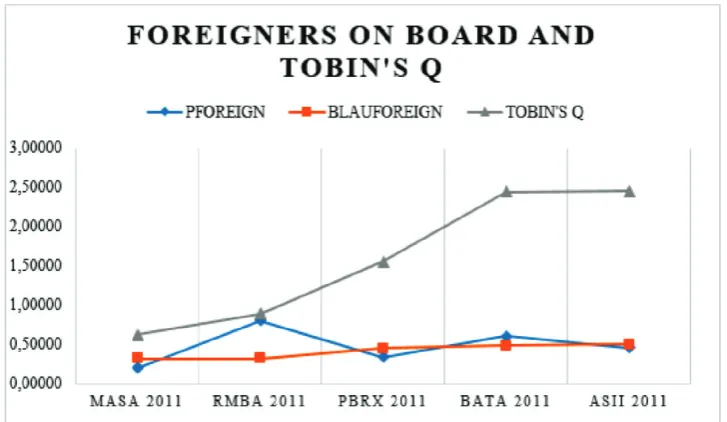
Foreigners on Board and Tobin’s Q
The result of the study shows that foreigners on board have a positive impact on both proportion and Blau Index measurement. This will result in the acceptance of H2b where foreigners on board is positively related to Tobin’s q. The higher the number of foreigners on board will make the Tobin’s q higher. Moreover, the higher the degree of heterogeneity of foreigners and Indonesian on board will also increase the Tobin’s q measurement. This result is consistent with the previous research conducted by Ararat, et al. (2010) using the sample of Turkish firms, stated that higher level of nationality diversity on boards leads to higher Tobin’s q.
The foreign ownership have an important role in company performance, especially in the
developing countries (Ararat et al., 2010). This findings also supported by Darmadi (2010), stated that Indonesia have a relatively high proportion of foreign ownership in several firms. Foreign owners are more able to provide performance-based incentives that will motivate the managers to strive for the company optimally and discourage those activities damaging the shareholder’s wealth creation (Ararat et al., 2010). Eventually it will increase the financial performance of the firm in terms of the Tobin’s q.
Figure 5 shows that both proportion and Blau Index measurement have a positive impact to the Tobin’s q. This result is similar to the result of foreigners on board to return on asset. The higher the proportion of foreigners should have resulted in a higher measurement of Tobin’s q. However, the data shows a higher degree of evenness of both variable will have a better result of Tobin’s q. This research suggest that the company should have an even number of foreigners and Indonesian on board to have a better measurement of Tobin’s q. Therefore, a diversity in terms of nationality is needed.
Figure 5. Foreigners on Board and Tobin’s Q Source: Author’s Compilation
Table 8. Foreigners on Board and Tobin’s Q Data Name Proportion Blau Tobin’s Q
MASA 2011 0,20000 0,32000 0,62225
RMBA 2011 0,80000 0,32000 0,88987
PBRX 2011 0,33333 0,44444 1,54821
BATA 2011 0,60000 0,48000 2,44141
ASII 2011 0,45455 0,49587 2,44986
Source: Author’s Compilation
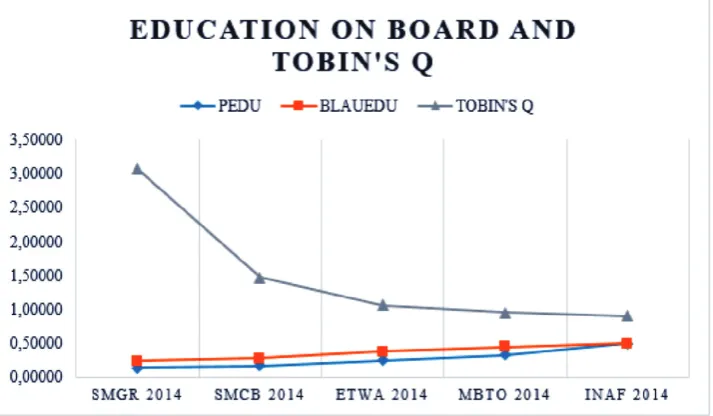
Education on Board and Tobin’s Q
Noticing the result of this study, the result of edu-cation on board using both proportion and Blau Index are showing a negative impact to Tobin’s q. Therefore, can be concluded that hypothesis H3b is rejected. The higher the proportion of PhD hol-der board member will result in the lower Tobin’s q. Moreover, the higher the degree of heteroge-neity of PhD holder and non-PhD holder on board will also result in lower Tobin’s q measurement. This result is different with the previous research from Fidanoski et al. (2014) which found that edu-cation diversity on board have a positive impact to Tobin’s q.
Table 9. Education on Board and Tobin’s Q Data Name Proportion Blau Tobin’s Q
SMGR 2014 0,14286 0,24490 3,07056
SMCB 2014 0,16667 0,27778 1,47452
ETWA 2014 0,25000 0,37500 1,06511
MBTO 2014 0,33333 0,44444 0,95412
INAF 2014 0,50000 0,50000 0,90992
Source: Author’s Compilation
Figure 6 above also suggest a negative impact of education on board to Tobin’s q. This study suggest that more PhD holder on board will have a negative impact to the Tobin’s q. Therefore, it implies that the diversity in terms of education is not needed.
MANAGERIAL IMPLICATIONS
This research shows that the diversity on board is beneficial and needed for the company that conducting it. Hence, the policy makers of the company can use this research as one of the decision making tools, especially policies related to the board of directors and diversity. Furthermore, this research also beneficial for the potential investors to consider the implementation and importance of corporate governance in their investment decision. Additionally, the current findings add substantially to our understanding of board diversity in terms of nationality, which is beneficial for the company. Therefore, companies can consider to have more foreigners as the commissioners. However, the number of foreigners on board should be balanced with the Indonesian commissioners.
CONCLUSION
The purpose of the research is to find the impact of board diversity to financial performance of Indonesian listed manufacturing companies that published the annual report for the year 2011-2015. The independent variable of board diversity is using three variables which are women on board, foreigners on board, and education on board. Moreover, each variable is measured using two measurement, namely proportion, and Blau Index because using proportion alone will result in homogeneity rather than heterogeneity. This study also contributes to the existing literature of the impact of board diversity to financial performance in Indonesia. The total number of observations in this research are 525 sample from 105 firms that publish the annual report in the year 2011-2015. All the data used in this research is taken from the information that is publicly released.
There the suggestions that can be given in regards on topic of board diversity and the impact to financial performance in Indonesia, companies need reconsider the effect of gender and education diversity on board as this research prove that both proxy have a negative impact to the financial
performance. However, to be noted that the author does not discourage the diversity in terms of gender and education, but to reconsider whether or not the effort to work on diversity on board in
both gender and education is worth the implication towards effectiveness and efficiency of the company’s operation.
R E F E R E N C E S
Adams, R., & Ferreira, D. (2004). Gender diversity in the boardroom. European Corporate Governance Institute. Finance Working Paper No. 58.
Agrawal, A., & Knoeber, C. (1996). Firm financial performance and mechanism to control agency problems between managers and shareholders. The Journal of Financial and Quantitative Analysis, 47(6), 377-397.
Ahern, K., & Dittmar, A. (2012). The changing of the boards: The impact on firm valuation of mandated female board representation. The Quarterly Journal of Economics, 137-197.
Al-Abbas, M. (2009). Corporate Governance and Earnings Management: an Empirical Study of the Saudi Market. The Journal of American Academy of Business, 15(1), 34-52.
Ararat, Aksu, & Cetin. (2010). Impact of board diversity on boards’ monitoring intensity and firm performance: Evidence from the Istanbul Stock Exchange. 17th Annual Conference of the Multinational Finance Society, 27-30 June, 43-67. Barcelona. Retrieved from http://papers.ssrn.com/sol3/papers.cfm?abstract_id=1572283
Asian Development Bank. (2013). ASEAN Corporate Governance Scorecard; Country Report and Assessment 2012-2013. .
Asian Development Bank.
Barta, T., Kleiner, M., & Neumann, T. (2012). Is there a payoff from top-team diversity? McKinsey Quarterly, 13-15.
Bathula, H. (2008). Board characteristics and firm performance: Evidence from New Zealand. Journal of University of Technology Auckland, 12(5), 5-28.
Beasley, M. (1996). An empirical analysis of the relation between the board of director composition and financial statement fraud. The Accounting Review, 71(4), 443-465.
Blau, P. (1977). Inequality and Heterogeneity. New York: The Free Press.
BPS. (2016). National Income of Indonesia 2012-2016. Jakarta: Badan Pusat Statistik. Retrieved from https://www.bps.go.id/ website/pdf_publikasi/Pendapatan-Nasional-Indonesia-2012---2016.pdf
Burmajster, A. (2009). The handbook of international corporate governance: A definitive guide. London: Kogan Page. Campbell, K., & Minguez-Vera, A. (2008). Gender diversity in the boardroom and firm financial performance. Journal of
Business Ethics, 83(3), 435-451.
Carpenter, M., & Westphal, J. (2001). The strategic context of external network ties: Examining the impact of director appointments on board involvement in strategic decision making. Academy of Management Journal, 44(4), 639-660. Carter, D. A., Simkins, B. J., & Simpson, W. G. (2003). Corporate Governance, Board Diversity, and Firm Value. The Financial
Review, 38(1), 33-53.
Choi, Park, & Yoo. (2007). The value of outside directors: evidence from corporate governance reform in Korea. Journal of Financial and Quantitative Analysis, 42(4), 941-962.
Chung, K., & Pruitt, S. (1994). A Simple Approximation of Tobin’s q. Financial Management, 23(3), 70-74.
Coffey, B., & Wang, J. (1998). Board diversity and managerial control as predictors of corporate social performance. Journal of Business Ethics, 17(4), 1595-1603.
Cox, Jr., T. (1991). The multicultural organization. Academy of Management Executive, 5(2), 34-47.
Cox, T., & Blake, S. (1991). Managing cultural diversity: implications for organizational competitiveness. Academy of Management Executive, 5(3), 45-56.
Darmadi, S. (2010). Board diversity and. MPRA, 1(1), 1-38.
Dimitropoulos, P. (2014). Capital structure and corporate governance of soccer clubs: European evidence. Management Research Review, 37(7), 658-678.
Dobbin, F., & Jung , J. (2011). Corporate board gender diversity and stock performance: The competence gap or institutional investor bias. North Carolina Law Review, 89(3), 809-839.
Management Journal, 43(1), 26-49.
Enekwe, Agu, & Eziedo. (2014). The Effect of Financial Leverage on Financial Performance:Evidence of Quoted Pharmaceutical Companies in Nigeria. IOSR Journal of Economics and Finance (IOSR-JEF), 5(3), 17-25.
Erhardt, N., Werbel, J., & Shrader, C. (2003). Board of director diversity and firm financial performance. Corporate Governance: An International Review, 11(2), 102-111.
Farrell, K., & Hersch, P. (2005). Additions to corporate boards: The effect of gender. Journal of Corporate Finance,11(2), 85-106. Fidanoski, F., Simeonovski, K., & Mateska, V. (2014). The impact of Board Diversity on Corporate Performance: New Evidence
from Southeast Europe. Corporate Governance in the US and Global Settings, 17(2), 81-123.
Fidanoski, Mateska, & Simeonovski. (2014). Corporate governance and bank performance: Evidence from Macedonia.
Economic Analysis, 47(2), 76-99.
Gill, A., & Obradovich, J. (2012). The Impact of Corporate Governance and Financial Leverage on the Value of American Firms.
International Research Journal of Finance and Economics, 91(1), 1-14.
Goodstein, J., Gautam, K., & Boeker, W. (1994). The Effect of Board Size and Diversity on Strategic Change. Strategic Management Journal, 15(3), 241-250.
Gordini, N., & Rancati, E. (2017). Gender Diversity in the Italian boardroom and firm financial performance. Management Research Review, 40(1), 75-94.
Hambrick, D., Cho, T., & Chen, M. (1996). The influence of top management team heterogeneity on firms’ competitive moves.
Administrative Science Quarterly, 41(4), 659-684.
Hart, O. (1993). Theories of capital structure: a managerial discretion perspective. (M. Blair, Ed.) Washington, DC: Brookings Institiution.
Hermalin, B., & Weisbach, M. (1991). The effects of board composition and direct incentives on firm performance. Financial Management, 20(4), 101-112.
Herrmann, P., & Datta, D. (2005). Relationships between top management team characteris and international diversification: An empirical investigation. British Journal of Management, 16(1), 69-78.
Hilmer, F. (1998). Strictly boardroom: Improving governance to enhance company performance. Melbourne: Information Australia.
Hurst, D., Rust, J., & White, R. (1989). Top management teams and organizational framework. Academy of Management Review, 10(1), 87-105.
IDX. (2017). Manufacturing Sector. Retrieved from idx.co.id: http://www.idx.co.id/id-id/beranda/perusahaantercatat/ laporankeuangandantahunan.aspx
Ingley, C., & van der Walt, N. (2001). The strategic board: The changing role of directors in developing and maintaining corporate capability. Corporate Governance: An International Review, 9(3), 174-185.
Jensen, M. C., & Meckeling, W. H. (1976). Theory of The Firm: Managerial Behaviour, Agency Cost, and Ownership Structure.
Journal of Financial Economics, 3(4), 305-360.
Jianakoplos, N., & Bernasek, A. (1998). Are women more risk averse? Economic Enquiry, 36(4), 620-630. Kapoor, S. (2017). Manufacturing at glance. Journal of Manufacturing Processes, 23(1), 40-59.
Kilduff, M., Angelmar, R., & Mehra, A. (2000). Top Management-Team Diversity and Firm Performance: Examining the Role of Cognitions. Organization Science, 11(1), 21-34.
Kilic, M., & Kuzey, C. (2016). The effect of board gender diversity on firm performance: evidence from Turkey. Gender in Management: An International Journal, 31(7), 434-455.
Kini, O., Kracaw, W., & Mian, S. (1995). Corporate takeovers, firm financial performance, and board composition. Journal of Corporate Finance, 1(1), 383-412.
Kumar, P., & Zattoni, A. (2013). Corporate Governance, Board of Directors, and Firm Performance. Corporate Governance: An International Review.
Lang, L., Stulz, R., & Walkling, R. (1989). Managerial performance, Tobin’s Q, and the gains from successful tender offers.
Journal of Financial Economics, 24(1), 137-154.
Lehman, C., & Dufrene, D. (2008). Business Communication 15th Edition. Mason: Thomson South-Western.
MacAvoy, P., & Millstein, I. (1999). The active board of directors and its effect on the The active board of directors and its effect on the. Journal of Applied Corporate Finance, 11(4), 8-20.
Mahadeo, J., Soobaroyen, T., & Hanuman, V. (2012). Team-based employee involvement programs: Effects of design and administration. Personnel Psychology, 105(3), 375-388.
Masa’deh, R., Mohammad, T., Jarrah, I., & Tarhini, A. (2015). Accounting vs. Market-based Measures of Firm Performance Related to Information Technology Investments. International Review of Social Sciences and Humanities, 9(1), 129-145. Masulis , R., Wang, C., & Xie, F. (2012). Globalizing the boardroom: the effects of foreign directors on corporate governance
Mensi-Klarbach, H. (2014). Gender in top management research: towards a comprehensive research framework. Management Research Review, 37(6), 538-552.
Milliken, F., & Martins, L. (1996). Searching for Common Threads: Understanding the Multiple Effects of Diversity in Organizational Groups. The Academy of Management Review, 21(6), 402-433.
Ntim, C. (2015). Board diversity and organizational valuation: unraveling the effects of enthnicity and gender. Journal of Management and Governance, 1(1), 167-195.
Obonyo, R. (2015). The Effects Of Financial Leverage On Financial Performance Of Listed Companies at The Nairobi Securities Exchange in Kenya. Researchjournali’s Journal of Finance, 3(1), 1-20.
OECD. (2017). OECD survey of corporate governance frameworks in Asia.
Omar, A., & Davidson, M. (1989). Women in management: a comparative cross-cultural overview. Cross Cultural Management: An International Journal, 8(4), 35-67.
Oxelheim, L., & Randoy, T. (2003). The impact of foreign board membership on firm value. Journal of Banking & Finance, 27(12), 2369-2392.
Rhode, D., & Packel, A. (2010). Diversity on corporate boards: How much difference does difference make. Rock Center for Corporate Governance at Stanford University, Social Science Research Network. Retrieved from http://papers.ssrn.com/ sol3/papers.cfm?abstract_id=1685615
Rose, C. (2007). Does female board representation influence firm financial performance? The Danish evidence. Corporate Governance: An International Review, 15(2), 404-413.
Ruigrok, W. (2009). Nationality, international experience diversity and firm internationalisation: The implications for performance. Journal of University of St. Gallen, 2(1), 21-45.
Smith, N., Smith, V., & Verner, M. (2006). Do women in top management affect firm performance? A panel study of 2,500 Danish firms. International Journal of Productivity and Performance Management, 55(7), 569-593.
Sujoko, & Soebiantoro, U. (2009). Metodelogi Penelitian Kuantitatif, Kualitatif dan R&D. Bandung: Alfabeta.
Tihanyi, L., Ellstrand, A., Daily, C., & Dalton, D. (2000). Composition of the top management team and firm international diversification. Journal of Management, 26(6), 1157-1177.
Ujinwa, A., Okoyeuzu, C., & Nwokoby, I. (2012). Corporate board diversity and firm performance: Evidence from Nigeria.
Review of International Comparative Management, 13(4), 605-620.
Velnampy, T. (2013). Corporate Governance and Firm Performance: A Study of Sri Lankan Manufacturing Companies. Journal of Economics and Sustainable Development, 4(3), 2222-2855.
Virtanen, O. (2009). The handbook of international corporate governance: A definitive guide. (F. I. Directors, Ed.) London: Kogan Page.
Wahid, A. (2012). Director heterogenity and its impact on board effectiveness. Journal of University of Harvard, 13(1), 35-50. Waine, P., & Green , H. (2012). Directors heterogeneity and its impact on board effectiveness. (I. I. Directors, Ed.) London:
Kogan Page.
Weimer, J., & Pepe, J. (1999). A Taxonomy of Systems of Corporate Governance. Corporate Governance: An International Review, 7(2), 152-166.
White, G., Sondhi, A., & Fried, D. (2003). The Analysis and Use of Financial Statements, 3rd Edition. New York: Wiley. Williams, K., & O’Reilly, C. (1998). Demography and diversity in organizations: a review of 40 years of research. Research in
Organizational Beavior, 20(1), 77-140.