Original Research Article
Factors affecting adherence to antiretroviral therapy
in Andhra Pradesh, India
Bonu Naga Raju
1, Ganesh Shanmugasundaram Anusuya
2*, V. Hari Lakshmi
3,
Casper Johnson
4, Ezhil Radhakrishnan
5, Rama Ravi
6, Ronaki Ramesh
7,
Mangavalli Jagan Mohan Rao
8INTRODUCTION
The estimated number of people living with HIV
Nearly 18.2 million PLHIV were on Antiretroviral therapy (ART) by June 2016.1 The total number of PLHIV in India were 2.1 million at the end of 2015. Of
2
ABSTRACT
Background: An important factor to effectiveness of ART is good adherence to treatment. This study aims to
investigate the adherence levels to ART among people living with HIV (PLHIV) attending a Government ART centre in Anakapalli, Andhra Pradesh, India.
Methods: A cross sectional study was done among 1000 adult PLHIV receiving ART. Out of nearly 4500 patients on
ART we selected 1000 patients by simple random sampling technique. The average of adherence for a period of 2 years and socio demographic details were taken from the patients treatment card. Chi square test was performed to find out significant difference between the socio-demographic variables and adherence level < 95%.
Results: Out of 1000 patients, 53.9% were male. 42.2% were in age group 31 to 40 years. 50.1 % had adherence >95%. Major factors influencing poor adherence were: decrease in weight (OR=18.65, p=0.000); decrease in CD4 counts (OR=20.12, p=0.000), presence of opportunistic infections (OR=12.67, p=0.000), WHO stage 3 and 4 illness (OR=6.50, p=0.000), travel distance to ART >50 kilometres (OR=1.94, p=0.000), smoker (OR=1.82, p=0.000),being illiterate (OR=1.72, p=0.000), and alcohol consumption (OR=1.58, p=0.001).
Conclusions: Careful monitoring of weight, CD4 counts and opportunistic infections can help to identify poor
adherence early.
Keywords: Adherence, ART, CD4 Counts, Literacy, Smoking, India
1
Psychologist, ART Centre, Govt District Hospital, Anakapalli, Andhra Pradesh, India
2
Associate Professor, Department of Community Medicine, Tagore Medical College and Hospital, Chennai, Tamil Nadu, India
3
Professor, Department of Psychology and Parapsychology, Andhra University, Visakhapatnam, Andhra Pradesh, India
4
Senior ART Medical Officer, 8Medical Superintendent, Govt District Hospital, Anakapalli, Andhra Pradesh, India
5
Technical Officer, National Institute of Epidemiology, Chennai, Tamil Nadu, India
6
Director, John and Jenner Centre for Research, Erode, Tamil Nadu, India
7
Additional District Medial & Health Officer, District AIDS Program Control Unit, Visakhapatnam, Andhra Pradesh, India
Received: 11 January 2019
Revised: 25 January 2019
Accepted: 28 January 2019
*Correspondence:
Dr. Ganesh Shanmugasundaram Anusuya, E-mail: [email protected]
Copyright: © the author(s), publisher and licensee Medip Academy. This is an open-access article distributed under
the terms of the Creative Commons Attribution Non-Commercial License, which permits unrestricted non-commercial use, distribution, and reproduction in any medium, provided the original work is properly cited.
Andhra Pradesh and Telangana have the highest estimated number of PLHIV (3.95 lakhs) followed by Maharashtra (3.01 lakhs), Karnataka (1.99 lakhs), Gujarat (1.66 lakhs), Bihar (1.51 lakhs) and Uttar Pradesh (1.50 lakhs).3
As of march 2012 there were 45 ART centres and 89 link ART centres in Andhra Pradesh. Nearly 1,13,106 PLHIV were on first line ART (FLA) in Andhra as of march 2012.4 The adherence to ART was not much studied in PLHIV on FLA in Andhra. Hence we studied the prevalence of adherence to FLA and risk factors associated with poor adherence in PLHIV on FLA in a Government ART centre in Anakapalli, Visakhapatnam district in Andhra Pradesh.
METHODS
A cross sectional study of 1000 PLHIVs receiving FLA from Government hospital, ART Centre in Area Hospital, Anakapalli, Visakhapatnam district, Andhra Pradesh, India. The period of data collection was between September 2012 to August 2013.
Sample size
Depending upon the feasibility and availability of data we arrived at a sample size of 1000. In Anakapalli ART centre there were 8200 PLHIIV registered and nearly 4500 PLHIV were on FLA. From 4500 PLHIV we selected 1000 PLHIV by simple random sampling technique and also based on the inclusion and exclusion criteria.
Inclusion criteria
Inclusion criteria were diagnosed to have HIV infection by ELISA and were on FLA; PLHA on FLA and completed 2 years of ART as of September 2012; age more than 18 years; registered and seeking care from Anakapali ART centre.
Exclusion criteria
Exclusion criteria were PLHIV who have died and stopped treatment.
Data collected
Information pertaining to patients age, sex, occupation, community, educational status, marital status, income and distance of travel from house to ART centre were collected from patients treatment card. Adherence was measured based on the monthly pill counts done by ART counselors while the patients come for monthly collection of drugs. Based on the monthly missed doses the adherence was categorized into 3 different categories.
>95% adherence: The 95% adherence means that the patients have missed less than 3 pills in a month.
80-95% adherence: If the patients have missed 3 to 12 pills in a month we categorized them under 80-95%
<80% adherence: If the patients have missed more than 12 pills in a month they were categorized to be below <80% adherence.
We computed the monthly adherence for a period of 2 years (2010 and 2011) and then finally took the average adherence for a period of 2 years. The data regarding adherence was also collected from patients ART treatment card. While doing analysis we categorized the levels of adherence into 2 categories as >95% adherence and <95% adherence and did the chi square test.
Ethical clearance
The study was approved by the Ethical committee of the Anakapalli Government district hospital and ART centre.
Statistical analysis
The data collected were entered into excel sheet and analysed using SPSS (Statistical Package for Social Sciences) version 16. The frequency tables for all collected variables were computed. In analysis we grouped the adherence levels into two categories as >95% adherence and <95% adherence. Various socio demographic factors were analyzed to find out the reason for poor adherence (<95%) using chi square test. Multivariate logistic regression analysis was also done.
RESULTS
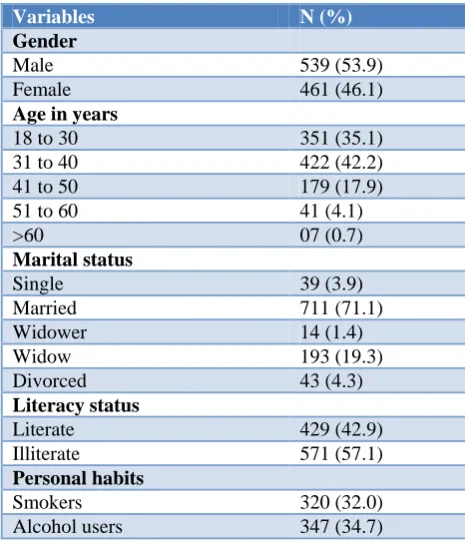
Nearly 53.9% of the study population were males, 42.2% in the age group 31 to 40 years, 71.1% married, 57.1 were illiterate, 32% smokers and 34.7% were alcohol users. The baseline characteristics were shown in Table 1.
From Figure 1 we can see the different proportion of adherence levels to FLA. Nearly 50.1% showed adherence >95%, 21% between 80-95% and 28.9% had adherence <80%. You can see from Table 2 the different socio demographic variables and personal habits been compared against poor adherence (<95%) in multivariate analysis.
We can see from Table 2 that factors like travel distance to ART >50 kilometers, being illiterate, alcohol consumption, smoking, and diagnosed as WHO clinical staging 3 and 4 were related to poor adherence and it was both statistically significant (p=0.05) and the odds ratio was also greater than 1.
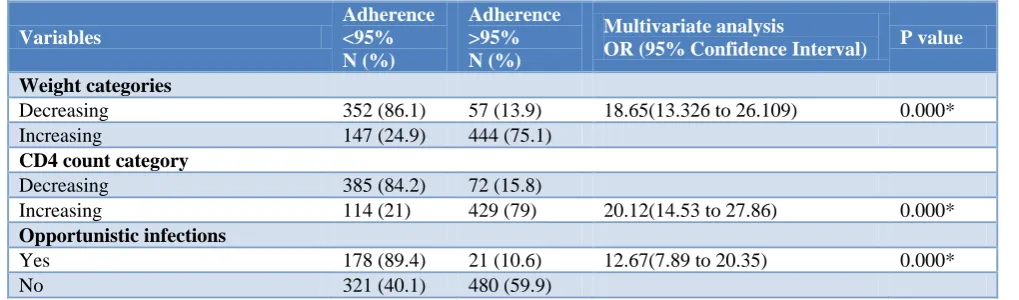
In Table 3 the clinical parameters like weight, opportunistic infections and laboratory investigation parameter like CD4 counts were compared against poor adherence. The odds ratio was very high for clinical and lab parameters. Decrease in CD4 counts (OR=20.12), decrease in weight (OR=18.62) and presence of opportunistic infections (OR=12.67) came as most significant predictors of poor adherence in multivariate analysis.
Table 1: Baseline characteristics (n=1000).
Variables N (%)
Gender
Male 539 (53.9)
Female 461 (46.1)
Age in years
18 to 30 351 (35.1)
31 to 40 422 (42.2)
41 to 50 179 (17.9)
51 to 60 41 (4.1)
>60 07 (0.7)
Marital status
Single 39 (3.9)
Married 711 (71.1)
Widower 14 (1.4)
Widow 193 (19.3)
Divorced 43 (4.3)
Literacy status
Literate 429 (42.9)
Illiterate 571 (57.1)
Personal habits
Smokers 320 (32.0)
Alcohol users 347 (34.7)
N= Numbers; (%)=Percentage.
Table 2: Factors influencing adherence to ART.
Variables
Adherence <95% N (%)
Adherence >95% N (%)
Multivariate analysis odd’s ratio
(95% confidence interval) P value
Age group (years)
>40 124 (52.8) 111 (47.2) 1.162 (0.867 to 1.55) 0.352
<40 375 (49 390 (51)
Sex
Female 203 (44) 258 (56) 0.646 (0.503 to 0.830) 0.001*
Male 296 (54.9) 243 (45.1)
Community
Backward class 50 (37.3) 84 (62.7) 0.553 (0.380 to 0.804) 0.002*
Forward class 449 (51.8) 417 (48.2)
Travel distance to ART
>50 kms 123 (63.1) 72 (36.9) 1.94 (1.412 to 2.690) 0.000*
< 50 kms 376 (46.7) 429 (53.3)
Literacy
Illiterate 318 (55.7) 253 (44.3) 1.72 (1.337 to 2.218) 0.000*
Literate 181 (42.2) 248 (57.8)
Marital status
Others 141 (48.8) 141 (51.2) 0.93 (0.715 to 1.235) 0.705
Married 358 (50.4) 353 (49.6)
Occupation
Unskilled 430 (49.8) 433 (50.2) 0.979 (0.682 to 1.403) 0.980
Skilled 69 (50.4) 68 (49.6)
Employment
Variables
Adherence <95% N (%)
Adherence >95% N (%)
Multivariate analysis odd’s ratio
(95% confidence interval) P value
Monthly income
<10000 rupees 451 (49.6) 459 (50.4) 0.860 (0.557 to 1.327) 0.567
>10000 rupees 48 (53.3) 42 (46.7)
Safe Sex
No 304 (45.2) 368 (54.8) 0.563 (0.431 to 0.736) 0.000*
Yes 195 (59.5) 133 (40.5)
WHO clinical staging
Stage 3 & 4 123 (83.7) 24 (16.3) 6.502 (4.114 to 10.276) 0.000*
Stage 1 & 2 376 (44.1) 477 (55.9)
Smoking habit
Yes 192 (60) 128 (40) 1.822 (1.391 to 2.387) 0.000*
No 307 (45.1) 373 (54.9)
Alcohol habit
Yes 199 (57.3) 148 (42.7) 1.582 (1.217 to 2.057) 0.001*
No 300 (45.9) 353 (54.1)
N= Numbers; (%): Percentage ;*: Significant p-value <0.05.
Table 3: Clinical and biochemical parameters influencing adherence.
Variables
Adherence <95% N (%)
Adherence >95% N (%)
Multivariate analysis
OR (95% Confidence Interval) P value
Weight categories
Decreasing 352 (86.1) 57 (13.9) 18.65(13.326 to 26.109) 0.000*
Increasing 147 (24.9) 444 (75.1)
CD4 count category
Decreasing 385 (84.2) 72 (15.8)
Increasing 114 (21) 429 (79) 20.12(14.53 to 27.86) 0.000*
Opportunistic infections
Yes 178 (89.4) 21 (10.6) 12.67(7.89 to 20.35) 0.000*
No 321 (40.1) 480 (59.9)
N= Numbers; (%): Percentage; *: Significant p value<0.05; OR=odds ratio.
DISCUSSION
Our study showed nearly 49.9% had poor adherence. A systematic review and meta-analysis study done by Mhaskar et al on adherence to ART in India showed the pooled adherence rate was only 70%.5 Mhaskar et al study also reflected our study findings of ART adherence levels were below the required levels to have an optimal treatment effect.5
We compared the adherence levels to ART with other studies done in India (Table 4).
Two studies done by Rai et aland Hansana et al showed adherence levels <95% as 43% and 40%, which was almost comparable with our studies poor adherence level of 49.9%.6,7 On the contrary a study done by Anuradha et alfound very low levels of poor adherence equivalent to only 3.2%. While other studies found poor adherence levels of 36.3% and 27%.8-10 The wide differences to poor adherence levels to ART of around 3% to 50% from
previous studies may be attributed to difference in sample size, study settings, the methods used to measure adherence levels and also the time duration for adherence measurements.
Table 4: Comparison of adherence levels to ART from previous studies.
Previous studies Sample size
Adherence >95%
Adherence <95%
Rai et al6 239 57 43
Hansana et al7 346 60 40
Anuradha et al8 250 96.8 3.2
Achappa et al9 116 63.7 36.3
Shah et al10 279 73 27
Present study 1000 50.1 49.9
certain other studies showed a relationship between adherence and CD4 counts.11-13 A study done by Ross-Degnan et al showed that the patients with <80% coverage gained significantly less weight than those who were more adherent.14 A study done by Fonsah et al reported similar findings to our study in terms of opportunistic infections and adherence.15
CONCLUSION
Even though our study showed factors like travel distance to ART, being illiterate, smoking, and alcohol consumption, had significant relation to poor adherence. The odds of developing poor adherence was very high among clinical parameters like current opportunistic infection, decrease in weight and WHO clinical staging and lab parameter like CD4 counts on multivariate logistic regression analysis.
Recommendations
Patients on long term ART with current opportunistic infections, decrease in CD4 counts, decrease in weight and WHO clinical staging 3 and 4 should be suspected for poor adherence and followed up. Counseling related to cessation of smoking and stopping of alcohol consumption to be more emphasized in counseling sessions. The travel distance to ART can be minimized by directing the patients to receive ART from their nearby centres.
Funding: No funding sources Conflict of interest: None declared
Ethical approval: The study was approved by the Institutional Ethics Committee
REFERENCES
1. UNAIDS. Fact Sheet November 2016. Available at:
http://www.unaids.org/en/resources/fact-sheet. Accessed on 15 January 2019.
2. UNAIDS Gap Reort 2016. Available at:
http://www.unaids.org/sites/default/files/media_asse t/2016-prevention-gap-report_en.pdf. Accessed on 15 January 2019.
3. India HIV Estimations 2015. Technical Report. National AIDS Control Organisation & National Institute of Medical Statistics, ICMR, Ministry of Health & Family Welfare. Government of India. Available at: http://www.naco.gov.in/sites/default/ files/India%20HIV%20Estimations%202015.pdf. Accessed on 13 January 2019
4. National AIDS Control Organisation. State fact sheet 2012. Available at: http://naco.gov.in/sites/ default/files/State_fact_sheet_March_2012.pdf. Accessed on 13 February 2017.
5. Mhaskar R, Alandikar V, Emmanuel P, Djulbegovic
B, Patel S, Patel A, et al. Adherence to Antiretroviral Therapy in India: A Systematic
Review and Meta-Analysis. Indian J Community Med. 2013;38(2):74–82.
6. Rai S, Mahapatra B, Sircar S, Raj PY, Venkatesh S, Shaukat M, et al. Adherence to Antiretroviral Therapy and Its Effect on Survival of HIV-Infected Individuals in Jharkhand, India. PLoS ONE. 2013;8(6):1-7.
7. Hansan V, Sanchaisuriya P, Durham J, Sychareun V, Chaleunvong K, Boonyaleepun S, et al. Adherence to Antiretroviral Therapy (ART) among People Living With HIV (PLHIV): a cross-sectional survey to measure in Lao PDR. BMC Public Health. 2013;13:617.
8. Anuradha S, Joshi A, Negi M, Nischal N, Rajeshwari K, Dewan R. Factors Influencing Adherence to ART. New Insights from a Center Providing Free ART under the National Program in Delhi, India. JIAPAC. 2013;12(3):195-201.
9. Achappa B, Madi D, Bhaskaran U, Ramapuram JT,
Rao S, Mahalingam S. Adherence to Antiretroviral Therapy Among People Living with HIV. N Am J Med Sci. 2013;5(3):220-3.
10. Shah B, Walshe L, Saple DG, Mehta SH, Ramnani JP, Kharkar RP, et al. Adherence to Antiretroviral Therapy and Virologic Suppression among HIV-Infected Persons Receiving Care in Private Clinics in Mumbai, India. Clin Infect Dis. 2007;44(9):1235-44.
11. Safren SA, Kumarasamy N, James R, Raminani S,
Solomon S, Mayer KH. ART adherence,
demographic variables and CD4 outcome among HIV-positive patients on antiretroviral therapy in Chennai, India. AIDS Care. 2005;17(7):853-62. 12. Abrogoua DP, Kablan BJ, Kamenan BA, Aulagner
G, N'guessan K, Zohoré C. Assessment of the impact of adherence and other predictors during HAART on various CD4 cell responses in resource-limited settings. Patient Prefer Adherence. 2012;6:227-37.
13. Adiga S, Adiga U, Malawadi BN. Comparison of Adherence and CD4 counts of HIV patients on various ART Regimens. Int J Med Res Rev 2016;4(7):1138-43.
14. Degnan DR, Jacques MP, Zhang F, Tadeg H, Gitau
L, Ntaganira J, et al. Measuring adherence to antiretroviral treatment in resource-poor settings:the clinical validity of key indicators. BMC Health Serv Res. 2010;10:42.
15. Fonsah JY, Njamnshi AK, Kouanfack C, Qiu F, Njamnshi DM, Tagny CT, et al. Adherence to
Antiretroviral Therapy (ART) in
Yaoundé-Cameroon: Association with Opportunistic
Infections, Depression, ART Regimen and Side Effects. PLoS One. 2017;12(1):1-19.
Cite this article as: Raju BN, Anusuya GS, Lakshmi