Original Research Article
Knowledge, attitudes and practices of faculty members' about computer
vision syndrome, Majmaah University, Saudi Arabia
Saad Abbas Aldawsari
1*, Abdullah Ayidh Alotaibi
1, Khalid Mohamed Alabdulwahhab
2,
Elsadig Yousif Mohamed
3, Sharafeldin Abdelmajid
2INTRODUCTION
The use of computers has become universal. Computer technology plays an integral role in our personal, professional and educational lives. With increasing use of computers by young adults in educational institutions as well as at home.1 Today, a condition known as computer vision syndrome (CVS) also referred to as digital eye strain became a health problem. The American Optometric Association defines (CVS) as a group of eye and vision-related problems that result from prolonged
computer, tablet, e-reader and cell phone use.2 CVS is characterized by visual symptoms, which result from interaction with computer display or its environment. In most cases, symptoms occur because the visual demand of the task exceeds the visual abilities of the individual to comfortably perform the task.3 Most common symptoms associated with CVS or digital eye strain are eyestrain, headaches, blurred vision, dry eyes, neck and shoulder pain. These symptoms may be caused by: poor lighting, glare on a digital screen, improper viewing distances, poor seating posture, uncorrected vision problems, a ABSTRACT
Background: Computer vision syndrome (CVS) is a group of eye problems that result from using the computer for a long time, it became a health problem. This syndrome is characterized by several symptoms including eyestrain, headaches and neck pain. The aim of the study was to investigate the knowledge, attitude, and practice of faculty members' about computer vision syndrome, Majmaah University, Saudi Arabia.
Methods: The present study is cross-sectional study, which was conducted in Majmaah city in Sudair area in the north of Riyadh region. The study included faculty members of the College of Medicine and medical science college, Majmaah University.
Results: There were 86 (74.8%) males, and 29 (25.2%) females participated in this study. The mean±SD of years using a computer by participants was 14.78±5.69 years and the mean±SD of hours spent using a computer daily was 5.25±2.2. There were 91.3% knew the bad effects of computer on the eyes, the most common symptoms resulted from long period of using computer were eyestrain 28.7% and headache 14.8%. The mean±SD score of attitude was 67.75±7.72.
Conclusions: There is good knowledge, attitude and practice among faculty members about computer vision syndrome.
Keywords: Computer vision syndrome, Faculty members, Prevalence
1
College of Medicine, Majmaah University, Saudi Arabia
2Department of ophthalmology, College of medicine, Majmaah University, Saudi Arabia
3Department of Community Medicine and Public Health, College of Medicine, Majmaah University, Saudi Arabia
Received: 26 June 2018
Revised: 28 July 2018
Accepted: 30 July 2018
*Correspondence:
Dr. Saad Abbas Aldawsari, E-mail: [email protected]
Copyright: © the author(s), publisher and licensee Medip Academy. This is an open-access article distributed under the terms of the Creative Commons Attribution Non-Commercial License, which permits unrestricted non-commercial use, distribution, and reproduction in any medium, provided the original work is properly cited.
combination of these factors.2 Prevalence of CVS ranges from 64% to 90% among computer users. Nearly 60 million people suffer from CVS globally: A million new cases of CVS occur each year. Although many studies have reported the association between prolonged computer use, poor postures at workstations and various musculoskeletal discomforts, most of them were focused on western adult subjects.4 National Institute of Occupational Safety and Health Survey has reported that visual symptoms occur in 75-90% as opposed to 22% musculoskeletal disorders of video display terminals (VDT) workers.5 In the USA more than 143 million Americans work on a computer each day with an estimated 90% suffering from computer eyestrain. Additionally, almost 90% of children in the USA work on a computer at home or in school every day.6 To diagnose a patient with CVS properly, we must first eliminate other possible causes of discomfort. For example, blurred vision can result from uncorrected refractive error (e.g., hyperopia, myopia and astigmatism), improper prescription lenses or presbyopia. Known muscle disorders such as phoria or tropia may induce eyestrain and headaches. Cataracts or corneal scarring can result in glare symptoms.7 Information technology professionals working in Chennai, the prevalence of CVS was found to be 69.3%.8 In India A study of the knowledge, attitudes and practices of CVS among Ophthalmologists showed that All the doctors who responded were aware of CVS. The chief presenting symptoms were eyestrain (97.8%), headache (82.1%), tiredness and burning sensation (79.1%), watering (66.4%) and redness (61.2%). Ophthalmologists using computers reported that focusing from distance to near and vice versa, blurred vision at a distance and blepharospasm formed part of the syndrome.9
The objectives of the current study were to determining the knowledge, attitudes and practices of faculty members' about computer vision syndrome.
METHODS
This was an institutional based, cross-sectional study conducted to assess the level of knowledge, attitude and practice in Majmaah University among faculty members of the College of Medicine and medical science college, in March 2017 to march 2018. Majmaah University ethics committee approved the study design. We selected about 197 computer users according the following inclusion criteria. Continuous use of the computer for at least 1 year. Using of the computer every day for at least 2 hours (except official holidays). Exclusion criteria are anyone having symptoms or signs of CVS before computer using and anyone with ocular disease (i.e. glaucoma, conjunctivitis). The study population included both male and female adults.
A research questionnaire was prepared after reviewing the articles available on computer vision syndrome. The questionnaire included (i) demography details, (ii)
spectacles use, (iii) computer use, (iv) symptoms of computer vision syndrome, (v) any measures practiced to prevent eye problems, (vi) use of radiation filter, and (vii) lighting in the room (viii) computer attitude scale. Data collected in questions (iii) and (iv) provide information on knowledge, in questions (v), (vi) and (vii) provide information on practices and (viii) provide information on attitude of computer use.
The questionnaire was delivered to the faculty members in the office clocks. The research objectives were explained to each participant separately. The questionnaires distributed in this study showed no personal identifiers and so the confidentiality of participants was maintained. Of the 197 questionnaires distributed, 115 responded.
The data was analyzed with the help of Microsoft excel and SPSS version 17. The descriptive data were presented as percentages, unadjusted odds ratio to measure the strength of association and 95% confidence interval were calculated. The chi-square test of significance was used for analyses of categorical variables.
RESULTS
practice of participants. Regarding knowledge, there were 105 (91.3%) knew that the prolonged use of computer had bad effects on the eye, participants reported experiencing several symptoms (Figure 1) and mentioned the most common symptoms they experienced (Figure 2), the mean±SD of duration of using computer that made individuals experience any of the symptoms was 3.89±2.13 hours with a range of 1-5 hours.
The second part of questions was about practice, and it involves three questions. Most of participants 94 (81.7%) take breaks in between using of computer to relieve or prevent the symptoms that they may suffer, 69 (60%) of them mentioned that the computer screen was at the eye level, and 74 (64.3%) used fluorescent light in the room where they use their computers, Table 1.
Figure 1: Prevalence of symptoms experienced by participants.
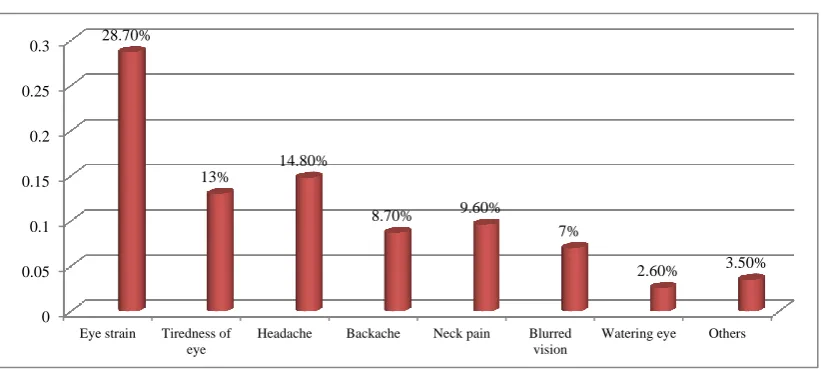
Figure 2: The most distressed symptoms among individuals.
Table 1: The frequency and percent of individuals' answers about their practice.
Questions N %
Do you practice any of the following measures to prevent/ relieve the experienced symptoms
Looking at far objects in between use 35 30.4
Taking breaks in between use 94 81.7
Massage of eyes 27 23.5
Use of eye drops 4 3.5
Use of radiation filter on the 9 7.8
What level is your computer screen during work
Above the eye level 2 1.7
At the eye level 69 60.0
Below the eye 44 38.3
What type of lighting is used in the room?
Fluorescent light 74 64.3
Natural light 41 35.7
0.00% 10.00% 20.00% 30.00% 40.00% 50.00% 60.00%
40.90% 51.30%
11.30% 16.50%
27.80%
10.40% 33%
2.60% 40%
35.70% 48.70%
20.90% 12.20%
0 0.05 0.1 0.15 0.2 0.25 0.3
Eye strain Tiredness of eye
Headache Backache Neck pain Blurred vision
Watering eye Others
28.70%
13%
14.80%
8.70% 9.60%
7%
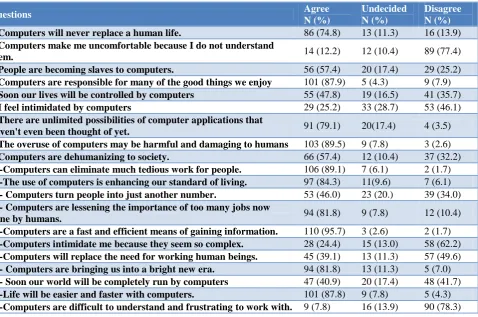
Table 2: Attitude questions with percent of answers to each question.
Questions Agree
N (%)
Undecided N (%)
Disagree N (%)
1-Computers will never replace a human life. 86 (74.8) 13 (11.3) 16 (13.9)
2-Computers make me uncomfortable because I do not understand
them. 14 (12.2) 12 (10.4) 89 (77.4)
3-People are becoming slaves to computers. 56 (57.4) 20 (17.4) 29 (25.2)
4-Computers are responsible for many of the good things we enjoy 101 (87.9) 5 (4.3) 9 (7.9)
5-Soon our lives will be controlled by computers 55 (47.8) 19 (16.5) 41 (35.7)
6-I feel intimidated by computers 29 (25.2) 33 (28.7) 53 (46.1)
7-There are unlimited possibilities of computer applications that
haven't even been thought of yet. 91 (79.1) 20(17.4) 4 (3.5) 8-The overuse of computers may be harmful and damaging to humans 103 (89.5) 9 (7.8) 3 (2.6)
9-Computers are dehumanizing to society. 66 (57.4) 12 (10.4) 37 (32.2)
10-Computers can eliminate much tedious work for people. 106 (89.1) 7 (6.1) 2 (1.7)
11-The use of computers is enhancing our standard of living. 97 (84.3) 11(9.6) 7 (6.1)
12- Computers turn people into just another number. 53 (46.0) 23 (20.) 39 (34.0)
13- Computers are lessening the importance of too many jobs now
done by humans. 94 (81.8) 9 (7.8) 12 (10.4)
14-Computers are a fast and efficient means of gaining information. 110 (95.7) 3 (2.6) 2 (1.7)
15-Computers intimidate me because they seem so complex. 28 (24.4) 15 (13.0) 58 (62.2)
16-Computers will replace the need for working human beings. 45 (39.1) 13 (11.3) 57 (49.6)
17- Computers are bringing us into a bright new era. 94 (81.8) 13 (11.3) 5 (7.0)
18- Soon our world will be completely run by computers 47 (40.9) 20 (17.4) 48 (41.7)
19-Life will be easier and faster with computers. 101 (87.8) 9 (7.8) 5 (4.3)
20-Computers are difficult to understand and frustrating to work with. 9 (7.8) 16 (13.9) 90 (78.3) Table 3: The correlation between attitude score and different variables.
Variables Mean SD P value
Sex Male 69.04 7.81 0.002*
Female 63.93 6.07
College Medical college 68.03 6.70 0.671
Medical science college 67.41 8.89
Age (in years)
23-35 70.09 8.28
0.077
36-45 67.35 7.76
46-60 65.65 6.27
Academic degree
Professor 68.00 4.00
0.801
Assistant professor 68.21 7.88
Associated 67.35 7.37
Assist lecturer 66.33 8.11
Wearing glasses No 67.36 7.94 0.644
Yes 68.04 7.60
The last section of the questionnaire was attitude section, which included 20 questions to investigate the attitude of participants, Table 2 summarize the percent of each answer of participants about each question. We used a scoring system to evaluate the attitude of participants, the range of attitude scores was 52 to 89 with a mean±SD was 67.75±7.72.
The only significance was found regarding attitude was between the two genders (p=0.002), where males had more attitude than females. College, age, academic
degree and wearing glass were not factors affecting attitude, Table 3.
Also, hours of computer use per day, years of using computer and duration of wearing glasses were not significantly correlated to attitude, where p˃0.05.
DISCUSSION
glasses. The mean duration for using a computer was 14.78 years and the mean duration of using computer per day was 5.25 hours. The participants in this study were from different academic degrees; assistant, associated professors, teaching assistants and professors, this reflects the increase in the duration of using a computer. The individuals have scientific work that should be performed by using a computer, so spending long duration using computer is necessary. In Nigerian study on computer users in the workplace, it was found that employees used computers for long time ranged between 1 and more than eight h per day.6The knowledge of participants about the prolonged use of computer had bad effects on the eye was very good, as 91.3% knew that while 8.7% didn’t know, this can be explained by the fact that the participants were of high education and high academic degrees. A previous study in Malaysian students showed that 51.2% of participants had good level of knowledge.10 Lower percent was recorded in another study, where 27% only of respondents had good knowledge.6 51.3% of individuals suffered tiredness of eye, 48.7% suffered neck pain, 40.9% experienced eye strain and 40% complained headache, while 2.6% only suffered double vision. The most common symptoms experienced by participants were eyestrain representing 28.7% followed by headache 14.8%, while the least common symptom was watering aye 2.6%. The mean hours required for any of the previous symptoms to appear was 3.89 hours. Iwakiri et al reported that 72.1% of office workers suffered eyestrain and pain, while Sen and Richardson found that 46-87% of different eye symptoms were experienced by the individuals of their study.11,12 Several studies found that the most common symptoms were both eye strain and burning sensation in the eyes.13-15A study from Nigeria on computer users in workplace showed that eyestrain and headache were experienced equally by 30.94%, for each, while the least symptom was redness which experienced by4.31%.6 Another study showed that there were 97.8% and 82.1% of participants experienced eyestrain and headache respectively.9 Also, Chiemeke et al revealed that eyestrain was the most common symptoms experienced by computer users, however they reported other various symptoms including headache, double vision, blurred distance vision and redness of eyes.16 Another study on Malaysian students showed that headache and eyestrain represented 19.7% and 16.4% respectively among experienced symptoms, while discomfort and double vision represented the least common symptoms with rates of 1.1% and 0.3% respectively.11 By assessing the practice of individuals in this study, it was found that the large majority 81.7% take breaks in between using computer to prevent these symptoms, while 3.5% only used eye drops. In a previous study, it was found that 75% of students of the study take break every hour of working on computer, and the authors of the study reported that the students who didn’t take breaks were under risk of developing CVS.4 In Nigerian study there were 32% took regular breaks, 5.6% practiced blinking frequently, 31.2% checking eyes regularly and 31.2% used glare screen on the computer.6
It was demonstrated that taking short breaks very hour for 5 min, showed a decrease in eye discomfort.17 Also, several studies recommended taking breaks to avoid CVS.18,19 Most of our participants 60% reported that they place the computer screen during work at the eye level, while 38.3% used it below the eye level and the least percent 1.7% used it above the eye level. A study was performed on undergraduate students in Chennai, revealed that 61% of students place computer screen at the same level of their eyes, 10% place it above and third of them need to look downward as they place it below the level of their eyes.4 64.3% of individuals in this study used fluorescent light in the room they used. The mean score of attitude of participants was 67.75 representing good attitude. In Malaysian study, it was found that 52.3% of participants had good attitude. Also, we found that gender was a significant factor affecting attitude (p=0.002) and males tended to have more attitude than females. However, the Malaysian study showed no significance difference between the two genders regarding attitude.10 In the current study, there was no significant difference in attitude score regarding college, age, academic degree, wearing glasses, hours of computer used per day, years of using computer or duration of wearing glasses. In Malaysian study, it was found that age and educational level weren’t significantly affecting the attitude.10
CONCLUSION
The individuals in this study were using the computer for long periods. They have good knowledge, practice, and attitude. The most common symptoms of participants were eyestrain and headache, and most of them take breaks to avoid the experience of these symptoms. Gender was the only variable related to the attitude with higher attitude score observed for males.
ACKNOWLEDGEMENTS
I would like to express my thanks to all faculty members of the College of Medicine and medical science college, Majmaah University for their unlimited sup.
Funding: No funding sources Conflict of interest: None declared
Ethical approval: The study was approved by the Institutional Ethics Committee of the Basic Health Research Centre of Majmaah University
REFERENCES
1. Logaraj M, Madhu Priya V, Seetharaman N, Hedge SK. Practice of ergonomic principles and computer vision syndrome (CVS) among undergraduates students in Chennai. National J Med Res. 2013;3:111-6.
public/caring-for-your-vision/protecting-your-vision/computer-vision-syndrome?sso=y. Accessed on 03 November 2017.
3. Mussa A. Computer Vision Syndrome. Adv Ophthalmol Vis Syst. 2016;4(3):00110.
4. Logaraj M, Madhupriya V, Hegde SK. Computer Vision Syndrome and Associated Factors Among Medical and Engineering Students in Chennai. AMHSR. 2014;14:179-85.
5. Raja AM, Janti S, Matheen A, Chendilnathan C, Ramalingam P. Cross-sectional questionnaire study of ocular effects among IT professionals who use computers. International J Med Public Health. 2015;5(1):63-6.
6. Akinbinu TR, Mashalla YJ. Knowledge of computer vision syndrome among computer users in the workplace in Abuja, Nigeria. JPP. 2013;4:58-63. 7. Abelson MB, George W. Ousler III BS. How to
Fight Computer Vision Syndrome. Review Ophthalmol. 1999;114-6.
8. Arumugam S, Kumar K, Subramani R, Kumar S. Prevalence of Computer Vision Syndrome among Information Technology Professionals Working in Chennai. World J Med Sci. 2014;11:312-3.
9. Bali J, Navin N, Thakur BR. Computer vision syndrome: A study of the knowledge, attitudes and practices in Indian Ophthalmologists. Indian J Ophthalmol. 2007;55:289-94.
10. Amirul FZ, Aqilah R, Lee ML, Azuhairi AA, Isa MM. Knowledge, Attitude, and Practice of Computer Vision Syndrome among Staffs that use Video Display Terminal in a Faculty of a Malaysian Public University. International J Public Health Clin Sci. 2015:2(1):137-47.
11. Iwakiri K, Mori I, Sotoyama M, Horiguchi K, Ochiai T, Jonai H, et al. Survey on Visual and Musculoskeletal Symptoms in VDT Workers. J Occupational Health. 2004;46(6):201-12.
12. Sen A, Richardson S. A study of computer-related upper limb discomfort and computer vision syndrome. J Human Ergol. 2007;36:45-50.
13. Al Rashidi SH, Alhumaidan H. Computer vision syndrome prevalence, knowledge and associated factors among Saudi Arabia University Students: Is it a serious problem? International J Health Sci. 2017;11(5):17-9.
14. Barar A, Apatachioaie ID, Apatachioaie C, Marceanu-Brasov L. Ophthalmologist and ‘computer vision syndrome. Oftalmologia. 2007;51:104-9.
15. Eichenbaum JW. Computers and eyestrain. J Ophthalmic Nurs Technol. 1996;15:23-6.
16. Chiemeke SC, Akhahowa AE, Ajayi OB. Evaluation of vision-related problems amongst computer users: a case study of University of Benin, Nigeria. Proceedings of the World Congress on Engineering, London, U.K.; 2007.
17. Saurabh R, Shrivastava, Bobhate PS. Computer related health problems among software professionals in Mumbai: A cross-sectional study. Int J Health Sci. 2012;1(2):74-8.
18. Taptagaporn S, Sotoyama M, Saito S, Suzuki T, Saito S. Visual comfort in VDT workstation design. J Hum Ergol (Tokyo). 1995;24:84–8.
19. Galinsky TL, Swanson NG, Sauter SL, Hurrell JJ, Schleifer. A field study of supplementary rest breaks for data-entry operators. Ergonomics. 2000;43:622– 38.
Cite this article as: Aldawsari SA, Alotaibi AA, Alabdulwahhab KM, Mohamed EY, Abdelmajid S. Knowledge, attitudes and practices of faculty