Original Research Article
Detection of biofilm formation by
Escherichia coli
with
its antibiogram profile
Gaurab Risal
1*, Aayush Shrestha
1, Saroj Kunwar
2, Gajal Paudel
1,
Rameshwor Dhital
1, Man Bahadur Budha
1, Rupa Nepal
1INTRODUCTION
Biofilm can generally be defined as a group of microbes’ cell attached to each other and then these cells get to adhere to a surface with the help of self-produced matrix. The Biofilm can be formed on both living and non-living surfaces.1,2 It is said that the formation of the biofilm begins with the attachment of free-floating microorganisms to the surface. It is also thought that the first adherence to the surface is reversible via Van der Waals force and hydrophobic effects.3,4 Then, if not separated immediately, the adherence will become permanent. The major feature of these aggregated colonies as a biofilm is being increasingly resistant to
antibiotics.5 Gram-negative bacteria as Escherichia coli, Klebsiella pneumoniae, Proteus mirabilis, and Pseudomonas aeruginosa are commonly involved in biofilm formation in case of Urinary tract infections (UTIs). UTIs are considered as one of the most important causes of being diseased and health care problems affecting persons of all ages, mostly including young women, children, and the elderly. It is roughly calculated that approximately 40% of women have had a UTI at some time in their life.6 Various methods to detect biofilms used in various researches involving biofilms are TCP, TM, and CRA.7-9 TCP method is considered as gold standard.7,10,11
ABSTRACT
Background: In urinary tract infections, an important role is played by bacterial biofilms which are responsible for persistence infections together with the antimicrobial resistance. Higher resistance can be seen in biofilm forming uropathogens in comparison with free-floating bacteria. So, the present study was performed with a goal to find the prevalence of biofilm formation and also the antimicrobial resistant pattern of uropathogens.
Methods: A descriptive method was conducted at Modern Technical College, Sanepa, Lalitpur in samples isolated from UTI suspected patients. The overall duration of this study was approximately 3 months. Total of 50 isolated E. coli was tested for biofilm formation and antimicrobial susceptibility testing was done by Kirby-Bauer disc diffusion method on Mueller Hinton agar as per CLSI guidelines.
Results: From the 50 isolates of E. coli, 32 were biofilm producers (3 strong and 29 moderate) and 18 were weak/non-biofilm producers. Among the biofilm producers, cefotaxime was more resistant in 20 of the isolates followed by ceftriaxone in 16 and amoxyclav in 13, whereas amikacin was least resistant in 2 of the isolates.
Conclusions: Among the isolated E. coli, biofilm-forming isolates showed higher antimicrobial resistance as compared to the non-biofilm producer. Thus, uropathogen should be routinely screened for biofilm formation.
Keywords: Uropathogen, UTI, Biofilm formation, Antimicrobial resistance pattern
1
Department of Microbiology, 2Department of Biochemistry, Modern Technical College, Lalitpur, Nepal
Received: 20 June 2018
Accepted: 27 July 2018
Accepted: 30 July 2018
*Correspondence:
Dr. Gaurab Risal,
E-mail: [email protected]
Copyright: © the author(s), publisher and licensee Medip Academy. This is an open-access article distributed under the terms of the Creative Commons Attribution Non-Commercial License, which permits unrestricted non-commercial use, distribution, and reproduction in any medium, provided the original work is properly cited.
So, we have used this method in our study. The main motive of our study is to study the biofilm types produced by isolated E. coli from the urine sample and their antibiogram profile. Biofilms are currently estimated to be responsible for over 65% of nosocomial infections and 80% of all microbial infections.12 The level of resistance is according to the stage of biofilm. Antibiotics can work most effectively in the reversible attachment step because the bacteria have not connected themselves in the matrix. Due to this, they are at risk to the action of antibiotics and immune system of the host.13 This might be helpful in the treatment of various patients suffering from UTI.
METHODS
A descriptive research design was used to detect biofilm produced by uropathogen and its antibiogram profile. The samples were collected from Star Hospital, Sanepa height, Lalitpur. The study was carried out at Modern Technical College. The study population was urinary tract infected patients and we have limited our study in preserved E. coli isolates in the last three months only from October 2016 to December 2016.
Inclusion criteria
Preserved E. coli isolates of Urinary tract infected patients were included for study.
Exclusion criteria
Preserved samples with mixed growth were not included; uropathogens other than E. coli were excluded.
Laboratory procedure
The following procedure was performed in the laboratory during the study period to obtain the required result. The procedure was done according to the research of O'Toole et al.14
Sample selection and transportation
Among the preserved samples of uropathogens in the Star Hospital, the isolated E. coli bacteria were selected for the study. The selected bacteria were transferred in the preserved form to the study site, which is Modern Technical College.
Emulsification of bacteria in media for growth
One loopful of the bacterial colony from the Mac-Conkey agar was taken and emulsified in 10 ml of TSB. The emulsified colony at 37˚C was incubated in an incubator for 24hrs.
Biofilm detection (by TCP method)
For biofilm detection, 10 µl of emulsified bacteria from TSB was added in 1 ml of freshly prepared TSB. 200 µl
diluted sample was put in a plain microtiter plate and incubate at 37˚C for 24 hrs in an incubator. Non emulsified TSB media were taken as negative control. Next day, microtiter plate was shaken and all the free cells from the microtiter were dumped out gently. Then, microtiter plate was washed 4 times by phosphate buffer to remove the unattached cells and left for 30 minutes to dry in an incubator. After that, 250 µl of 0.1% crystal violet was added tn a microtitre plate and incubated at room temperature for 10 minutes. It was washed 3 times by buffer and incubated at incubator overnight turning microtiter plate upside down. Next day, 250 µl of acetone was added in a microtiter plate to solubilize crystal violet taken by the biofilms if present. The microtiter plate was covered with aluminum foil and shaken in a shaker. 250 µl of solubilized crystal violet was transferred to a new microtiter plate. Optical Density of solution was taken at 570 nm in ELISA reader. The interpretation of biofilm production was done according to the criteria of Stepanovic et al.15
AST
AST was performed in the isolates by Kirby Bauer disc diffusion as recommended by CLSI, which is described as follows.16
For the inoculation of the MHA plates, dipping a sterile swab was dipped into the bacteria cultured in TSB. Excess inoculums were removed by pressing and rotating the swab firmly against the side of the tube above the level of the liquid. The swab was streaked all over the surface of the medium three times, rotating the plate through an angle of 60˚ after each application. The swab was passed around the edge of the agar surface. The inoculums were left to dry for a few minutes. The appropriate 6 antimicrobial-impregnated disks were placed on the surface of the agar Antimicrobial discs can be placed on the inoculated plates using a pair of sterile forceps. Discs should not be placed closer than 24 mm (center to center) on the Mueller Hinton agar plate. Each disc was gently pressed down to ensure complete contact with the agar surface and do not fall when the plate is inverted during incubation. The plates were placed in an incubator at 37˚C. After overnight incubation, the diameter of each zone (including the diameter of the disc) was measured and recorded in mm. The results should then be interpreted according to the antimicrobial susceptibility interpretation chart. The measurements were made by a ruler on the under-surface of the plate without opening the lid.
RESULTS
are found to be more sensitive to Amikacin (49 out of 50, 98%) and bacteria are more resistant to Cefotaxime (27 out of 50, 54%).
The interpretation of biofilm production was done according to the criteria of Stepanovic et al which is shown in Table 1.15
Table 1: Interpretations of biofilm production.
Average OD value Biofilm production
ODc< - ≤ 2×ODc Non/weak
2× ODc< - ≤ 4×ODc Moderate
>4× ODc Strong
Optical density cut-off value (ODc) = average OD of negative control + 3 × standard deviation (SD) of negative control. The result is shown in Table 2.
Table 2: Distribution of isolates on the basis of biofilm production.
Biofilm types No. of samples
Strong 3
Moderate 29
Weak/Non 18
Total 50
Also, after performing AST of each isolate, the antibiogram profiles of each isolate can be known and separated for strong, moderate & weak/non-biofilm producers each.
The interpretative zone diameter of used antibiotics is listed in Table 3. Antibiogram profile of strong biofilm producers is shown in Table 4.
Table 3: The interpretative zone diameter of antibiotics (in mm).
Serial No. Antibiotics Sensitive Resistant Intermediate
1 Cefepime 24 21 22-23
2 Cefotaxime 26 22 23-25
3 Ceftriaxone 23 20 21-22
4 Levofloxacin 22 19 20-21
5 Nalidixic Acid 19 13 14-18
6 Amikacin 16 13 14-15
7 Amoxyclav 19 19 14-17
Table 4: Antibiogram profiles of strong biofilm producers.
Susceptibility antibiotic Sensitive Intermediate Resistant Total
Amikacin 3 3
Amoxyclav 1 1
Cefepime 2 1 3
Ceftriaxone 2 1 3
Cefotaxime 1 1 1 3
Levofloxacin 2 1 3
Nalidixic acid 1 1 2
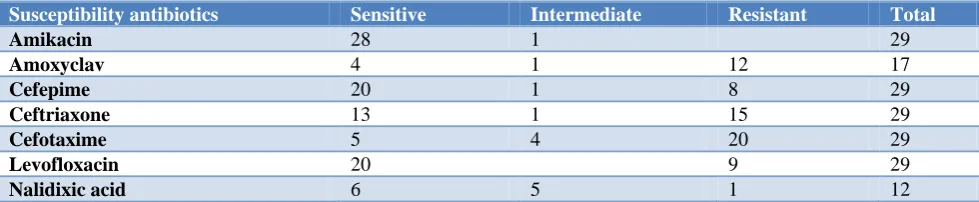
Table 5: Antibiogram profile of moderate biofilm producers.
Susceptibility antibiotics Sensitive Intermediate Resistant Total
Amikacin 28 1 29
Amoxyclav 4 1 12 17
Cefepime 20 1 8 29
Ceftriaxone 13 1 15 29
Cefotaxime 5 4 20 29
Levofloxacin 20 9 29
Nalidixic acid 6 5 1 12
Antibiogram profile of moderate biofilm producers is shown in Table 5.
Antibiogram profile of weak/non-biofilm producers is shown in Table 6.
Again, we can see in Table 5 that 28 out of 29 (97%) moderate biofilm producers are sensitive to Amikacin.
Also, 12 out of 17 moderate biofilm producers (71%) are resistant to Amoxyclav and 20 in 29 (69%) are resistant to cefotaxime.
Table 6: Antibiogram profile of weak/non-biofilm producers.
Susceptibility antibiotics Sensitive Intermediate Resistant Total
Amikacin 18 18
Amoxyclav 10 6 16
Cefepime 15 3 18
Ceftriaxone 14 4 18
Cefotaxime 6 6 6 18
Levofloxacin 13 3 2 18
Nalidixic acid 1 1 2
Also, in Table 6, all 18 out of 18 weak/non-biofilm producers are sensitive to Amikacin and 15 of 18 (83%) are also sensitive to Cefepime. 6 out of 16 (38%) and 6 out of 18 (33%) are sensitive to Amoxyclav and Cefotaxime respectively.
DISCUSSION
E. coli is the most frequent cause of urinary tract infections. There are several virulence factors in UPEC isolates that increase their ability to colonize and persist in the urogenital tract. An important virulence factor in various pathogenic bacteria causing human UTI is the biofilm formation according to the study conducted by Jabalameli et al.17 Urinary tract infections are among the most common bacterial diseases worldwide which involve (infects) about 250 million people in developing countries annually.18,19 Uropathogenic E. coli on its own account for 70-90% of the UTI infections and their susceptibility patterns against different antibiotics vary in different geographical regions.19,20 Bacterial biofilms are most of the time associated with long-term persistence of bacteria in various environmental conditions. Bacteria in biofilm display dramatically increased resistance to antibiotics.21,22
From the given study performed by us, out of 50 isolates, 32 were biofilm producers (3 strong and 29 moderate) and 18 were none or weak biofilm producers. Among the biofilm producers, cefotaxime was most resistant in 20 of the isolates followed by ceftriaxone in 16 and amoxyclav in 13, whereas amikacin was least resistant in 2 of the isolates.
We found out that the biofilm either strong or moderate producing bacteria were found to be more resistant to the antibiotics in comparison to the weak or non-biofilm producing bacteria. But also, in some of the cases, strong biofilm producers are less resistant than some of the weak biofilm producers. So, it is not completely necessary for the biofilm producers to be resistant.
From the study carried out by Hassan et al the percentage of isolates forming strong or moderate biofilm was 64.7%
and weak/non-biofilm was 36.3% among a total of 110 isolates.18
ElaheTajbakhsh et al performed the study in biofilms detection by CRA method, which also focuses on the antibiotics susceptibility pattern of the isolates.23 The resistance shown to ampicillin (87.5%) was maximum among the biofilm forming bacterial strains, which is followed by tetracycline (75%), nalidixic acid (72.5%) and co-trimoxazole (71.25%). All bacteria including both biofilm producers and non-producers were highly resistant to ampicillin, then to tetracycline followed by nalidixic acid. Against nitrofurantoin, 93.75% and 98% sensitivity was noticed for biofilm and non-biofilm producers respectively.
The results of the present and previous study demonstrated that the biofilm producing bacteria are low or high in number according to the various clinical conditions, geographical regions, and other factors. It also shows that high resistivity is shown by the biofilm producers than none producers, but it is not necessarily for each biofilm producers to be resistant to the antibiotics.
CONCLUSION
From the above study, we differentiated the biofilm producing E. coli into strong, moderate, weak or non-biofilm producers. Also, we can conclude that non-biofilm producing bacteria are more resistant to the antibiotics. Among the biofilm producers, cefotaxime was most resistant in 20 of the isolates followed by ceftriaxone in 16 and amoxyclav in 13 whereas, amikacin is more sensitive in all biofilm producing isolates, followed by cefepime in 20 of the isolates. From this study, we found out that the biofilm producing bacteria are comparatively more resistant to the antibiotics but it is not necessary to be biofilm producer to become antibiotic resistant.
ACKNOWLEDGEMENTS
thanks go to administration, teachers, lab helper of Modern Technical College for providing the opportunity to carry out this research work.
Funding: Modern Technical College as this research was carried out as the academic research included in the BSc. MLT programme of Pokhara University
Conflict of interest: None declared
Ethical approval: The study was approved by the Institutional Ethics Committee by the Pathology Department of Star Hospital
REFERENCES
1. Hall-Stoodley L, Costerton JW, Stoodley P. Bacterial biofilms: From the Natural environment to infectious diseases. Nature Rev Microbiol. 2004;2(2):95-108.
2. Lear G, Lewis GD, eds. Microbial Biofilms: Current Research and Applications. Caister Academic Press; 2012.
3. Briandet R, Herry J, Bellon-Fontaine M. Determination of the van der Waals, electron donor and electron acceptor surface tension components of static Gram-positive microbial biofilms. Colloids and Surfaces B: Biointerfaces. 2012;21(4):299-310. 4. Takahashi H, Suda T, Tanaka Y, Kimura B. Cellular
hydrophobicity of Listeria monocytogenes involves initial attachment and biofilm formation on the surface of polyvinyl chloride. Letters Appl Microbiol. 2010;50:618-25.
5. Lewis K. Riddle of Biofilm Resistance. Antimicrob Agents Chemother. 2001;45(4);999-1007.
6. Kunin CM. Urinary tract infections in females. Clin Infect Dis. 1994;18:1–12.
7. Christensen GD, Simpson WA, Younger JJ, Baddour LM., Barrett FF, Melton DM, et al. Adherence of coagulase-negative staphylococci to plastic tissue culture plates: a quantitative model for the adherence of staphylococci to medical devices. J Clin Microbiol. 1985;22(6):996-1006.
8. Christensen GD, Simpson WA, Bisno AL, Beachey EH. Adherence of Slime-Producing Strains of Staphylococcus Epidermidis to Smooth Surfaces. Infect Immun. 1982;37(1):318-26.
9. Freeman DJ, Falkiner FR, Keane CT. New method for detecting slime production by coagulase negative staphylococci. J Clin Pathol. 1989;42(8):872–4.
10. Panda PS, Chaudhary U, Dube SK. Comparison of four different methods for detection of biofilm formation by uropathogens. Indian J Pathol Microbiol. 2016;59(2):177-9.
11. Mathur T, Singhal S, Khan S, Upadhyay DJ, Fatma T, Rattan A. Detection of biofilm formation among the clinical isolates of staphylococci: an evaluation of three different screening methods. Indian J Med Microbiol. 2006;24(1):25-9.
12. Römling U, Balsalobre C. Biofilm infections, their resilience to therapy and innovative treatment strategies. J Intern Med. 2012;272(6):541-61. 13. Stowe SD, Richards JJ, Tucker AT, Thompson, R.,
Melander C, Cavanagh J. Anti-Biofilm Compounds Derived from Marine Sponges. Mar Drugs. 2011;9(10):2010–35.
14. O’toole GA. Microtiter Dish Biofilm Formation Assay. J Vis Exp. 2011;(47):2437.
15. Stepanović S, Vuković D, Hola V, Bonaventura GD, Djukić S, Cirković I, et al. Quantification of biofilm in microtiter plates: Overview of testing conditions and practical recommendations for assessment of biofilm production by staphylococci. Apmis 2007;115(8):891-9.
16. CLSI. M100-S25 performance standards for antimicrobial susceptibility testing; Twenty-fifth informational supplement; 2015.
17. Jabalameli F, Mirsalehian A, Khoramian B, Aligholi M, Khoramrooz SS, Asadollahi P, et al. Evaluation of biofilm production and characterization of genes encoding type III secretion system among Pseudomonas aeruginosa isolated from burn patients. Burns. 2012;38(8):1192-7.
18. Hassan A, Usman J, Kaleem F, Omair M, Khalid A, Iqbal M. Evaluation of different detection methods of biofilm formation in the clinical isolates. Braz J Infect Dis. 2011;15(4):305-11.
19. Ronald AR, Nicolle LE, Stamm E, Krieger J, Warren J, Schaeffer A. et al. Urinary tract infection in adults: Research priorities and strategies. Int J Antimicrob Agents. 2001;17:343–8.
20. Gupta K, Hooton TM, Stamm WE. Increasing Antimicrobial Resistance and the Management of Uncomplicated Community-Acquired Urinary Tract Infections. Ann Internal Med. 2001;135(1):41. 21. Graham JC, Galloway A. ACP Best Practice No
167: The laboratory diagnosis of urinary tract infection. J Clin Pathol. 2001;54(12):911-9.
22. Tayal RA, Baveja SM, De AS. Analysis of biofilm formation and antibiotic susceptibility pattern of uropathogens in patients admitted in a tertiary care hospital in India. Int J Health Allied Sci. 2015;4:247-52.
23. Tajbakhsh E, Ahmadi P, Abedpour-Dehkordi E, Arbab-Soleimani N, Khamesipour F. Biofilm formation, antimicrobial susceptibility, serogroups and virulence genes of uropathogenic E. coli isolated from clinical samples in Iran. Antimicrob Resist Infect Control. 2016;5:11.