International Journal of Integrated Engineering (Issue on Electrical and Electronic Engineering)
37
Design and Development of a portable Pulse
Oximetry system
Mohamed A. Zaltum a, b, M. Shukri Ahmad a, Ariffuddin Joret c and M. Mahadi Abdul Jamil a, b*
a Department of Electronic Engineering, b Modelling and Simulation Research Laboratory,
c Department of Communication Engineering,
Faculty of Electrical & Electronic Engineering, University Tun Hussein Onn Malaysia, Batu Pahat 86400, Johor, Malaysia
*Corresponding email: [email protected]
Abstract
Heart is the most important part in human body. Thus, it is important to follow-up and monitor its condition. Heart rate (HR) and blood oxygen saturation (SpO2) are important indicators directly related to heart-pulmonary system. Monitoring of HR and SpO2 offers us a good indication of heart functionality. Therefore, it is crucial to design and develop a homemade inexpensive device for measuring HR and SpO2. Pulse Oximeter (PO) is an opto-electronic non-invasive medical instrument capable of measuring and recording the changes of HR and SpO2 at the finger tip. In this paper we will demonstrate the overall process involved in the development of a portable (PO) system which can be used for health condition monitoring or for educational and research purposes.
1. INT
Pulse o principle flow rat and de hemoglo different light, an in tissue each he becomes capillari oximetry blood fr Usually, different the tiss deoxyge absorban different hemoglo infrared deoxyge absorban nm). Th use 940 emitting absorpti deoxyge
Fig 1. T deoxyg
When some lig
TRODUCTIO
oximetry sy es related to e in the cont eoxy-hemogl
obin and t in their abs nd that the v e changes a eartbeat, the s larger bef ies. This cha y system to rom all other , in a pulse t wavelength ue [1]. Sin enated hem nce and re t light sour obin has the
band enated hemo
nce in the r his is why m
0 nm infrare g diodes [1
on levels enated blood
The absorptio genated bloo
light is em ght will be ab
ON
ystems are the characte text of the o lobin status
deoxy-hem sorption of r volume of the as the pulse e volume o fore the blo ange makes p o differentia
r absorbing oximeter, t hs are trans nce both ox moglobin h
eflectance p rces are use e highest abs (850nm-100 oglobin (Hb red band (6 most present p
ed and 660 1]. Figure
of oxy at different
on levels of o od at differen
[2]
mitted into th bsorbed by t
based on t eristic of blo oxy-hemoglo
s. Both o moglobin red and infra
e arterial blo changes. W of the arter ood enters possible for ate the arter
substances [ two lights w smitted throu xygenated a have differ properties, t ed. Oxygena sorbance in 00nm), wh
b) has a h 600 nm to 7
pulse oximet 0 nm red li 1 shows ygenated a
wavelengths
oxygenated a nt wavelength
he body tiss the skin, bon
38 two ood obin xy-are ared ood With ries the the rial [1]. with ugh and rent two ated the hile high 750 ters ight the and s. and hs sue, nes, direct receiv pulsat diasto in ligh of the are sh Fi
2. M
Fig op Puls (senso and al S
t current (D ved at the p
tile flow in ole and systo ht intensity. e signal [3]. B hown in Figu
ig 2. Diagram throug
MATERIALS
g 3. Block di peration for t
se Oximeter or), signal-p lso a results d SENSO R LCD display DC) compone photo detect arteries and ole will crea This will pro Both AC and ure 2.
m showing lig gh living tiss
S AND MET
iagram show the Pulse Ox
r system con rocessing un displaying u
AMP
PR
ent of the s tor receiver. d arterioles d ate some var oduce the AC d DC compo
ght absorptio ue [3]
THODS
wing the flow ximetry syste
nsists of a nit (main de
International Journal of Integrated Engineering (Issue on Electrical and Electronic Engineering)
39
2.1 Sensor of Pulse Oximetry
Fig 4. Sensor orientation for light transmittance in the designed pulse oximeter [4]
The newly designed low-cost Pulse Oximetry system consists of a probe (sensor); the sensing probe consists of two LEDs, and a photo-detector. The two LEDs used in the sensor part are the red (660nm) and infrared (940nm) (refer Figure 4). The signal collected from the photo-detector (Light Dependant Resistor (LDR) & Infrared Receiver (IR)) will be supplied to a dual operational amplifier (LM358) and then further conveyed to PIC16F877A so that the signal could be processed easily [4].
2.2 Computing of Pulse Oximetry
The output signal from the dual amplifier will be further supplied to a Programmable Interface Controller (PIC16F877A) which will be converted from analogue signal into digital signal through the built-in Analogue to Digital Converter (ADC). However, this converting process will require MICRO C programming software to generate the Hexadecimal file of the PIC before one can display the value of detected pulse rate and oxygen saturation in the blood. The schematic drawing of PIC 16F877A was presented in Figure 5.
Fig 5. Details of PIC16F877A connections [5] 2.3 Display of Pulse Oximetry
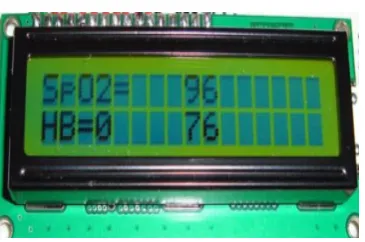
For the device to be user friendly as in showing the recorded values, the output produced by the PO will be displayed via a Liquid Crystal Display (LCD) screen. This also shows that the newly developed PO system has extra capabilities in collecting the measured data such as the HR and SpO2 which could be further analyzed and stored inside a computer as shown in Figure 6.
Fig 6: The complete device of the designed Pulse Oximetry system connected to a
40
From this study a portable PO system has been designed and developed. The system was able to produce highly reliable results for both HR and also SpO2. In developing the sensor part the use of super bright LED was useful since its capability to penetrate the skin layer with different color. Next, the LDR positioned near the LED were able to detect the light reflected at the fingertip during blood circulation and from this detection the output signal from LDR were in resistance and very small in value. Thus, there is a need for the signal to be amplified. The signal were then fed into the amplifier and further processed by the PIC. The next stage was to program the selected PIC. This required more efforts than the previous stage as the PIC needed boot loading then the micro C code was loaded into it. The PIC were programmed in order to functionalize the ADC converter thus, converted the analogue signal into digital.
Finally, the device was completed by the attachment of an LC, as well as demonstrating the output reading from the device through the computer. From this, the user of this PO device could read their test results via an LCD as shown in Figure 7.
In addition, the test results were also recorded and displayed on a computer by Visual Basic as show in Figure 8.
Fig 7. The Liquid Crystal Display (LCD) screen showing an example results
Fig 8. Display of the recorded test results via Visual Basic software
3.1 Comparison between standard System (DOLPHIN MEDICAL 2100 PULSE OXIMETER) with the proposed System
Once the PO device has been designed and developed, it is crucial to conduct a comparative analysis between the designed and the standard PO device.
Thus, the analysis will prove the reliability of the test results produced by the designed PO device. For this purpose three people with different skin color were selected such as (bright skin, fair skin and also dark skin). Therefore, in this section, Mr. Wan Suhaimizan, Mr. Mohamed Alarqaa and finally, the author himself (Mr. Mohamed Zaltum) were selected for the HB and SpO2 comparative test procedure.
International Journal of Integrated Engineering (Issue on Electrical and Electronic Engineering)
41
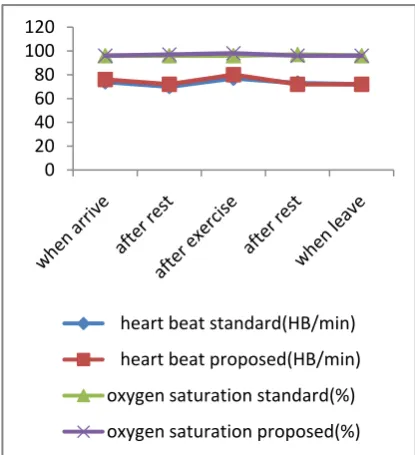
0 20 40 60 80 100 120
heart beat standard(HB/min)
heart beat proposed(HB/min)
oxygen saturation standard(%)
oxygen saturation proposed(%)
Fig 9. Results showing the output reading for pulse/oxygen level of (Mr. Mohamed Alarqaa)
Fig 10. Results showing the output reading for pulse/oxygen level of (Mr. Wan Suhaimizan)
Fig 11. Results showing the output reading for pulse/oxygen level of (Mr. Mohamed Zaltum)
From the results obtained for the three candidates as shown in the graphs (Figure 9, 10 and 11) the developed PO device were capable of producing test result with very close to the standard device. In another words, it could be summarized that the newly developed PO device were able to produce the test results with a difference of 5% error state, which demonstrated that the device has a high level of accuracy in comparison to the standard device. Next, the designed PO device was further tested for its reliability via a standard SpO2 simulator. The tests were conducted for both HR and SpO2 readings. The outcome of this test will be discussed in the next section.
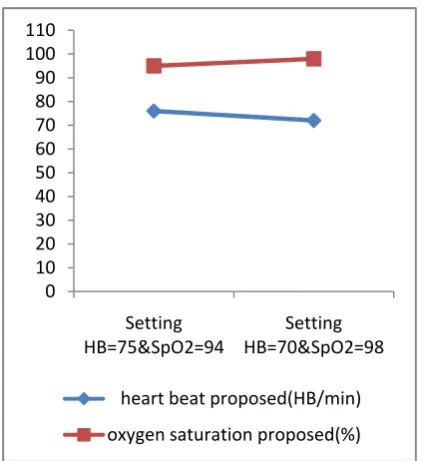
3.2 Test Proposed System by SpO2 Simulator (Index 2)
The results obtained from the standard system were compared with the SpO2 simulator under two setting which are (70 heart beat per minute (HB/min) and 75 HB/min). These standard values were set with the SpO2 device and compared with the standard system. From the tests performed, it was discovered that the 0
20 40 60 80 100 120
heart beat standard(HB/min)
heart beat proposed(HB/min)
oxygen saturation standard(%)
oxygen saturation proposed(%)
0 20 40 60 80 100 120
heart beat standard(HB/min)
heart beat proposed(HB/min)
oxygen saturation standard(%)
42
0 10 20 30 40 50 60 70 80 90 100 110
Setting HB=75&SpO2=94
Setting HB=70&SpO2=98
heart beat proposed(HB/min)
oxygen saturation proposed(%)
standard system were also having less than 5% errors, as shown in Figure 12. This again demonstrated the accuracy and reliability of the results as in the readings for the HB and SpO2 that were being produced by the PO device designed in this study.
Fig 12. Results produced by the SpO2 Simulator (Index 2) and the Proposed System
4. CONCLUSIONS
Overall, the objective of this research has been achieved, since the result obtained from the developed PO device has less than 5% errors state in comparison to the standard device. Therefore it is assured that the device were able to produce highly reliable test results for both the HR and SpO2. Considering the high cost of the standard equipment, local ones as in this study the home-built PO device demonstrated the proof of concept, where by a much cheaper device can be produced. In addition, this PO device has the extra function of recording the test result for the user to come back later to analyze and observe their test result again. Finally, these PO devices are highly suitable for personal usage, technical school and university level for educational and research purposes.
The author would like to take this opportunity to express his heartfelt appreciation and thanks to his respectful supervisor, Dr. Muhamad Mahadi bin Abdul Jamil and co supervisor Mr. Muhammad Shukri bin Ahmad for their supervision, encouragement, contradictive ideas, patience, guidance and invaluable advice, enabling the author to produce this paper.
6. REFERENCES
[1]. Ferrera, F., Ferrero, F., Blanco, C., Viera, J., Vega, M., Blanco, J. (2006).
Design of a low-cost instrument for pulse oximetry.
Proceedings of the IEEE Instrumentation and Measurement Technology Conference, pp. 573-577.
[2]. Hoff, D. Zhang, R. Stalter, T. and Carlson, M. (2003). Pulse Oximetry. Undergraduate Thesis. Electrical and Computer Engineering, North Carolina State University, USA.
[3].Deni, H. Muratore, D. M. Malkin, R A.
(2005). Development of a Pulse
Oximeter Analyzer for the Developing
World. Proceedings of the IEEE 31st
Annual Northeast Bio‐engineering
Conference. pp. 227‐228.
[4]. Moyle, J. (2003). Pulse oximetry. Second edition, BMJ Publishing Group. London, United Kingdom. Journal of Anesthesia (ISBN 0-7279-1740-4) pp 174.
[5]. MicroController Pros Corporation: Product information, Retrieved on: 20th March 2009. Last updated: 16th December 2008 URL : ( http://microcontrollershop.com).
[6].Gupta, R.C. Ahluwalia, S.S. &
Randhawa, S.S. (1995). Design and
Development of Pulse Oximeter
International Journal of Integrated Engineering (Issue on Electrical and Electronic Engineering)
43
BMESI. Central Scientific Instruments
Organisation, INDIA.
[7]. Oximetery.org: Pulse oximetry and applications, Retrieved on: 10th of August 2008, Last updated: 2006 URL: (http://www.oximeter.org).
[8]. Jovanov, A. Milenkovic, A. Basham, S. Clark, D. Kelley, D. (2004). Reconfigurable Intelligent Sensors for Health Monitoring: A Case Study of Pulse Oximeter Sensor. Proceedings of the 26th Annual International Conference of the IEEE EMBS, San Francisco, CA, USA. September 1-5, 2004.
[9]. Severinghaus, J. Honda, Y. (1987). History of blood gas analysis VII. Pulse Oximetry. J Clin Monit 1987 Apr 3 (2): pp.135-138.
![Fig 5. Details of PIC16F877A connections [5]](https://thumb-us.123doks.com/thumbv2/123dok_us/8441236.1701498/3.595.320.496.450.606/fig-details-of-pic-f-a-connections.webp)