Mode behaviors including non-linear development and pressure profiles during internal reconnection events are clarified in the MAST spherical tokamak. In aq0 > 1 discharge, the tearing mode is a trigger; however,
non-linearity of modes is not confirmed. On the other hand, in aq0<1 discharge, the harmonics of am/n=4/1
mode of∼22 kHz are confirmed. Method for identification of poloidal mode in ST configuration is also given.
c
2008 The Japan Society of Plasma Science and Nuclear Fusion Research
Keywords: IRE, spherical tokamak, bicoherence, poloidal mode, reconnection DOI: 10.1585/pfr.3.S1065
1. Introduction
Internal reconnection events (IREs), which limit per-formance, have often been observed in spherical tokamaks (STs). IREs are MHD instabilities that show mode growth of precursor and flatten the pressure profile. In the worst case, they result in disruption. Three-dimensional MHD simulations have shown that linear growth rate and mode number of pressure-driven modes depend onq0(safety
fac-tor at the magnetic axis) andβt (toroidal beta), and that
non-linear coupling of linear modes leads to a large plasma deformation [1]. In this situation, magnetic reconnection occurs and core plasma energy is lost along the recon-nected magnetic line. The relationships between the mode number (and its growth rate) andq0andβthave not been
clarified experimentally. Moreover, non-linear coupling of modes just before IRE have not been investigated in detail. In MAST [2], IREs appear in bothq0 >1 andq0 <1
dis-charges and they often limit the achievable plasma beta in high-βregimes. The objectives of this study are to clarify mode number and its dependence on such parameters, and to confirm the existence of non-linear coupling.
2. Experimental Setup
2.1
Mirnov coil array and identification of
poloidal mode number
Mirnov coils (magnetic probes) are sensitive to ex-ternal mode behavior and are employed to identify mode numbers. In MAST, magnetic coils are located along the toroidal direction (12ch at the most), along the center col-umn (40ch), and along the outboard (18ch at the most). In STs, determination of poloidal mode numbers (m) is not easy because of the effects of non-circular magnetic flux author’s e-mail: tojo@fusion.k.u-tokyo.ac.jp
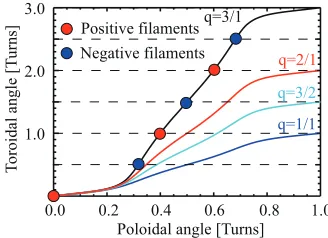
surfaces and asymmetric magnetic field pitch angle. To overcome these problems, we developed a method to eval-uate the poloidal mode number and its intensity. First, we assume helical filamentary currents, which generate mag-netic fluctuations, on their resonant surface calculated from EFIT [3]. The poloidal positions of these filaments are decided by tracing a magnetic field line. The number of alternating positive and negative filament pairs coincides with the mode number. Figure 1 shows trajectories of magnetic lines at the surfaces q = 1, 1.5, 2, and 3. In this case, the initial poloidal angle (θ = 0) is located at the outboard midplane. The poloidal location of each fil-ament (i.e., marker filfil-ament) can be obtained from the in-tersection of the curve and integer or half-integer toroidal turns (Fig. 1). The tangents of the lines become steep at
θ ∼ πbecause of the strong toroidal field at the inboard side. Therefore, the poloidal distribution of the filaments is asymmetric, and most of them tend to be located at the
Fig. 1 Trajectory of the magnetic field lines at the rational sur-facesq=1, 1.5, 2, and 3. Poloidal angles of filaments are obtained from the intersections between the traces and horizontal lines with intervals of half-integer turns.
c
2008 The Japan Society of Plasma
Fig. 2 Contour plot of the poloidal flux surfaces and filament positions at rational surfacesq=1 (cross), 1.5 (asterisk), 2 (rectangle), and 3 (triangle).
high field side (Fig. 2). The number of filaments (and their rational surface), current amplitude, and the poloidal loca-tion of the initial filament were obtained from the best fit to the measured Mirnov coil signals. By performing fit-tings at each timing, we can derive poloidal rotation and amplitude growth of the mode. However, in this report, we used band-passed signals and assumed single-mode distor-tion located at a radistor-tional surface to study the role of the dominant mode. Note that this model is appropriate for localized rational modes, such as tearing modes.
2.2
Measurement of soft X-ray profile
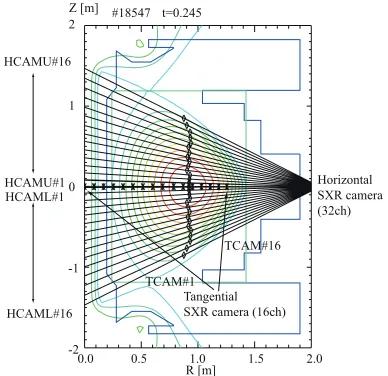
Soft X-ray radiation (SXR) is useful in the study of MHD phenomena, and it provides information on internal mode structure. Horizontal (32ch) and tangential (16ch) SXR cameras are employed, and their sight lines are shown in Fig. 3. To compare SXR behavior,q (calculated from EFIT), and (electron) pressure profile (measured by Thom-son scattering), the sight lines of each SXR channel are la-beled by the minimum poloidal flux (ψ) obtained by EFIT. In other words, along each sight line, we determine the minimum ofψ(symbols in Fig. 3) and corresponding ra-dial positionR.2.3
Analysis using bispectrum to show
non-linear coupling
To clarify non-linear development of IRE precursors, we performed bispectrum analysis, which is a Fourier anal-ysis for three-wave interaction and used frequently in tur-bulence analysis [4, 5]. Generally, auto bispectrum is de-fined as
B(f1,f2)=X(f1)X(f2)X∗(f3), (1)
where f3 = f1+ f2 andX(f) is a Fourier components of
signalx(t). To evaluate the degree of nonlinear coupling for each frequency component, the following normalized
Fig. 3 Configuration of horizontal (sight lines) and tangential (asterisk) SXR cameras.
auto bispectrum is commonly used:
b2(f1,f2)=
|B2(f 1,f2)|2 |X(f1)X(f2)|2|X∗(f3)|2
. (2)
If there is a strong non-linear relationship between f1 and
f2,b2becomes large (nearly 1). We analyzed Mirnov coil
data for understanding non-linear development in IRE pre-cursors. To obtain accurate bicoherence, a large number of ensembles should be averaged. In MAST, there are twelve (maximum) toroidal Mirnov coils around the center col-umn at the same poloidal position. We employed these coil data to perform ensemble averaging. Total bicoherence is defined as
B2tot=
f1,f2
B2(f1,f2), (3)
which represents quantitative measurement of non-linear coupling.
3. IRE Discharges
3.1
IRE with
q
0>
1
A typical discharge withq0>1 andβt∼9% is shown
in Fig. 4. Increase in plasma current (Ip) and drop in the
Fig. 4 IRE in discharge withq0 >1. (a): Plasma current [kA],
(b): Line-integrated electron density [/m2] (c): dB/dt
from Mirnov coil [a.u.], (d): Emission ofDα[a.u.] (e): SXR radiation [a.u.] on horizontal SXR camera from up-per side to the center of the plasma.
Fig. 5 Integrated Mirov coils signal (1-5 kHz) and fitted curve of the model assuming onlym/n=2/1 mode for18547 att=0.24785s. The origin of poloidal angle is the mag-netic axis determined by EFIT.
band-pass (1-5 kHz) filtering to the time-integrated Mirnov signals. An example of the fitting is shown in Fig. 5. The squares represent the Mirnov coil data att=0.24785 and the line shows a fitted curve assuming only 2/1 mode (fil-aments) at the rational surface q = 2. They show good agreement. Figure 6 indicates time evolution of the calcu-lated helical filament current (a), poloidal angle of a fila-ment (b), and fitting error (c). As described in 2.1, filafila-ment current reflects mode intensity, and it can be used to derive the growth time. Fromt ∼0.241, the filament current in-creases exponentially, indicating linear growth. The time constant (τfil) of this growth is about 6 ms. The phase of the
filament decreases continuously, showing poloidal rotation of the filaments. The error of the fitting is represented by the normalized residual errorχ2. Whenχ2is less than 10,
the quality of the fitting is acceptable in the present analy-sis. We performed bispectrum calculation on the toroidal Mirnov signals (φ = 10◦,50◦,70◦,110◦,130◦,170◦,230◦, and 290◦) with 250 kHz sampling rate in order to check non-linearity. The number of ensembles is 8 and the num-ber of data points per ensemble is 750 (3 ms). The results
Fig. 6 Time evolution of the fitting parameters for18547. (a): Filament current [kA] (b): Poloidal angle of the marker filament selected to understand poloidal rotation, and (c): χ2(error of the fittings).
Fig. 7 18547 Bicoherence spectrum (t=0.245 - 0.248) of the toroidal Mirnov coils (top) and power spectrum in the logarithmic scale (bottom).
are shown in Fig. 7. There is strong bicoherence around (f1,f2)∼(40 kHz, 40 kHz), indicating harmonic coupling
with itself; however, these modes are localized near the centre of the plasma (R ∼ 1.0 m) observed in SXR sig-nals and they seems to be independent of the 2/1 mode. No strong bicoherence was observed around the frequency of the 2/1 mode. The position of q = 2 at t = 0.248 s from the EFIT result is R ∼ 1.33 m, and it is not far from the expected reconnection position (R∼1.25 m) ob-served in SXR, but the high-frequency mode is obob-served atR ∼1.0 m. Thus, the growth of the 2/1 mode atq =2 seems to trigger IREs.
3.2
IRE with
q
0<
1
In the case of q0 < 1, IRE should be distinguished
from sawtooth oscillation, which is an instability at the
Fig. 8 IRE in a discharge withq0<1. (a): Plasma current [kA],
(b): Line-integrated electron density [/m2] (c): dB/dt
from Mirnov coil [a.u.], (d): Emission ofDα[a.u.], and (e): SXR radiation [a.u.] on horizontal SXR camera from top to center (SXR signals for midplane to upper chords) of the plasma. Yellow dotted line shows significant phase difference between the two SXR signals (HCAMU9 and11).
instability with mode couplings and/or is often accompa-nied by a collapse at the rational surface, except for the
q = 1 surface. Figure 8 shows an IRE discharge with
q0<1. This IRE does not terminate the plasma but reduces
βtsignificantly. The position of the reconnection is around
HCAMU14 (R∼1.45 m). However, the area with strong oscillation is close to HCAMU9-11(R∼1.2 - 1.3 m), and the phase difference between HCAMU9 and 11 is sig-nificant (two yellow lines in Fig. 8). Tearing modes cre-ate islands, where pressure and other values tend to be-come flat. When an island rotates along the toroidal or poloidal direction, the local gradient oscillates. If SXR is measured on both the sides, it will show opposite be-haviors. Thus, the out-of-phase oscillations between close SXR chords indicate the existence of an island. There-fore, this phase change is caused by a tearing mode, and the resonant surface is atR ∼ 1.24 - 1.28 m. The fitting code does not work well on this shot because the calcu-lated position of the resonant surface (from EFIT) is pre-sumably not good. However, as indicated in section 2.1, the number of filaments (model of the mode) on the out-board side is very low because of the low aspect ratio configuration. Therefore, the poloidal mode number can be estimated roughly by counting peaks along the centre stack and adding one for outboard filament. In this man-ner,m/n=2/1 is confirmed for thisq0<1 discharge. Note
that it is difficult to derive the growth time and rotation w/o the fitting. The width of the 2/1 mode appears to in-crease, as shown by SXR radiation from the outer side, e.g., HCAMU14 fromt ∼ 0.392 s. In addition, Mirnov coils show another high-frequency mode (∼22 kHz). Un-fortunately, there is no strong cross-correlation between this high-frequency mode and any SXR channel, and the position of this mode is not clear from SXR signals.
How-Fig. 9 18501 Bicoherence spectrum (t=0.389 - 0.392) of the toroidal Mirnov coils (top) and power spectrum on loga-rithmic scale (bottom).
Fig. 1018501 Bicoherence spectrum (t=0.389 - 0.392) at f2 =
22 kHz (a) and power spectrum in logarithmic scale (b). The red shaded area is the 2/1 mode component.
ever, the poloidal mode number (m) is presumed to be 4 and the toroidal mode (n) is 1. These mode numbers are de-termined by the Mirnov coil arrays. Therefore, this mode localizes at the edge (R> 1.5 m). To clarify the relation-ship between these modes (i.e., 3 and 22 kHz), the bicoher-ence spectrum is calculated (Fig. 9). Fort=0.389 - 0.392, there is no significant physical coupling between the two modes. Figure 10 shows the bicoherence for f2 =22 kHz
as a function of f1. The power spectrum is also plotted
at the bottom. No strong bicoherence was found around 3 kHz (red shaded area), indicating no coupling between the 2/1 and 4/1 modes from this analysis. Instead, the 4/1 mode (∼22 kHz) shows second and third harmonic modes (approximately 45 and 68 kHz). Figure 11 shows the result in a later periodt=0.392 - 0.395 s. These frequencies are localized on the frequency space and the sharp coherence disappears, but broad bicoherence appears in the region
Fig. 1118501 Bicoherence spectrum (t=0.392 - 0.395) of the toroidal Mirnov coils (top) and power spectrum on loga-rithmic scale (bottom).
Fig. 12 Plot of magnetic shear (S) and pressure gradient from the kEFIT result at theq=2 rational surface before (0 -21 ms) IRE. The symbols correspond to the specitic shots. The red shaded circles indicate values just before IRE.
a large number of modes. This is consistent with the non-linear phase of the MHD simulation in reference [1]. The total squared bispectrum (duration of ensemble is∼3 ms) at these two periods shows a significant increase of about 50 times. However, we cannot decide which mode is a trig-ger of this IRE, because the position of the high-frequency mode was not identified.
4. IRE Drive
To understand the drive of IRE is important for its prevention. For comparing with reference [1], which sug-gested a pressure-driven mode as the source of the
insta-the result from kEFIT. Therefore, it is possible that oinsta-ther hidden parameters control the growth of IREs.
5. Summary and Conclusion
In this paper, IREs in the MAST plasma were studied using a filament model, in which low aspect ratio effects are taken into account. In the case ofq0 > 1, no mode
coupling related to IRE is observed, but the growth of the 2/1 tearing mode withτ ∼ 6 ms is confirmed. The mode triggers a collapse. In the IRE withq0<1, slow growth of
the 2/1 tearing mode is observed and the second and third harmonics from a 4/1 mode, (f1,f2) ∼(22 kHz, 22 kHz)
and (f1,f2) ∼(22 kHz, 44 kHz), are confirmed in Mirnov
coil signals. After that, these bicoherence peaks disappear and broad bicoherence in the range of f1 + f2 < 50 kHz
is observed. This is consistent with the time evolution of each mode in [1]. Although we have not found a clear evi-dence of non-linear development causing an IRE followed by collapse, the 2/1 mode may trigger the collapse. To find out the source of IRE, we compare time evolution of pres-sure gradient and magnetic shear. Many IREs show the existence of a critical pressure gradient, which increases with magnetic shear atq=2, suggesting a pressure-driven nature. However, some shots do not show such behavior, and it is necessary to find other parameters determining the growth of such IREs.
Acknowledgment
This work was supported by JSPF Grant-in-Aid for Scientific Research 16106013.
[1] N. Mizuguchiet al., Phys. Plasmas7, 940 (2000). [2] B. Lloydet al., Nucl. Fusion43, 1665 (2003). [3] L. Laoet al., Nucl. Fusion25, 1611 (1985).
[4] Y.C. Kim and E.J. Powers, Phys. Fluids21, 1452 (1978). [5] Y. Nagashimaet al., Plasma Phys. Control. Fusion49, 1611
(2007).