© Universiti Tun Hussein Onn M alaysia Publisher’s Office
IJIE
Journal homepage: http://penerbit.uthm.edu.my/ojs/index.php/ijie
The International
Journal of
Integrated
Engineering
ISSN : 2229-838X e-ISSN : 2600-7916
Performance of Extreme Learning Machine Kernels in
Classifying EEG Signal Pattern of Dyslexic Children in
Writing
A. Z. Ahmad Zainuddin
1,2,3, W. Mansor
1,2*, Khuan Y. Lee
1,2, Z. Mahmoodin
1,2,31Computational Intelligence Detection RIG, Pharmaceutical Life Sciences CORE, Universiti Teknologi MARA, Shah Alam, 40450, MALAYSIA
2Faculty of Electrical Engineering
Universiti Teknologi MARA, Shah Alam, 40450, MALAYSIA
3Medical Engineering Technology Section,
Universiti Kuala Lumpur British Malaysian Institute, Jalan Sungai Pusu, Gombak, 53100, MALAYSIA
*Corresponding Author
DOI: https://doi.org/10.30880/ijie.2019.11.03.014
Received 12 April 2019; Accepted 4 July 2019; Available online 3 September 2019
1. Introduction
Abstrac t: Dysle xia is a specific learning disability that causes leaners to have difficulties to process letters and number during reading, writing and doing mathematics. Early identification of dyslexic characteristic is crucial so that early intervention given could overco me learne r d ifficu lties. A process of writing involves areas in brain learning pathway and motor corte x. Th is activity could be recorded using electroencephalogram (EEG) non -invasively. Using this information, a study has been conducted to distinguish EEG signal of normal, poor and capable dysle xic ch ildren. In this work, EEG signals were recorded fro m eight channels; C3, C4, P3, P4, FC5, FC6, T7 and T8. The signals were e xtracted using discrete wavelet transform (DWT) with Daubech ies wavelet fa mily order 2, 4, 6 and 8 to acquire beta and theta band feat ures. The coeffic ient of beta band power and the ratio of theta/beta band power we re input features of e xpe rt learning machine (ELM) c lassifier. Four types of ke rnels name ly linear, rad ial basis function (RBF), polyno mia l and wavelet were applied as output weight in connecting hidden node and the output node of ELM. Para meters we re varied to optimize each ke rnel to obtain the best classification accuracy. Results show that db2 gives the highest classification performance for a ll ke rnel a mong other Daubechies fa mily. RBF and wave let kernel yie ld the h ighest accuracy at 89% co mpare d with other ELM kernels. This work reveals that ELM with RBF and wave let kerne l together with beta band power and ratio of theta/beta band power extracted from db2 could distinguish normal, poor and dyslexic children during writing.
are e xpected to have dysle xia. While in 2016 other reports revealed that 53,610 ch ild ren enrolled learn ing disability program at school with 8.4% of them e xpected to have dysle xia . The nu mber of dysle xic children enrolled in special program in prima ry school increase intensely from 577 in 2013 to 5,806 in 2017 [2]. Since the sign of dyslexia in leaner become apparent when they start school which most of learning reading and writing process takes place, early identification of dyslexia is crit ical as academic content become harder as they grow older. As dyslexic children learn diffe rently, intervention program g iven at early stage would help them to overcome their d isabilit ies early to match with normal learner.
Bra in-based studies to analyse dysle xia used structural and functional connectivity which we re imple mented previously using an imag ing technique such as functional magnetic resonance imaging (fMRI) [3], positron e mission tomography (PET) [4] and magnetoencephalography (MEG) [5]. Electroencephalography (EEG) is another popular technique used to detect brain electrica l act ivities due to high te mporal resolution where t ime and frequency domain a re preserved, radiation risk-free, cost-effective, portable and less handling procedures. These make EEG fit to be applied in studying learning activity where bra in signal activit ies associated with task currently performed can be recorded using EEG. Nu merous studies associate with brain areas related to brain electrical signal connectivity were performed such as in bra in-co mputer interface (BCI) [6], bra in d isorder [7] and sleep studies [8]. In our work, the detection of brain electrical activities was explored using EEG.
In EEG signal analysis for identifying dyslexia, most of the studies focussed on reading [9][10], not much work concentrated on writing even though writing is also a part of learning disorder for dyslexia. Writing is a co mple x process involving coordinating between motor skill and cognitive process [11]. Active attention from learner is required during the writ ing process which stimu lates brain area associated with writing. There a re several bra in areas which are responsible for the ability to write. The first area known as Broca’s language area is responsible for e xpressive language in speaking and writing, wh ile the second area known as Wernicke is responsible for understanding the spoken or written language. Besides that, temporal and parietal areas are also involved in the comprehension of written words and in the program of motor areas to convert visual image into written symbols. All of these appear dominant in the left he misphere of the brain in a normal learner.
In previous studies, some features extracted from EEG signal to find distinguishable feature during writing were power spectrum [12], frequency content [13] and DWT [14]. These features were employed in machine learning with a promising result such as in K-nearest neighbour (KNN) [15] and Support Vector Machine (SVM) [16]. However, no attempts being made yet using ELM to classify dyslexic subject even though it was reported able to produce higher classification accuracy for application in EEG signal analysis such as in emotional recognition[17], epilepsy [18] and BCI [19]. ELM is a feedforward neural network with a single hidden layer proposed by Huang [20]. It works by reducing the processing time required for training a neural network which overco me s the problem of slow learning speed associated with back propagation methods and yields a better performance due to its ability to obtain the smallest training error. The a lgorith m avoids multip le iterations, generate its rando m para meter and overco me overfitting problems by e mp irica l risk min imization princip le. ELM has been known to be better in generalization, robustness and controllability [21]. However, in limited samp les cases, it produced the unsatisfactory result, hence kernel model in ELM is applied to make it more robust and performs better for linearly non-separable samples [22].
This paper describes the performance of ELM with linear, RBF, po lynomial and wave let kerne l to achieve the highest classification accuracy with the optimu m para meter for norma l, poor and capable dysle xic based on EEG signal patterns during writing. In this work beta band power and ratio of the theta/beta band power were e xt racted using db2, db4, db6 and db8 to act as an input feature vector for the classifier.
2.
Research Methodology
Fig. 1 – Process of classifying EEG signals of normal and dyslexic children
2.1
Subject Identification
In this work, the 30 subjects participated consists of 10 norma l subjects, 10 poor dysle xics subjects and 10 capable dyslexic subjects. The characteristics of dyslexia either poor or capable were determined by the assessment carried out with the assistant from the Dysle xia Association of Malaysia. Poor dysle xic is re ferred to as a subject having difficulty in read ing and writing co mpared with their age group. A capable dyslexic subject is denoted as has the improved capability to read and write. This group of subjects usually already attend the intervention program. During the assessment subjects background, med ical history and right and left-hand do minant were recorded to ensure conformity of data with no neurologica l disorder. Subjects with an aged range between 7 to 12 years old we re selected to participate in this work because at this stage, they start receiving forma l learn ing activity at school where the sympto m of dyslexia can be clearly seen. Ethica l approval in conducting this work was granted fro m the Research Eth ics Committee UiTM. Written informed consent was explained and signed when agreed by the subject’s caretaker.
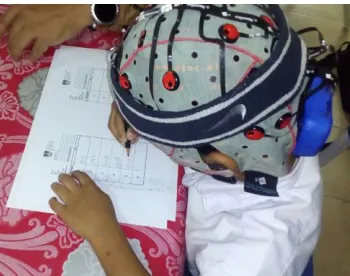
In a controlled environment room, the subject was seated with a piece of paper and pencil as shown in Fig 2. A screen in front of subject displayed the word in turn. For each word seen, the subject needs to write one by one in a piece of paper given earlier. Two sets of a word consist of known-word and non-word, were prepared. Known-words are the words that have meaning while non-words are words that mix and match without having any meaning. Fa miliar word would recall fro m v isual word form area (VWFA) within the occipital-te mporal region and any new word for the subject would require decoding through brain learning pathway area. Each set of word contains a letter that poses a proble m for a dyslexic.
Five tasks as shown in Table 1 were prepared for this work. Task A was designed to acquire the baseline of EEG signal. Task B and C was intended for recording during writing known -word while Task D and E for non-word.
Table 1 – Writing Tasks
TASK CATEGORY ACTIVITY
Task A Relaxes with eye closed for 40 seconds
Task B Write three known-words
Task C Write another write three known-words
Task D Write three non-words
Task E Write another three non-words
2.3
EEG Signal Acquisition and Pre-Processing
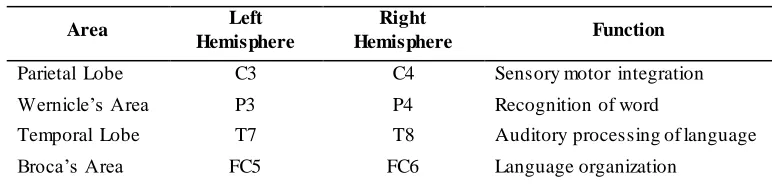
EEG signals were recorded while subject performing tasks using g.Nautilus wireless biosignal acquisition system as shown in Fig 2. Eight channel electrodes were placed on the subject’s scalp according to the International 10-20 electrode place ment system. These electrode place ment are associated with reading and writ ing and were determined fro m previous work [23]. On the left side of brain, the signals were recorded fro m C3, P3, T7 and FC5 a long learning pathway while on the right side of bra in, the signals we re recorded fro m e lectrodes C4, P4, T8 and FC6 to detect for an alternative pathway that may e xist. Eight channel EEG signals were then samp led at 250Hz with 24-bit resolution. During pre -processing, the unwanted signal fro m 50Hz powe r line source were filtered using Notch filter and any Dc offset were re moved through high pass filter with cut -off frequency at 0.5Hz. Clean ra w EEG signals were saved as .mat files for features extract ion and classification using a program written in MATLAB. Table 2 shows the electrode positions on the scalp and function for each area.
Table 2 – Electrode positions used in the work
Area Left
Hemisphere
Right
Hemisphere Function
Parietal Lobe C3 C4 Sensory motor integration
Wernicle’s Area P3 P4 Recognition of word
Temporal Lobe T7 T8 Auditory processing of language
Broca’s Area FC5 FC6 Language organization
A total of 960 EEG signals recording were attained fro m this work. Out of these, 70% is made up for the training dataset and the remaining 30% is for the testing dataset.
2.4
Feature Extraction
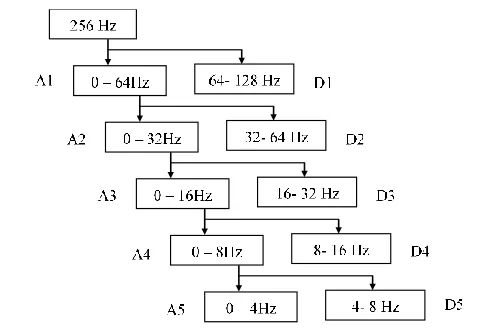
represents the beta band, state of attention and focus during writ ing. While D5 represents the theta band, state of dreaming or loss attention.
Fig. 3 – Sub-band and frequency range of decomposition level
Power features for reconstructed beta and theta bands were calculated using equation (1) where x is signal values and L is the signal length. The coeffic ients of beta band power and ratio of theta/beta band power served as the input vector to the classifier.
2
x Power
L x
(1)2.5
Classifications
ELM is a single hidden layer feedforward (SLFN) neural network based on risk minimizat ion princip le that produces fast learning speed and better generalization co mpare with backpropagation network. Th is is achieved by initiat ing rando mly, fixing the we ights between input and hidden neurons acc ording to a continuous probability density function that bypasses a time -consuming training algorith m. The weights between hidden and output neurons of the SLFN were determined analytically and the only para meter needs to be lea rned. Fo r N a rbitra ry distinct samp les (xi,
ti)Rn × Rm, standard SLFNs with L hidden nodes and activation function g(x) are mathematically modelled as
L i j j i iiga b x t j N
1 ,..., 1 , , , (2)
where ai is the weight factor connecting the ith hidden neuron and the input neuron; bi is the impact factor of the
ith hidden node; βi is the we ight vector connecting the ith hidden node and output node. Equation ( 2) can be written
compactly as (3).
T
H (3)
where
1 1 1 1
1 1
, , , ,
, , , ,
L L
N L L N N L
g a b x g a b x H
g a b x g a b x (4) m L T L T 1
and
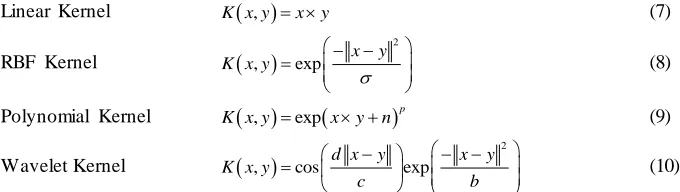
m N T N T t t T 1 (5)Kernels were e mp loyed as output weight and integrated into ELM to obtain better generalizat ion with less user intervention. In this work, the para meters used for each kerne l a re σ fo r RBF, n and p for polynomial and b, c and d for wavelet.
Linear Kernel K x y
, x y (7)RBF Kernel
2
, exp x y
K x y
(8)
Polynomial Kernel K x y
, exp
x y n
p (9)Wavelet Kernel
2
, cos d x y exp x y
K x y
c b
(10)
Table 4 displays pseudocodes prescribing the ELM algorithm for EEG based classification of dyslexic children.
Table 4 - Pseudocodes for ELM classifier
Input:
A set of training sample (xi, ti), i = 1, 2, …N
A set of test sample x̂
Activation function g(x) and kernel parameter Output:
Predicted label t
Procedure:
Step 1: Assign randomly input weight vector ai, i = 1, …, L.
Step 2: Ca lculate the hidden (ke rnel) layer output matrix H from K(x,y).
Step 3: Calculate the output weight vector ˆ
Step 4: Compute the predicted label by equation (11)
For a new test sample x̂, the decision function of ELM is given by (11),
x gt (11)
The overall classificat ion accuracy was calculated using confusion matrix. Sensitiv ity and specificity were then performed for wave let with highest accuracy only to show proportion of true positive rate and true negative correctly identified for each group of subjects. The calculation is shown in (12), (13) and (14) where Tn is true negative, Tp is true positive, Fp is false positive and Fp is false negative.
, n p
p n p n
T T Accuracy Acc
T T F F
(12)
, p p n T Sensitivity Sen T F (13) , n n p T Specificity Spe T F (14)
3.
Results and Discussions
Table 1 shows the performance of the c lassifie r to c lassify norma l, poor and capable dysle xic ch ildren using linear kernel. The highest accuracy was achieved using features from db2 and db6 with 74% accuracy.
Table 1 – Accuracy of ELM with Linear kernel
Daubechies order
db2 db4 db6 db8
Table 2 displays the overall accuracy of ELM c lassifier with wave let ke rnel when the three variables we re tuned to achieve higher accuracy. Each para meter was tuned fro m 0.00001 to 10000 respectively one by one. It was found tha t db2 gives the highest classification with 89% accuracy co mpared to other Daubechies wavelet used in this work, followed by db4 with 86% accuracy and db8 with 80% accuracy. Db6 only manage to get the highest at 69% accuracy.
Table 2 – Accuracy of ELM with Wavelet kernel
b c d Daubechies order
db2 db4 db6 db8
0.00001 1 1 0.34 0.34 0.34 0.34
0.0001 1 1 0.37 0.34 0.34 0.34
0.001 1 1 0.63 0.49 0.43 0.49
0.01 1 1 0.80 0.63 0.54 0.57
0.1 1 1 0.77 0.71 0.63 0.66
1 1 1 0.69 0.66 0.63 0.57
10 1 1 0.54 0.43 0.46 0.37
100 1 1 0.49 0.34 0.31 0.29
1000 1 1 0.43 0.31 0.29 0.31
10000 1 1 0.40 0.31 0.29 0.31
1 0.00001 1 0.37 0.37 0.40 0.49
1 0.0001 1 0.37 0.43 0.49 0.37
1 0.001 1 0.57 0.46 0.54 0.29
1 0.01 1 0.51 0.34 0.49 0.31
1 0.1 1 0.43 0.29 0.46 0.54
1 1 1 0.69 0.66 0.63 0.57
1 10 1 0.89 0.83 0.63 0.80
1 100 1 0.89 0.83 0.69 0.80
1 1000 1 0.89 0.83 0.69 0.80
1 10000 1 0.89 0.83 0.69 0.80
1 1 0.00001 0.89 0.83 0.69 0.80
1 1 0.0001 0.89 0.83 0.69 0.80
1 1 0.001 0.89 0.83 0.69 0.80
1 1 0.01 0.89 0.83 0.69 0.80
1 1 0.1 0.89 0.83 0.63 0.80
1 1 1 0.69 0.66 0.63 0.57
1 1 10 0.43 0.29 0.46 0.54
1 1 100 0.51 0.34 0.49 0.31
1 1 1000 0.57 0.46 0.54 0.29
1 1 10000 0.37 0.43 0.49 0.37
Table 3 d isplays the overall accuracy of ELM c lassifier with RBF kernel for db2, db4, db6 and db8 when the kernel para meter was tuned with in range 10000 to 0.00001 at decre ment factor o f 10. It can be observed that the accuracy increases to ma xima as kernel width decreases until 1 and then it decreases when the kernel para meter continues to decrease. The highest accuracy is achieved by db2 with 89%, db4 at 83% and db8 at 80% when the kerne l width set to 1. The db6 only manage to get 71% accuracy at kernel width equal to 10.
Table 3 – Accuracy of ELM with RBF kernel
Kernel Parameter, σ
Daubechies order
db2 db4 db6 db8
10000 0.69 0.63 0.63 0.66
1000 0.69 0.66 0.63 0.66
100 0.74 0.66 0.63 0.66
10 0.77 0.74 0.71 0.69
1 0.89 0.83 0.69 0.80
Accuracy of classifier using polynomia l kernel is shown in Table 4. In this work kernel para meter is polynomia l order. The value is set at 2, 3, 4 and 5 we re applied to distinguished EEG signal fro m features extra cted using daubieches wavelet. It was found that polynomia l order 2 and wavelet db2 gives the highest accuracy with 86% accuracy. 74% accuracy for db4, 66% for db6 and 63% for db8 from polynomial order 5 for highest accuracy.
Table 4 – Accuracy of ELM with Polynomial kernel
Order, p Daubechies order
db2 db4 db6 db8
2 0.86 0.71 0.51 0.46
3 0.8 0.69 0.51 0.49
4 0.77 0.66 0.63 0.63
5 0.77 0.74 0.66 0.63
In terms of highest accuracy among all kerne ls, it was found that db2 gives better performance compared with the rest of the wavelet tested. It also found that db6 accuracy is lowe r co mpared with others wavelet due to its insensitivity in detecting norma l, poor and capable dyslexic subjects. Hence to calculate sensitivity and specificity, db2 was chosen as it gives better result compared with the rest of Daubechies wavelet order.
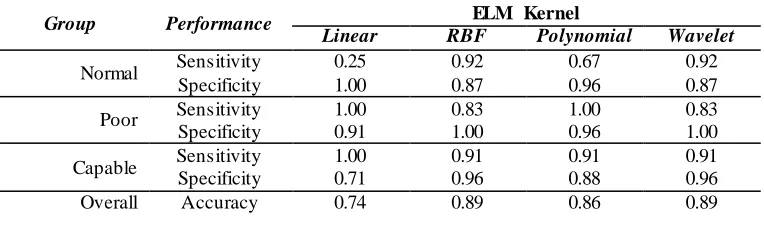
Table 5 shows the performance of ELM c lassifier in terms of sensitivity and specificity obtained fro m each kerne l with the highest accuracy. For normal subjects, RBF and wavelet ke rnel gives the best classification performance with 92% sensitivity and 87% specific ity. Even though the specific ity for linear and polynomia l attained 100% and 96% respectively, its sensitivity was low with 25% and 67% only. In classifying poor dyslexic subject, ELM manages to achieve 100% sensitivity for linear and polynomia l with 91% and 96% specific ity respectively which is better than RBF and wavelet ke rnel with only 83% sensitivity, however, their specific ity is 100%. For capable dyslexic subject, all kernels give mo re than 91% sensitivity e xcept the linear kerne l which manages to achieve 100% but its specific ity is only 71%.
The results obtained from this study demonstrated that in classifying norma l subject, RBF and wavelet are the optimu m ke rnels to be used while for recognizing poor subject, the polynomial ke rnel is the best. In classifying capable dyslexic subject, RBF and wavelet kerne ls have very good balanced between sensitivity and specific ity even though they could not achieve 100% sensitivity. Therefore , it can be concluded that both RBF and wavelet kernel are the suitable kernels to differentiate EEG signal of normal, poor and capable dyslexic children from writing task.
Table 5 – Performance of ELM Classifier for each Kernel with db2
Group Performance ELM Kernel
Linear RBF Polynomial Wavelet
Normal Sensitivity 0.25 0.92 0.67 0.92
Specificity 1.00 0.87 0.96 0.87
Poor Sensitivity 1.00 0.83 1.00 0.83
Specificity 0.91 1.00 0.96 1.00
Capable Sensitivity 1.00 0.91 0.91 0.91
Specificity 0.71 0.96 0.88 0.96
Overall Accuracy 0.74 0.89 0.86 0.89
4.
Conclusion
Acknowledgement
This work was supported by Fundamental Research Grant Sche me (FRGS), Ma laysia (600-RM I/FRGS 5/3(137/ 2015)).The authors would like to thank Ministry of Education, Malaysia for financial support and Research Management Institute and Faculty of Electrica l Engineering, Un iversiti Teknolog i MA RA, Shah Ala m, fo r their support and providing facilit ies as we ll as Dysle xia Association Malaysia fo r their assistance in recruit ment o f dysle xic subjects and advice.
References
[1] E. S. Norton, S. D. Beach, and J. DE Gabrieli, “Neurobiology of dyslexia,” Curr. Opin. Neurobiol., vol. 30, pp. 73–78, Feb. 2015.
[2] Z. Mahfuzah, “Statistik Murid Disleksia di Malaysia,” 2017. [Online]. Available:
https://www.mahfuzahzainol.com/single-post/2017/ 12/ 06/Statistik-Murid-Disleksia-d i-Ma laysia. [Accessed: 19-Jan-2018].
[3] M. Vandermosten, F. Hoeft, and E. S. Norton, “Integrating MRI brain imaging studies of pre -reading children with current theories of developmental dyslexia: a review and quantitative meta -analysis,” Curr. Opin. Behav. Sci., vol. 10, no. June, pp. 155–161, Aug. 2016.
[4] Y. Sun, J. Lee, and R. Kirby, “Brain Imaging Findings in Dyslexia,” Pediatr. Neonatol., vol. 51, no. 2, pp. 89– 96, Apr. 2010.
[5] S. I. Dimitriadis et al., “Altered temporal correlations in resting-state connectivity fluctuations in children with
reading difficulties detected via MEG,” Neuroimage, vol. 83, pp. 307–317, Dec. 2013.
[6] P. Tan, W. Sa, and L. Yu, “Applying Extreme Learning Machine to classification of EEG BCI,” in 2016 IEEE International Conference on Cyber Technology in Automation, Control, and Intelligent Systems (CYBER), 2016, pp. 228–232.
[7] M. Vollebregt, “Does EEG‐ neurofeedback improve neurocognitive functioning in children with attention‐ deficit/hyperactivity disorder? A systematic review and a double‐ blind,” J. Child …, 2014. [8] S. Qureshi and S. Vanichayobon, “Evaluate different machine learning techniques for classifying sleep stages
on single-channel EEG,” in 2017 14th International Joint Conference on Computer Science and Software Engineering (JCSSE), 2017, pp. 1–6.
[9] H. Perera, M. F. Shiratuddin, K. W. Wong, and K. Fullarton, “EEG Signal Analysis of Real-Word Reading and Nonsense-Word Reading between Adults with Dyslexia and without Dyslexia,” in 2017 IEEE 30th
International Symposium on Computer-Based Medical Systems (CBMS), 2017, pp. 73–78.
[10] A. Frid, “Differences in phase synchrony of brain regions between regular and dyslexic readers,” in 2014 IEEE 28th Convention of Electrical & Electronics Engineers i n Israel (IEEEI), 2014, pp. 1–4.
[11] M. ParastarFeizabadi, “A Brief Study on EEG Signals of Dysgraphia Children in Relaxing and Writing Moods,” Int. J. Biomed. Res., vol. 4, no. 1, pp. 45–49, 2013.
[12] Z. Mahmoodin, W. Mansor, K. Y. Lee, and N. B. Mohamad, “An analysis of EEG signal power spectrum density generated during writing in children with dyslexia,” in 2015 IEEE 11th International Colloquium on Signal Processing & Its Applications (CSPA), 2015, pp. 156–160.
[13] C. W. N. F. Che Wan Fadzal, L. Y. Khuan, and W. Mansor, “Frequency content analysis of brainwave C3 and P3 for dyslexia related writing disorder,” in Proceedings of 2012 IEEE-EMBS International Conference on Biomedical and Health Informatics, 2012, vol. 25, no. Bhi, pp. 309–312.
[14] T. Gandhi, B. Ketan, and S. Anand, “Neurocomputing A comparative study of wavelet families for EEG signal classification,” Neurocomputing, vol. 74, no. 17, pp. 3051–3057, 2011.
[15] A. Z. A. Zainuddin, K. Y. Lee, W. Mansor, and Z. Mahmoodin, “Optimized KNN class ify rule for EEG based differentiation between capable dyslexic and normal children,” in 2016 IEEE EMBS Conference on Biomedical Engineering and Sciences (IECBES), 2016, pp. 685–688.
[16] A. Zainuddin, W. Mansor, K. Y. Lee, and Z. Mahmoodin, “Performance o f Support Vector Machine in Classifying EEG Signal of Dyslexic Children using RBF Kernel,” Indones. J. Electr. Eng. Comput. Sci., vol. 9, no. 2, pp. 403–409, 2018.
[17] Yong Peng, Jia-Yi Zhu, Wei-Long Zheng, and Bao-Liang Lu, “EEG-based emotion recognition with manifold regularized extreme learning machine,” in 2014 36th Annual International Conference of the IEEE Engineering in Medicine and Biology Society, 2014, no. 2013, pp. 974–977.
No.04CH37541), 2004, vol. 2, pp. 985–990.
[21] S. Ding, N. Zhang, X. Xu, L. Guo, and J. Zhang, “Deep Extreme Learning Machine and Its Application in EEG Classification,” Math. Probl. Eng., vol. 2015, pp. 1–11, 2015.
[22] H. Lu, B. Du, J. Liu, H. Xia, and W. K. Yeap, “A kernel extreme learning machine algorithm based on improved particle swam optimization,” Memetic Comput., vol. 9, no. 2, pp. 121–128, 2017.
[23] Z. Mahmoodin, W. Mansor, K. Y. Lee, and A. Z. A. Zainuddin, “Electroencephalogram electrode localization in the support vector machine classification of dyslexic children,” in 2016 IEEE EMBS Conference on Biomedical Engineering and Sciences (IECBES), 2016, pp. 296–300.