DETERMINANTS OF INFORMATION SYSTEM
EFFECTIVENESS IN MANAGING AGRO-BASED
PROJECTS
Lip-Sam Thi
Universiti Utara MalaysiaChe Wan Muhammed Salleh Bin Wan Adnan
Ministry of Agriculture and Agro-Based Industry, MalaysiaABSTRACT
Previous studies have suggested the use of PMIS is considered to be advantageous towards successful project management. Using the antecedents of system success model proposed by DeLone and McLean, and the updated Information System Success Model (ISSM), this study attempts to examine the implementation of PMIS in agro-based projects undertaken by the Ministry of Agriculture and Agro-based Industry in Malaysia (MoA). The objectives of the study are to examine PMIS effectiveness and identify the determinants that influence system effectiveness. The sample for this study comprised of PMIS end-users from MoA. The findings of this study indicate that PMIS is an effective system to support end users for project management and monitoring activities. Information and service quality have significant relationship with system effectiveness. Between these factors, information quality is found to have the greatest effect on the variation of PMIS effectiveness.
Keywords:PMIS; System Effectiveness; System Quality; Information Quality; Service Quality.
1. INTRODUCTION
The use of Project Management Information Systems (PMIS) is considered to be advantageous to project managers because of the perceived benefits such as timeliness in decision making and ensuring project success (Raymond & Bergeron, 2008). In the context of public sector project management and monitoring in Malaysia, PMS II is the primary PMIS which is currently mandated to be used by all ministries, departments and agencies. The main purpose of PMIS is to provide information system support to the full process of project development and implementation under the Malaysia Five-Year Plan. Focusing primarily on the element to provide information sharing and enhance project
Corresponding author: School of Business Management, College of Business, Universiti Utara Malaysia,
448 Determinants of Information System Effectiveness in Managing Agro-ased Projects
Nonetheless, the annual Auditor General’s Report had identified weaknesses in project monitoring capability among government bodies. This had caused projects delay or projects implementation failures. For example, in year 2011, it was specifically pointed out that public programmes, activities and projects which had failed, were largely due to the lack of monitoring and supervision by the responsible parties (National Audit Department, 2011). The effect of project delays and failures were colossal in monetary terms, not to mention the denied benefits to the target groups who had to wait longer or even being forced to accept sub-standard projects because these projects did not meet the required specifications.
In the case of Ministry of Agriculture and Agro-Based Industry (MoA), 580 projects and programmes valued at Ringgit Malaysia 6.6 billion were registered in PMS II to be implemented under the 10th Malaysia Plan (2010-2015). Although a majority of these
projects had adhered to their planned schedules, some projects had encountered long delays. One of the delayed project that attracted public attention in the Auditor General’s Report recently was the RM300 million Paya Peda Dam project in Besut Terengganu (National Audit Department, 2013), that failed to meet the project datelines.
Past literature has identified various factors that could cause project delays, such as absence of an effective monitoring system, lack of information sharing and, poor communication between stakeholders that subsequently impact on decisions making by the respective authorities (Caniëls & Bakens, 2012). Therefore, an assessment of PMIS can be beneficial to understand its effectiveness and factors that can help to improve current and future project management and monitoring effort.
PMS II is an online, end-to-end project management and monitoring system that utilises collaborative environment in order to provide better management of public development projects (Masrek, 2009). It is one of the Electronic Government (eGovernment) projects under the Multimedia Super Corridor (MSC) flagship programme. PMS II adoption has been made mandatory on 23rd October 2010 through the directive of the National Action
Council in Directive No. 1, 2010, National Action. To date, all ministries, departments and government agencies are obligated to use the system.
Previous literature with regard to study of PMIS towards successful project implementation is limited as echoed by Liberatore et.al (2003). Among these limited studies, little attention has focused on PMIS effectiveness specifically PMS II. A majority of the empirical studies has been largely describing the users’ demographics and functions of the system. This study aims to contribute by examine the effectiveness of PMIS specifically on the implementation of agro-based projects which are often located at rural and geographical disadvantaged regions.
Assessment on information system effectiveness could offer a chance to understand system strength and weaknesses. Subsequently, this can provide a better understanding, and measures can be taken to ensure system objectives can continue to be fulfilled. This will also help in new system development and costs can be justified by the benefits accrue from using the system.
One of the difficult challenges facing information system managers’ is to determine information system effectiveness that will justify its deployment in organisations. Various factors that influence system effectiveness are imperative to sustain information system deployment. Hence, the research questions developed for this study are to determine whether PMIS contributes towards project implementation success and the determinants of PMIS effectiveness. Specifically, this study aims to examine the effectiveness of PMIS in terms of its impacts on project execution and identify the factors that influence PMIS effectiveness.
2. LITERATURE REVIEW
PMIS is an information system to support project management processes. The application of IS in project management using PMIS is possible due to the rapid development of information technology (Raymond & Bergeron, 2008). This development helps to promote a number of generic project management information software such as Microsoft Project, Primavera, Rational Plan, Multi Project and others. This software is used extensively for project management.
450 Determinants of Information System Effectiveness in Managing Agro-ased Projects
2.1. Information System Success and Effectiveness
Past research used a multiple of different measures to describe IS effectiveness, success and user satisfaction (DeLone & McLean, 1992). For example, Doll & Torkzadeh (1988) merge ease of use and information product items to examine users IS satisfaction. Seddon, Staples, Patnayakuni & Bowtell (1999) developed a two-dimensional matrix that includes types of IS used and stakeholders for measuring IS effectiveness. In similar vein, DeLone and McLean (2003) had proposed Information System Success Model (ISSM) to determine IS success. The model incorporates system quality and information quality as antecedents of information system use, leading to individual information system impacts, namely on users and their work (e.g., in regard to their effectiveness) and, subsequently organizational impacts (e.g., in regard to business strategy and performance). Following the rapid development of information and communication technology over the years, DeLone and McLean (2003) had enhanced the ISSM with the addition of “service quality” and, aggregating “individual impacts” and “organizational impact” as “net benefit”. The updated ISSM model is based on six criteria that are used to measure success of an information system. The criteria include system quality, information quality, service quality, system use, user satisfaction and net benefit. The revised ISSM model was used by researchers to examine success and effectiveness of an information system using benefits of information system adoption as surrogate measures to system effectiveness. For example, Lee and Yu (2012) applied the updated ISSM to investigate the success of construction project management information system. Seven factors are being examined which included system quality, information quality, service quality, intention of PMIS use, user satisfaction, impact on efficient construction management and, impact on effective construction management. The study provides empirical support for all seven success measures that are able to explain information system success.
Similarly, Wang and Liao (2008) have adapted DeLone and McLean's ISSM to examine Government to Business (G2B) project management system. The results validated a comprehensive, multidimensional model of eGovernment PMIS success. The six success measures comprised of information quality, system quality, service quality, use characteristics, user satisfaction, and perceived net benefit. The findings suggest that all the six success measures are relevant in explaining eGovernment information system success.
the updated ISSM. The main constructs being examined are the quality of PMIS, quality of information output, use of PMIS, individual impacts and organizational impact of PMIS. PMIS is indeed advantageous to project managers by way of improvement in effectiveness and efficiency in managerial tasks, and enhancing end users’ productivity. PMIS also provided individual with the ability to enhance project performance and has a direct impact on project success. PMIS also contributed to improving budget control and meeting deadlines as well as fulfilling technical specifications of projects (Raymond and Bergeron, 2008).
Caniëls and Bakens (2012) highlighted the effect of PMIS towards decision making in a multi-project environment using model adapted from Raymond and Bergeron (2008). Six constructs are included namely; project overload, information overload, the PMIS information quality, project manager’s satisfaction with PMIS, use of PMIS information and, impact on decision making. The results have shown that project overload is a weak predictor of PMIS information quality. On the other hand, information quality makes a significant contribution to the quality of decisions that determines project success.
2.2. Research Framework
The framework for this study is based on one of the main model in information system literature, namely the updated ISSM (DeLone & McLean, 2003). Relationship between four variables which include system quality, information quality, service quality, and system effectiveness are being investigated. The rationale for referring to the three primary antecedents to system success as proposed in the ISSM model is the fact the model itself is developed through the integration of elements that examine the impact of information system towards individual
and organizational benefits. Furthermore, ISSM has been widely adapted and found to be effective in evaluating the success of various information system deployments, including PMIS.
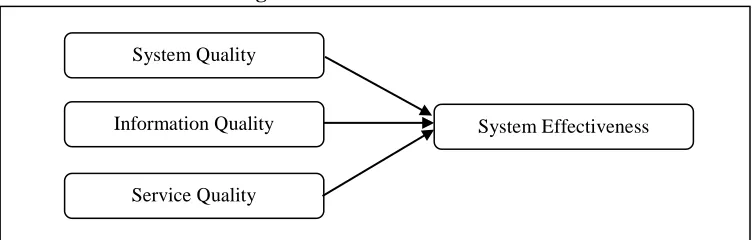
Figure 1: Research Framework
System Quality
Information Quality
Service Quality
452 Determinants of Information System Effectiveness in Managing Agro-ased Projects
The research framework in Figure 1 illustrates the series of causal relationships of the constructs under study. Moving from left to right, the independent variables are system quality, information quality and service quality. The dependent variable is system effectiveness measured in terms of benefits of PMIS in determining successful project execution.
Based on the research questions and framework in Figure 1, the hypotheses for this study are as follow:
H1: There is a significant relationship between system quality and effectiveness of PMIS
H2:There is a significant relationship between information quality and effectiveness of PMIS
H3:There is a significant relationship between service quality and effectiveness of PMIS
3. METHODOLOGY
An online survey is used to gather data to test the hypotheses. As suggested by Dillman (2000), the questionnaire is refined in three stages: Pre-testing with academics and officers from MoA. This is followed by pilot testing with a mailing to 30 randomly selected officers from MoA. The questionnaire is divided into five sections. Section A is to solicit demographic data of the respondents; Section B (Seven items), covers the aspects of system quality; Section C (Five items) covers the aspects of information quality; Section D (Four items) covers the aspects of service quality and; Section E (Five items), solicits repondents’s perception on PMIS effectiveness towards successful project execution.
System effectiveness is operationalised as the perceived impacts of PMIS usage on project success based on conformity to deadlines, budgets, specifications, fulfilment of present project objectives, contributions towards better monitoring and, perceived importance of system. These items are adapted from Raymond & Bergeron (2008) and Clarke (1999).
System quality is operationalised as the desirable characteristics of an information system in term of accessibility, response time, flexibility, ease of use, querying/ report generating ease, learning ease and, integration with other systems. These items are sourced and adapted from works by Caniëls and Bakens (2012), Raymond and Bergeron (2008) and DeLone and McLean (2003).
assurance, empathy, and availability of a proper guidelines. The items used are sourced and adapted from previous works by Pitt et al. (1995) and DeLone and McLean (2003).
Similarly, information quality is operationalised as the desirable characteristics of an information system with respects to availability, relevancy, accurateness, reliability and comprehensiveness of the information the system delivers. The items are sourced and adapted from works by Raymond and Bergeron (2008) and DeLone and McLean (2003).
A multivariate scales from 1 to 4, with anchored ranging from “1-Strongly Disagree” to “4-Strongly Agree,” are used for all questions in Section B, C, D and E. The determination of study sample size is a balance between resources capability and adequate statistical requirement. Roscoe’s (1975) simple rule of thumb suggested that a sample that is larger than 30 and less than 500 is appropriate for most research. The target population for this research is the 180 registered users of PMS II in MOA. They comprised of project engineers, project coordinators, program coordinators, project managers and the management officers who are responsible for the task of planning, implementation, monitoring and evaluation of the various projects. Referring to Krejcie and Morgan (1970), a sample size of 123 subjects will be adequate. However, in order to offset the possibility of a low response return, a total of 180 questionnaires are being distributed to all the registered users. In other words, this is a research being conducted by mean of a population survey on the users of PMS II at MOA.
4. RESULTS AND DISCUSSIONS
4.1. Analysis
From the 180 questionnaires being circulated, 85 were returned. This constitutes to 47.2% response rate. Non response bias was examined using time trend extrapolation (Armstrong & Overton, 1982). The first 30 and last 30 responses were compared on 22 variables and none of the variables were found to be significantly different. This suggested that non response bias was not a significant factor that could affect the conclusions on the variables being studied.
454 Determinants of Information System Effectiveness in Managing Agro-ased Projects
Factor analysis is used to search for dimensions. The items met the conditions for test of factor analysis with a Kaiser-Meyer-Oklin score of 0.725 and Barlett Sphericity of 5.90. The factors were orthogonally rotated with varimax rotation (Kim, 1975). Based on eigenvalues greater than one, four factors were identified and labelled as ‘system quality’, information quality’ ‘system effectiveness’ and ‘service quality”. Reliability analysis were conducted on all four factors namely system effectiveness (SysE), system quality (SysQ), information quality (InfoQ) and service quality (ServQ). All factors were found to have Cronbach alpha of .86 and above, which were considered high (Table 4.1). The results provided confidence for the variables to be used for subsequent analysis (Hair et al., 2010; Sekaran, 2003).
Table 4.1: Cronbach's Alphas of the Study Variables (n = 85)
No. of items Variables Alpha Items dropped
6 SysE .90 Nil
7 SysQ .86 Nil
5 InfoQ .88 Nil
4 ServQ .87 Nil
Notes:SysE = System Effectiveness, SysQ = System Quality, InfoQ = Information Quality, ServQ = Service Quality.
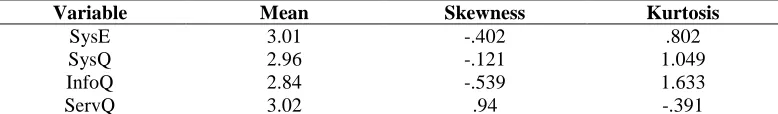
Apart from validity and reliability testing, the basic conditions for statistical inference of data obtained is by ensuring the distribution of the data is normal or close to normal. Normality tests were conducted by using statistical test such as the Kolmogorov test, Shapira - Wilks test, Lilliefors statistics and skewness and kurtosis. In addition, normality can also be identified through the use of graphs such as histograms, stem and leaf plots, box plots and normal probability plots (Chua, 2012). The normality test conducted is based on the skewness and kurtosis method. According to Chua (2012), the value of skewness and kurtosis should be within +/-1.96, for a data set to be normally distributed. The skewness and kurtosis values for system effectiveness, system quality, information quality and service quality were in the range of +/- 1.96, thus could be considered to be normally distributed (Table 4.2).
Table 4.2: Skewness and Kurtosis Value
Variable Mean Skewness Kurtosis
SysE 3.01 -.402 .802
SysQ 2.96 -.121 1.049
InfoQ 2.84 -.539 1.633
ServQ 3.02 .94 -.391
Notes:SysE = System Effectiveness, SysQ = System Quality, InfoQ = Information Quality, ServQ = Service Quality
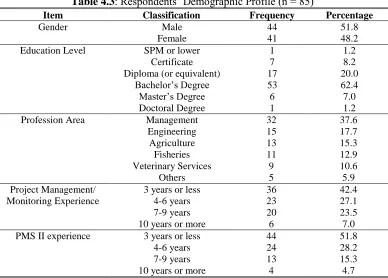
experience in project management and using PMS tools respectively. In terms of profession, 37.6% of the respondents were from the management group while the remaining 62.4% was spread among other professional areas namely; engineering (17.6%), agriculture (15.3%), fisheries (12.9%), veterinary services (10.6%) and others (5.9%). This indicates that the PMS user spectrum at MoA was varied with a near 40:60 ratio proportion represented between the management and other profession areas (Table 4.3).
Table 4.3: Respondents’ Demographic Profile (n = 85)
Item Classification Frequency Percentage
Gender Male 44 51.8
Female 41 48.2
Education Level SPM or lower 1 1.2
Certificate 7 8.2
Diploma (or equivalent) 17 20.0
Bachelor’s Degree 53 62.4
Master’s Degree 6 7.0
Doctoral Degree 1 1.2
Profession Area Management 32 37.6
Engineering 15 17.7
Agriculture 13 15.3
Fisheries 11 12.9
Veterinary Services 9 10.6
Others 5 5.9
Project Management/ Monitoring Experience
3 years or less 36 42.4
4-6 years 23 27.1
7-9 years 20 23.5
10 years or more 6 7.0
PMS II experience 3 years or less 44 51.8
4-6 years 24 28.2
7-9 years 13 15.3
10 years or more 4 4.7
Table 4.4: Correlations between Variables System Quality, Information Quality, Service Quality and System Effectiveness
SysE SysQ InfoQ ServQ
SysE 1.00
SysQ 0.454** 1.00
InfoQ 0.657** 0.637** 1.00
ServQ 0.576** 0.680** 0.529** 1.00 Notes: SysE = System Effectiveness, SysQ = System Quality, InfoQ = Information Quality, servQ = Service Quality. **Correlation is significant at the 0.01 level (2-tailed).
456 Determinants of Information System Effectiveness in Managing Agro-ased Projects
in Table 4.4 indicate the independent variables have significant relationship with the dependent variable. Both information quality and service quality had high correlation with system effectiveness, while system quality showed a moderate correlation with the dependent variable. The highest correlation r=.680 (p<.01) was between system quality and service quality. In addition, high correlation was also found (p<.01) r=.657 between information quality and system effectiveness.
4.2 Hypothesis Testing
Having ascertained there were correlations between system quality, information quality and service quality with system effectiveness, regression analysis was used to test the model and identified variables that might influence PMIS effectiveness namely; system quality, information quality and service quality. Results of the analysis were shown in Table 4.5, 4.6 and 4.7.
Table 4.5: Model Summary
R R Square Adjusted R Square Std. Error of the Estimate
1 .718a .516 .498 .40766
Notes: Predictors: (Constant), ServQ, InfoQ, SysQ; Dependent Variable: SysE.
Table 4.6: ANOVA Table
Sum of Squares df Mean Square F Sig.
Regression 14.360 3 4.787 28.803 .000a
Residual 13.461 81 .166
Total 27.822 84
Notes: Predictors: (Constant), ServQ, InfoQ, SysQb; Dependent Variable: SysE.
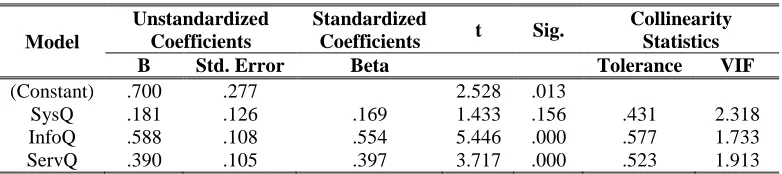
Table 4.7: Coefficients Table
Model
Unstandardized Coefficients
Standardized
Coefficients t Sig.
Collinearity Statistics B Std. Error Beta Tolerance VIF
(Constant) .700 .277 2.528 .013
SysQ .181 .126 .169 1.433 .156 .431 2.318
InfoQ .588 .108 .554 5.446 .000 .577 1.733
ServQ .390 .105 .397 3.717 .000 .523 1.913
Note: Dependent Variable: SysE.
variable. Therefore, it was sufficed to conclude that 51.6% of the variance in system effectiveness could be explained by the independent variables.
The highest standardized beta coefficient value was linked to information quality (0.554) with a significant level of 0.001. This suggested information quality was the strongest predictor of system effectiveness and any changes in information quality would have the most impact on the variance on system effectiveness. Tolerance value for all the variables were p>0.10 and VIF value of less than 10 thus, suggesting that the variables did not encounter
any multicollinearity issues. Based on the regression analysis results, the hypotheses testing results are summarised as follows (see Table 4.8).
Table 4.8: Summary of the Hypotheses Testing Results
No. Hypotheses Results
1. There is a significant relationship between system quality and
effectiveness of PMIS. Not Supported
2. There is a significant relationship between information quality and
effectiveness of PMIS. Supported
3. There is a significant relationship between service quality and
effectiveness of PMIS. Supported
5. DISCUSSIONS
The purpose of this study is to investigate the relationship between system quality, information quality and service quality on PMIS effectiveness. Results revealed that both information quality and service quality are positively related to system effectiveness. On the other hand, no significant relationship is found between system quality and system effectiveness. As pointed out by Field (2005), caution must be taken when interpreting correlation coefficients that did not indicate the direction of causality and the tertium quid or commonly known as third-variable problem. Nonetheless, the non-significant relationship concurred with previous research by Lee and Yu (2012) that highlighted that maintaining a minimum level of system operation quality is sufficient to ensure performance of basic system functions. This implies that constant upgrades on system infrastructure, hardware and software may not improve the overall effectiveness of PMIS, therefore, result in waste of resources.
458 Determinants of Information System Effectiveness in Managing Agro-ased Projects
factors. The factor that has the most influence is information quality input into the system itself. Hence, to further strengthen the effectiveness of PMIS, continuous assessment and improvement efforts should be focused on the enhancing the quality of information in terms of its accuracy, timeliness, concise and up-to-date information used as system input. In similar vein, service quality in terms of prompt technical support during system operation and maintenance, should not be overlooked in order to enhance overall effectiveness of PMIS. The results indicate that PMIS has a significant impact on successful project implementations. This is in tandem with findings by Raymond and Bergeron (2008), who has suggested that PMIS is significant towards enhancing project manager performance and project success through the improvement of budget control, meeting project deadlines as well as fulfilling projects technical specifications.
5.1. Policy Implications
The policy implications for IT governance bodies are to ensure that initiatives to improve PMIS have positive impact on system effectiveness. Information system planners need detailed information about use of PMIS and the usage objectives by various agencies. Ideally, information system planners need to look into formal procedures that can produce efficiency gains by systematic identification of strategic issues related to system effectiveness. Information accuracy, up-to-date information and timeliness of information, provide important input for operational, tactical and strategic decisions making by end users. Regular system upgrading of hardware and software could be a waste of valuable resources without feedback from end users. Gains in efficiency accruing from procedures need to be balanced against reduction in flexibility or an increase in costs of systems upgrade.
In similar vein, post system implementation activities such as system maintenance, support and system operation by service providers and IT department personnel to both system and end-users can also ensure PMIS efficiency and effectiveness. Information system vendors and consultants with good knowledge and expertise, will enable PMIS to operate according to system’s design and specifications.
5.2. Summary
REFERENCES
Armstrong, J. S., & Overton, T. A. (1982). Estimating Nonresponse Bias in Mail Surveys in Marketing Research: Applications and Problems. In: K. J. Arun, P. Christian & B. T. Ratchford (Eds.), Marketing research applications and problems.Chichester: John Wiley.
Atkinson, R. (1999). Project management: Cost, time and quality, two best guesses and a phenomenon, it’s time to accept other success criteria. International Journal of Project Management, 17(6), 337-342.
Caniëls, M. C., & Bakens, R. J. (2012). The effects of project management information systems on decision making in a multi project environment. International Journal of Project Management, 30(2), 162–175.
Chua, Y. P. (2012). Kaedah dan statistik penyelidikan: Asas statistik penyelidikan buku 2. (2nd Edition) Kuala Lumpur: McGraw Hill (Malaysia).
Clarke, A. (1999). A practical use of key success factors to improve the effectiveness of project management. International Journal of Project Management, 17(3), 139-145.
Davis, F. D. (1989). Perceived usefulness, perceived ease of use, and user acceptance of information technology. MIS Quarterly,13(3), 319–339.
DeLone, W. H., & McLean, E. R. (1992). Information system success the quest for dependent variable. Information Systems Research, 3(1), 60-95.
DeLone, W. H., & McLean, E. R. (2003). The DeLone and McLean model of information systems success : A ten-year update. Journal of Management Information System, 19(4), 9–30.
Dillman, D. A. (2000) Mail and Internet Survey: The Tailored Design Method. New York: John Wiley.
Doll, W. J., & Torkzadeh, G. (1988). The measurement of end user computing satisfaction. MIS Quarterly, 12(2), 259-274.
Field, N. (2005). Discovering Statistics Using SPSS (2nd Edition). London: Sage.
Hair, J. F., Black., W. C., Barry, J. B., & Anderson, R. E. (2010). Multivariate Data Analysis (7th Edition). New Jersey: Prentice Hall.
Kim, J. (1975) Factor Analysis. In H. Norman (Eds.), Statistical Package for the Social Sciences. New York: McGraw Hill.
Krejcie, R. V., & Morgan, D. W. (1970). Determining sample size for research activities. Educational andPsychological Measurement, 30(3), 607-610.
Lee, S.-K., & Yu, J.-H. (2012). Success model of project management information system in construction. Automation in Construction, 25, 82–93.
Liberatore, M. J., & Pollack-Johnson B. (2003). Factors influencing the usage and selection of project management software. IEEE Transportation Engineering Management, 50(2), 164–74.
Masrek, M. N. (2009). Reinventing public service delivery : The case of public information systems implementation in Malaysia. International Journal of Public Information Systems, 5(1) 9–15.
460 Determinants of Information System Effectiveness in Managing Agro-ased Projects
Murphy, D., Baker, N., & Fisher, D. (1974). Determinants of Project Success. Boston: Boston College, National Aeronautics and Space Administration.
National Audit Department of Malaysia. (2011). Auditor General’s Report 2011.
Putrajaya: National Audit Department of Malaysia.
National Audit Department of Malaysia. (2013). Auditor General’s Report 2013. Putrajaya: National Audit Department of Malaysia.
Pinto, J. K., & Slevin, D. P. (1988). Project success: Definitions and measurement techniques. Project Management Journal, 19(1), 67–72.
Pitt, L. F., Watson, R. T., & Kavan, C. B. (1995). Service quality: A measure of information systems effectiveness. MIS Quarterly,19(2), 173–187.
Raymond, L., & Bergeron, F. (2008). Project management information systems: An empirical study of their impact on project managers and project success.
International Journal of Project Management, 26(2), 213–220. Rogers, E. M. (1962). Diffusion of Innovations. New York: The Free Press.
Roscoe, J. T. (1975). Fundamental Research Statistics for the Behavioural Sciences (2nd
Edition). New York: Holt Rinehart & Winston.
Seddon, P. B., Staples, S., Patnayakuni, R., & Bowtell, M. (1999). Dimensions of information systems success. Communications of the Association for Information Systems,2(20), 2-9.
Sekaran, U. (2003). Research Method for Business: A skill building approach (4th
Edition). Illinois, U.S.A: John Wiley & Sons Ltd.
Sekaran, U., & Bougie, R. (2009).Research methods for business: A skill building approach. United Kingdom: John Wiley & Sons Ltd.
Wang, Y. S., & Liao, Y. W. (2008). Assessing eGovernment systems success: A validation of the DeLone and McLean model of information systems success.