DOI: http://dx.doi.org/10.15282/ijsecs.3.2017.6.0028
88
A NEW FRAMEWORK FOR PREDICTING THE IMPACT OF TRAFFIC ON THE PERFORMANCE OF MOBILE AD-HOC NETWORK (MANET): USING
REGRESSION AS DATA MINING APPROACH Kamal Moh’d Alhendawi
Al-Quds Open University, Gaza, Palestine
e-mail: [email protected] or [email protected]
ABSTRACT
With the rapid technological advances in wireless communication and the increasing of usage of portable computing devices, it is expected that mobile ad hoc networks are increasingly developed towards enhancing the flexibility, scalability and efficiency of communication technology. The wireless ad-hoc network is a collection of mobile nodes in which these nodes have the ability to connect each other without backbone infrastructure (i.e. infrastructure less). Although many studies have been done on the performance assessment of MANET routing protocols, there is a need for investigating the impact of traffic load on the performance of MANET in order to justify the use of some routing protocol in MANET. This study is one of the fewest that aims at proposing a new framework towards predicting and validating the results of future scenario using data mining techniques. The regression analysis is used as data mining method in the prediction of the future scenarios. Practically, two experiments with eight scenarios are conducted. The findings indicate that the network size and traffic loads are proportionally related to the throughput. However, the findings show that the network size is inversely related to the delay in case of medium FTP traffic, and proportionally related in case of high FTP traffic. The results also indicate that data mining approach specially regression is an effective approach towards the prediction of the future network behavior.
Keywords: MANET; Mobility; Ad hoc network; Prediction model; Regression analysis; Traffic; Delay; Performance metrics.
INTRODUCTION
89
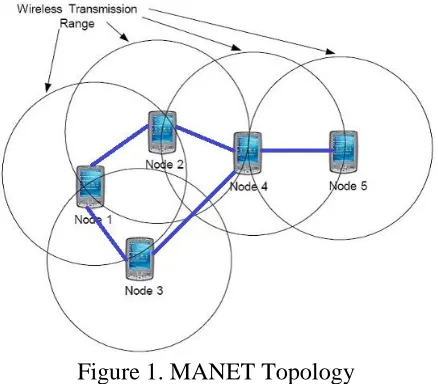
Figure 1. MANET Topology
According to Murty & Das (2011), the routing protocols of the ad-hoc network can be divided into two types: on demand protocols and proactive protocols. On demand routing protocol explore the route update when the route is required. However, the proactive routing protocols periodically update the routing information in order to disseminate topology updates on the network. Most of previous studies indicated the importance of network transmission metrics including traffic, delay and throughput in the evaluation of the network performance (Saad and Zukarnain , 2009; Rohankar et al., 2012; Cheng et al., 2013; Murty & Das, 2011). With regard to the performance metrics, the most commonly used measures are network Packet Delivery Ratio, delay, and throughput (Rohankar et al., 2012; Shah et al., 2008).
Since the topology of ad-hoc network has dynamic changes, investigating the impact of traffic on the performance of the network becomes increasingly required (Murty & Das, 2011; Cheng et al., 2013). Additionally, the previous studies discussed the impact of traffic on the network performance (Murty & Das, 2011; Saad and Zukarnain, 2009), they did not provide a flexible mathematical mechanism to minimize the huge number of the required experiments and scenarios. Furthermore, the published researches did not provide a comprehensive method to validate the accuracy of the obtained findings. Thus, the findings that are extracted after conducting simulation might be biased or give inaccurate implications.
For these reasons, this study is one of the fewest that focuses on simulating several scenarios in an effort to investigate the influence of traffic on ad-hoc network performance, and also, minimizes the scenarios through predicting the results of scenarios using data mining techniques, specially, the regression analysis. This study also provides a new theoretical framework for evaluating, predicting and validating the performance metrics (i.e. delay and throughput).
Theoretical Foundations and Related Work
90
in order to cover the concepts and terminologies of performance factors in addition to the essential information concerning the environment of wireless mobility models.
Performance Metrics
Currently, evaluating the performance of mobile ad hoc network (MANET) is considered as an active area of research and it is still under discussion because many parameters factors could affect the performance of MANET. The primary focus of this study is to evaluate and validate the influence of traffic on the performance of MANET. To decide on the performance, it is essential to use standard metrics such as Average routing overhead, Packet delivery ratio, end-to-end delay, and throughput (Mutry & Das, 2011; Sanjay et al., 2009).
Packet Delivery Ratio (PDR)
The number of data packets sent from the source to the number of received at the destination.
PDR = (control packets sent-delivery packet sent) /control packets sent (1)
Average routing head(ARH)
Ad hoc networks are intended to be scalable. As the network grows, a variety of routing protocols perform differently. The amount of routing traffic increases as the network grows. Therefore, it is considered as a measure of the scalability of the protocol, and thus the network. Average routing overhead is the total number of routing packets divided by total number of delivered data packets expressed in bits per second or packets per second.
ARH=Total no of routing packets/Total no of delivered data packets (2)
Average End-to-End Delay(AEED):
It consists of all the delays in the network such as buffer queues, transmission time and delays induced by routing activities and MAC control exchanges. Average End-to-End delay (seconds) is the average time it takes a data packet to reach the destination.
AEED =∑ (time packet recevied−time packet sent) 𝑡𝑜𝑡𝑎𝑙 𝑛𝑜 𝑜𝑓 𝑝𝑎𝑐𝑘𝑒𝑡𝑠 𝑟𝑒𝑐𝑒𝑖𝑣𝑒𝑑 𝑛
𝑘=0
(3)
Throughput:
91
Mobility Models
The mobility model is designed to illustrate the movement pattern of mobile users, and how their location, velocity and acceleration vary over time. Since mobility patterns may play an important role in specifying the protocol performance, it is desirable for mobility models to emulate the movement pattern of targeted real life Applications in a reasonable way. The details of three popular mobility models are given below in order to demonstrate how the mobile nodes emulate the real world scenario (Rohankar et al., 2012):
Random Waypoint
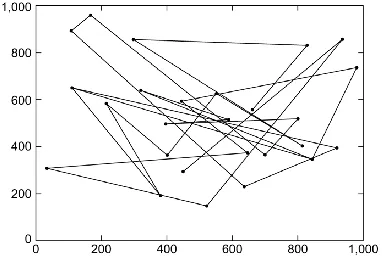
Divecha et al. (2007) pointed out that the Random Waypoint model is the most popular model used in mobility research community. At every instant, a node randomly chooses a destination and moves towards it With a velocity selected randomly from a uniform distribution [0,V_max], where V_max is the maximum allowable velocity for every mobile node. The node stops for a period of time identified by the ‘pause time’ parameter after reaching the destination. It also considered as the basis for establishing the other mobility models (Quispe & Galan, 2014; Pazand et al., 2007). Figure 2 shows the movement of mobile node.
Figure 2. Random Waypoint Mobility Model
Random Walk Mobility Model
92
Figure 3. Random Walk Mobility Model
Random Direction Mobility Model
In this mobility model, the mobile node utilizes the Random Waypoint Mobility Model in choosing the new destinations. There is a high probability for selecting a new destination located in the center of the simulation area, or requires travel through the middle of the simulation area. Figure 4 illustrates the trend of random direction mobility model ( Pazand et al., 2007).
Figure 4. Random Direction Mobility Model
As an alternative classification, the mobility models can be differentiated based on different kinds of dependencies and restriction that are considered as shown in Table 1.
Table 1. The mobility models of MANET
Term Definition
Random Models There are neither dependencies nor any other restrictions modeled which are similar to RWP model.
Model with Temporal Dependency
The mobile nodes tend to travel in a correlated manner
Model with Spatial Dependency
The actual movement of a node is influenced by the nodes around it.
Models with Geographic Restriction
93
Regression Data mining Approach
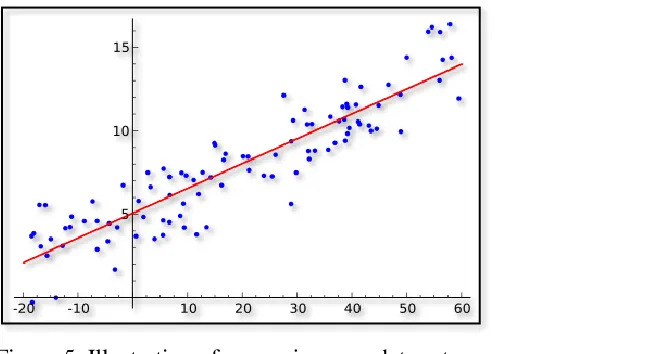
Based on literature review (Ahmed, 2004; Giraud-Carrier and Povel, 2003; Turban et al., 2007; Ngai et al., 2009), there are several data mining model that could be provided by data mining techniques where classification, clustering, regressions and forecasting are examples on the data mining models. In statistical modelling, regression analysis is a statistical process for approximating the relationships between variables including independent and dependent variables where the independent variables have the role of predictors (Field, 2009). Accordingly, regression analysis is broadly used for prediction. Regression analysis is also employed in recognizing how independent variables are related to the dependent variable, and to explore function which models the data with the least error (Field, 2009).
Figure 5. Illustration of regression on a data set
Figure 5 shows the regression on a data set depending on the function: Y = ƒ (X, β); where the regression model relates Y to a function of X and β.
RELATED WORK
Hinds et al. (2013) conducted a comparison between the routing protocols in MANET in order to determine the optimal protocol that can operate on MANET. Shah et al. (2008) evaluate the performance of ad-hoc routing protocols using simulation. Network load, mobility, and network size are used as parameters for the simulation.
Cheng et al. (2013) focused in his study on the basic MANET topology and algorithms with special attention to the routing protocols used in the Video streaming Network (VANET) including single and multipath routing protocols.
94
Rohankar et al. (2012) analyzed the performance of the routing protocols for random mobility in the mobile ad-hoc network. Performance is analyzed in terms of end-to-end delay, throughput and Packet delivery ratio for varying node densities.
Based on literature review, the simulation studies mostly used the random waypoint as a model of mobility (Quispe & Galan, 2014; Rohankar et al., 2012). Further, the most wireless communication technology is Bluetooth or IEEE 802.11. To provide accurate results, the simulation setting should consider encouraging results and recommendation of the previous related work in selecting the mobility model and network topology. More details regarding the simulation settings are provided in section 5.
PROPOSED FRAMEWORK AND METHODOLOGY
To evaluate the impact of traffic on the performance of ad-hoc network, two experiments with six scenarios are performed where each experiment considers the variety of the traffic within a fixed number of mobile stations (i.e. Traffic FTP). The first experiment assumes medium FTP traffic while FTP traffic in the second experiment is supposed to be high. Figure 6 reveals the proposed framework which demonstrates the methodological steps followed by the research toward evaluating the effects of traffic on performance.
Comparison Data Mining Prediction
Regression Analysis
Design the Experiments
Simulation configurations
Extracting the values(Throughput
and delay)
Input metrics for Predicting Scenarios
Estimating Results (Regression Analysis
)
Extracting the Predicted values (Throughput and delay)
95
Figure 6. The proposed Framework for predicting the performance of Mobile Ad-hoc Net The first step is to decide regarding the design of experiments and scenarios. In the second step the simulation parameters should be identified (see next section). In the third step, the simulation is conducted, and therefore, the simulation results are extracted. In the fourth and fifth steps, the data mining method namely, regression analysis is used in order to estimate the results of the future scenarios. In the sixth step, the results of regression analysis are extracted. Finally, a set of simulation results are compared with the prediction results to measure the effectiveness of using data mining in the prediction (regression analysis).
Simulation assumptions
This study is mainly concerned with three parameters such as traffic sent, delay and throughput. Moreover, two experiments are actually used with different number of nodes (10, 20 and 30 respectively). Table 2 shows the parameters values that should be input as a simulation’s settings or configurations.
Table 2. Simulation settings
Statistic Value
Simulator OPNET 14.5
Routing Protocols AODV
802.11 data rate 11 Mbps
Node 10, 20, 30
Scenario Size 3.5*3.5 km
Application Traffic FTP
Simulation Time 60 min
Channel Type Wireless channel
Network Interface Type Phy/WirelessPhy
Performance Parameter Throughput, Delay, Network Load
Model Random waypoint
EXPERIMENTAL RESULTS
The simulations consist of two experiments with 6 scenarios and they concerned with investigating the impact of traffic load on the performance of mobile ad-hoc network. The two experiments use the same protocol namely, AODV. The simulations focus on two performance metrics including delay and throughput.
Experiment #1
96
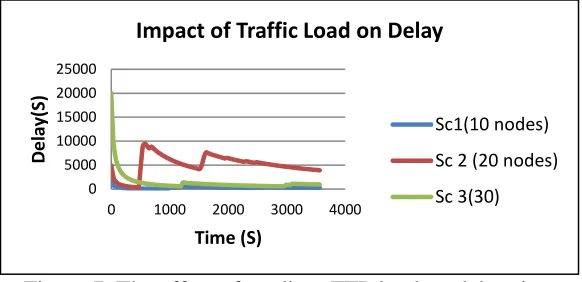
Figure 7. The effect of medium FTP load on delay time
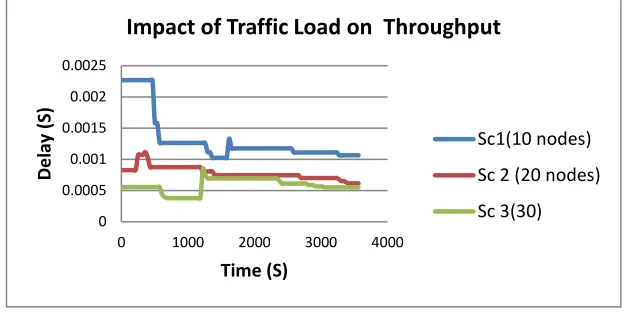
Regarding the throughput, the findings show that throughput deceased as number of nodes increased. Figure 8 reveals the impact of medium FTP traffic on the throughput.
Figure 8. The effect of medium FTP load on throughput
Experiment #2
In experiment 1, the simulation assumes that all nodes have a High FTP traffic. It consists of three scenarios in accordance with number of mobile nodes (10, 20, and 30). The findings indicated that the delay time decreased as number of nodes increased. Figure 9 shows the impact of high FTP traffic on the delay time.
Figure 9. The effect of medium FTP load on delay time 0 5000 10000 15000 20000 25000
0 1000 2000 3000 4000
D
e
lay
(S)
Time (S)
Impact of Traffic Load on Delay
Sc1(10 nodes)
Sc 2 (20 nodes)
Sc 3(30) 0 0.0002 0.0004 0.0006 0.0008 0.001
0 1000 2000 3000 4000
Th ro u gh p u t (b p s) Time (S)
Impact of Traffic Load on Throughput
Sc1(10 nodes)
Sc 2 (20 nodes)
Sc 3(30) 0 10000 20000 30000 40000 50000
0 1000 2000 3000 4000
Th ro u gh Pu t (b p s) Time (S)
Impact of Traffic Load on Delay
Sc1(10 nodes)
Sc 2 (20 nodes)
97
Based on figure 10, the findings demonstrated that the throughput decreased as number of nodes increased.
Figure 10. The effect of high FTP load on throughput
PREDICTING THROUGHPUT OF MANET (USING DATA MINING)
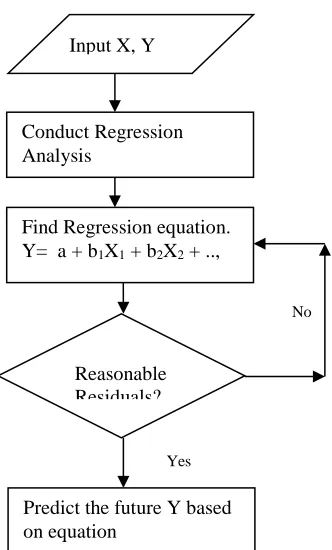
As the simulation requires too many scenarios in order to consider the results, it is important to find an alternative data mining approach for predicting the future scenarios results. One of the methods that could be used is the regression analysis. In this study, the author keeps focus on throughput prediction.
To do so, the mean of scenarios for 10, 20, and 30 nodes are calculated. Secondly, the regression function is utilized toward predicting forecasting the relationship between the FTP traffic and the performance metrics (i.e. throughput) in order to predict the value of throughput. Therefore, it is important to build the mathematical equation of regression function and also it is essential to find the regression coefficients. As this study concerned with the effect of independent variable (x: Network size) on the dependent (y: Throughput), it seems that the linear regression is most appropriate tool in prediction which is expressed in the following equation:
So, the obtained value is actually an estimate for the average of the throughput, and therefore, the accuracy of estimation is reasonable. Figure 11 shows the mechanism of prediction for the throughput using regression analysis as a data mining technique.
0 0.0005 0.001 0.0015 0.002 0.0025
0 1000 2000 3000 4000
D
e
lay
(S)
Time (S)
Impact of Traffic Load on Throughput
Sc1(10 nodes)
Sc 2 (20 nodes)
Sc 3(30)
Y = a + bX,
where X is the explanatory variable and,
98
Figure 11. The prediction process of throughput based on the network size
In the following two sub section the researcher followed the proposed methodology in Figure 11 in order to extract and validate the prediction of the throughput values.
Experiment # 1
Based on Table 3, the mean values of the delay along with number of nodes for the first experiment is as follows:
Table 3. The throughput simulation values
After finding the actual throughput value, these values should be represented through linear regression in order to find the regression coefficients and predict the value of the throughput. Figure 12 illustrates the linear regression of the throughput values.
Nodes Throughput(bps) 10
0.000667572 20
0.000541831 30
0.000364902
Input X, Y
Conduct Regression Analysis
Find Regression equation. Y= a + b1X1 + b2X2 + ..,
Predict the future Y based on equation
Reasonable Residuals?
Yes
99
Figure 12. The regression of network size on throughput
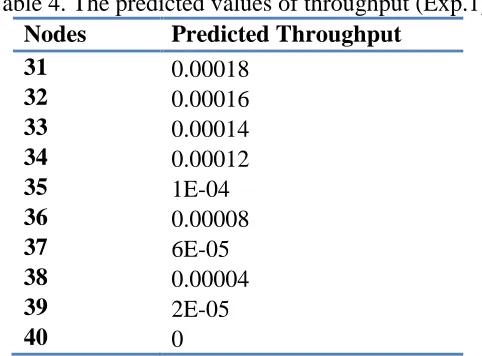
The result of regression analysis provides a regression equation (y = -2E-05x + 0.0008) and this equation is used to predict the values of the throughput for the nodes from 31 to 40.
Table 4. The predicted values of throughput (Exp.1)
Nodes Predicted Throughput
31 0.00018
32 0.00016
33 0.00014
34 0.00012
35 1E-04
36 0.00008
37 6E-05
38 0.00004
39 2E-05
40 0
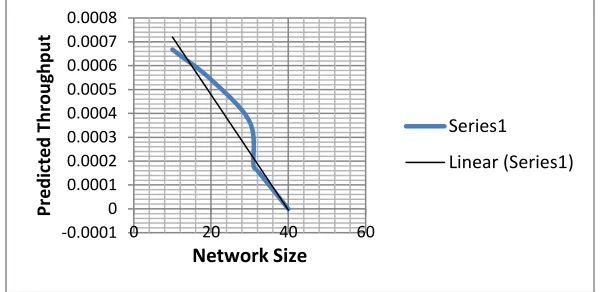
As important point Table 4 shows that the prediction stop at 40 because after this number the throughput becomes zero as the network traffic load will be very high. Figure 13 represent the predicted values throughput in comparison with the linear regression.
y = -2E-05x + 0.0008 R² = 0.9906
0 0.0002 0.0004 0.0006 0.0008
0 10 20 30 40
Avg (Throuput)
Avg (Throuput1)
Linear (Avg (Throuput1))
100
Figure 13. The throughput predicted values VS the actual values
Nothing can flow an exact linear pattern even in the time series or not. The blue line, which reveals the distribution of the predicted values, shows that the predicted values are closed to the regression line and it takes the oval shape. Also, the residual within the acceptable range and has a reasonable level of linearity (Field, 2009). Thus, the linear regression is successfully predicting the linear relationship.
Experiment # 2
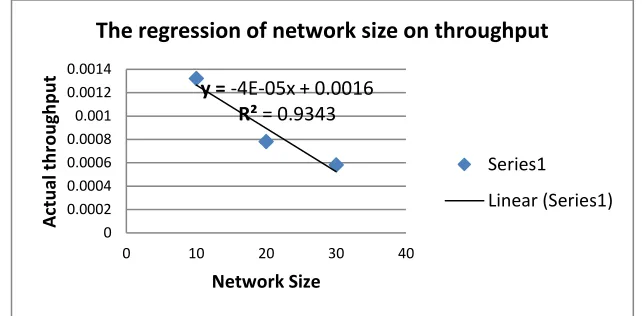
Table 5 demonstrates the mean values of the throughput along with number of nodes as follows:
Table 5. The throughput values
Nodes Throughput(bps)
10 0.0013218
20 0.000781323
30 0.000581088
After finding the actual throughput value, these values should be represented through linear regression in order to find the regression coefficients and predict the value of the throughput. Figure 14 illustrates the linear regression of the throughput values.
-0.0001 0 0.0001 0.0002 0.0003 0.0004 0.0005 0.0006 0.0007 0.0008
0 20 40 60
Pr
e
d
ic
te
d
Th
ro
u
gh
p
u
t
Network Size
Series1
101
Figure 14. The regression of Network size on the throughput (Exp2)
The result of regression analysis provides a regression equation (y = -4E-05x + 0.0016) and this equation is used to predict the values of the throughput for the nodes from 31 to 40.
Table 6. The predicted values of the throughput
Nodes Predicted Throughput
31 0.00036
32 0.00032
33 0.00028
34 0.00024
35 0.0002
36 0.00016
37 0.00012
38 0.00008
39 4E-05
40 0
As important point the prediction stop at 40 because after this number the throughput becomes zero as the network traffic load will be very high. Figure 15 represent the predicted values throughput in comparison with the linear regression.
y = -4E-05x + 0.0016 R² = 0.9343
0 0.0002 0.0004 0.0006 0.0008 0.001 0.0012 0.0014
0 10 20 30 40
A
ctu
al
t
h
ro
u
gh
p
u
t
Network Size
The regression of network size on throughput
Series1
102
Figure 15. The throughput predicted values VS actual values
The blue line shows that the predicted values have an acceptable range of residual as the predicted values are closed to the regression line.
Comparing the two experiments
In an effort to compare the results in the two experiments, Figure 16 illustrates the difference in the throughput based on the variety of the FTP traffic.
Figure 16. The comparison of the throughput for experiments 1&2
Based on Figure 16, it is clear that the throughput has a proportional relationship with the network size. Also, it is indicated that the throughput reduction in case of experiment1 has slow trend than that of experiment 2. This is because of the high traffic in experiment 1. Generally, the trend of the predicted values in the two regression models is approximately similar.
DISCUSSION
Based on the simulations results, it can be inferred that the network size has reverse relationships with throughput and delay in case of medium traffic, and this makes sense as the network has many mobile stations and there is no congestion. Even this result has
-0.0005 0 0.0005 0.001 0.0015
0 20 40 60
Th
ro
u
gh
p
u
t
(p
re
d
ic
te
d
)
Network Size
Avg(Th)
Linear (Avg(Th))
0 0.0002 0.0004 0.0006 0.0008 0.001 0.0012 0.0014
0 10 20 30 40 50
103
a logic, sense and systematic justification, it doesn’t support the findings obtained by Pal and dhir (2013).
However, in case of high FTP traffic, the network size has a proportional relationship with the delay, and this seems to be correct as the network might have high congestion or collisions. This result is in agreement with many related studies such as (Murty & Das, 2011; Cheng et al., 2013; Chaki& Chaki, 2014).
Concerning experiment 1, the results indicates that (R2 = 99.06%) which means the independent variable (i.e. no of nodes) highly contribute to the MANET throughput as number of nodes explains 93.4% of total variances in the throughput. Additionally, based on Figure 13, the residuals are within the acceptable range. Consequently, the prediction model represented by the equation (Y= -2E-05x + 0.0008) has a reasonable contribution in the prediction of the results of the future scenarios in case of having medium FTP load.
With regard to experiment 2, the results shows the (R2 = 0.9343) which means the independent variable (i.e. no of nodes) highly contribute to the MANET throughput as number of nodes explains 93.4% of total variances in the throughput. Moreover, based on Figure 15, the residuals are within the acceptable range. Therefore, the prediction model (Y = -4E-05x + 0.0016) has a reasonable contribution in the prediction of the future performance (throughput) in case of having high FTP load.
In addition, the similarity of the trends of the regression models in the two experiments provides evidence on the consistency of the prediction models. The results also emphasize the relationship between the network size and throughput, as the previous studies were also indicated the proportional relationship.
As evidence on the suitability of linear regression in predicting the relationship between network load and throughput, the predicted values are closed to the regression line and it takes the oval shape. The residuals within the acceptable range and have reasonable level of linearity (Field, 2009). Thus, the linear regression is successfully predicting the linear relationship.
Finally, it can be inferred that this study contributes to the related studies as it discuss three important issues (i.e. the effect of network size, traffic and forecasting future performance) which are still under discussion. Above all, the findings provide an evidence on the validity of the proposed conceptual framework and prediction method.
CONCLUSION
104
mentioning that the current study also develops a new conceptual model for the prediction of the results of the scenario simulations. The developed prediction models are obtained using the data mining techniques, specially the regression analysis. The encouraging results indicate that network size and FTP traffic are proportionally correlated with throughput. Furthermore, the results demonstrated that the delay time is inversely related to network size in case of medium traffic. In case of large traffic, it is found that the network size is proportionally related to the delay time. As a future research direction, it is suggested to test the validity of the proposed conceptual framework, and also, it is important to verify the relationship between network size, delay and throughput for other mobility models or routing protocols. Finally, based on the encouraging results, it is expected that this study contribute to the related empirical studies.
REFERENCES
Ahmed, S.R. (2004). Applications of data mining in retail business. Proceedings of the International Conference on Information Technology: Coding and Computing, 455-459.
Chaki N, Chaki R. (2014). Intrusion Detection in Wireless Ad-hoc Networks. 1st ed.CRC Press.
Cheng, X., Huang, X., & Du, D. Z. (Eds.). (2013). Ad hoc Wireless Networking (Vol. 14). Springer Science & Business Media.
Divecha, B., Abraham, A., Grosan, C., & Sanyal, S. (2007). Impact of node mobility on MANET routing protocols models. Journal of Digital Information Management, 5(1), 19.
Field, A. (2009). Discovering Statistics Using SPSS (3 ed.). London: Sage Publications Limited.
Giraud-Carrier, C. and O. Povel (2003). Characterising data mining software. Intell. Data Anal., 7: 181-192.
Hinds, A., Ngulube, M., Zhu, S., & Al-Aqrabi, H. (2013). A review of routing protocols for mobile ad-hoc networks (MANET). International Journal of Information and Education Technology, 3(1), 1.
Murty, M. S., & Das, M. V. (2011). Performance evalution of MANET routing protocols using reference point group mobility and random waypoint models. International Journal of ad hoc, sensor & Ubiquitous computing, 2(1), 33-43.
Ngai, E.W.T., L. Xiu and D.C.K. Chau (2009). Application of data mining techniques in customer relationship management: A literature review and classification. Expert Syst. Applic., 36, 2592-2602.
Pal, N., & Dhir, R. (2013). Analyze the Impact of Mobility on Performance of Routing
Protocols in MANET Using OPNET Modeller. International Journal of advance
research in computer science and software engineering, 3(6).
105
Quispe, L. E., & Galan, L. M. (2014). Behavior of Ad Hoc routing protocols, analyzed for emergency and rescue scenarios, on a real urban area. Expert Systems with Applications, 41(5), 2565-2573.
Rohankar, R., Bhatia, R., Shrivastava, V., & Sharma, D. K. (2012). Performance analysis of various routing protocols (proactive and reactive) for random mobility models of Adhoc networks. Proceedings of the Recent Advances in Information Technology (RAIT).
Saad, M. I. M., & Zukarnain, Z. A. (2009). Performance analysis of random-based mobility models in MANET routing protocol. European Journal of Scientific Research, 32(4), 444-454.
Sanjay Kumar, P., Prasant Kumar, P., Puthal, B.: Review of routing protocols in sensor and adhoc networks. International Journal of Reviews in Computing © 2009-2010 IJRIC (2009-2009-2010)
Shah, S., Khandre, A., Shirole, M., & Bhole, G. (2008). Performance evaluation of ad hoc routing protocols using NS2 simulation. Proceedings of the Conf. of Mobile and Pervasive Computing.