A Systematic Study of Impurity Ion Poloidal Rotation and
Temperature Profiles Using CXRS in the TJ-II Stellarator
Jose M. CARMONA, Kieran J. MCCARTHY, Victor TRIBALDOS and Maria A. OCHANDO
Laboratorio Nacional de Fusi´on, EURATOM-CIEMAT, E-28040 Madrid, Spain (Received 17 November 2007/Accepted 5 February 2008)
A concise systematic study of impurity parameter profiles (impurity ion temperatures and poloidal velocities) measured under different plasma conditions has been carried out in the TJ-II stellarator using an active spectro-scopic diagnostic system covering a large section of the central plasma minor radius, fromr/a = 0.3 to 0.85, with high spatial resolution. For this, plasmas using hydrogen as the working gas were created and maintained using electron cyclotron resonance heating (from 400 to 500 kW) and line-averaged densities between 0.4 and 0.9×10¹⁹m−3were achieved. In the first instance, it is noted that ion temperature profiles tend to be flat across
the accessible plasma radius, whilst a transition in the poloidal velocity from the ion to the electron diamagnetic direction is observed with increasing density. At the same time, the shear point for impurity velocity is seen to propagate outwards towards the plasma edge. Similarly, at a fixed density, a similar tendency is observed when raising the injected heating power. These results together with the behaviour of the impurity temperatures for the same conditions, suggest that collision frequencyνbE/e ∼neTe−3/2can be considered as an important
control-parameter of plasma dynamics.
c
2008 The Japan Society of Plasma Science and Nuclear Fusion Research
Keywords: charge exchange, spectroscopy, ion temperature, poloidal rotation, TJ-II DOI: 10.1585/pfr.3.S1044
1. Introduction
Spatially resolved measurements of ion temperature and poloidal rotation are critical for understanding plasma dynamics. Indeed, these parameters are regularly mea-sured in most medium and large fusion devices by means of spectroscopic and/or neutral particle analysis meth-ods. Moreover, active techniques using accelerated neu-tral beams to stimulate specneu-tral line and/or neuneu-tral particle emissions are now common [1, 2]. The advantage of ac-tive methods is that well-localized measurements can be obtained without the need to rely on inversion methods, which require knowledge of other parameters, or assump-tions, with their inherent uncertainties. For spectroscopy this involves the capture of an electron, into an excited state, by a fully ionized impurity ion from the accelerated neutral beam. The decay by photon emission of the resul-tant ion provides a means of obtaining localized impurity temperatures (from Doppler line broadening) and veloci-ties (from Doppler line shift) [1, 2]. Recently, such an ac-tive charge-exchange recombination spectroscopy (CXRS) diagnostic, based around a diagnostic neutral beam injector (DNBI) and a bidirectional (two vertical opposing views) multi-channel spectroscopic system [3, 4], began operation on the TJ-II, a four-period [5], low magnetic shear, stel-larator. Moreover, when combined with a multi-channel fiber-optic based system profiles across the plasma minor radius can be obtained.
author’s e-mail: [email protected]
In this paper we begin by outlining the experimental set-up, system calibration methods and data analysis pro-cedures used to achieve localized carbon ion temperature and poloidal velocity profiles. Next, we present results ob-tained from plasmas heated by electron cyclotron heated plasmas (ECRH) for different of conditions, e.g., when varying density or the injected ECRH. Finally, we discuss the results in light of the tendencies observed in parameter behaviour.
2. Experimental Details
2.1
Diagnostic set-up
The TJ-II is a four period heliac type stellarator (B(0) ≤1.2 T,R =1.5 m,<a>≤0.22 m) designed to ex-plore a wide rotational transform range (0.9 ≤ ι(0)/2π ≤ 2.2) in low, negative shear configurations (Δι/ι <6%). The experiments reported here were carried out in electron cy-clotron resonance heated (ECRH) plasmas (PECRH =300
- 500 kW, 53.2 GHz, 2nd harmonic, X-mode polarization, tdischarge ≤250 ms) with hydrogen as the working gas and
with lithium-coated vacuum chamber walls [5] (previously boronized). No auxiliary NBI heating was provided. As a result, central electron densities and temperatures up to
∼1019m−3 and∼1.5 keV respectively could be achieved.
The strong reduction in impurity concentrations due to the wall-coating results in reduced impurity photon fluxes thereby requiring efficient detection procedures. For this, a high-throughput optical system and spectrograph, plus
c
2008 The Japan Society of Plasma
Fig. 1 Ne I lines used for calibration (close to 529 nm). Here, the x-axis is CCD pixel number. Neon wavelengths are taken from [8].
a high-efficiency detector made the goal of measuring in such conditions possible. These, together with the other system components, are described briefly below.
The DNBI, an upgraded version of the compact DINA-5 injector installed on the Madison Symmetric Torus device [6], provides 5 ms long pulses, up to two per discharge, of neutral hydrogen accelerated to 30 keV with an equivalent current of 3.3 equ. A. Its 1/e radius at focus is 21 mm. A bidirectional optical system, consisting of com-mercial camera lenses and fibre optic bundles designed to measure Doppler shifts and widths of the C VI line atλ =529.06 nm in up 12 channels with∼1 cm spatial resolu-tion across the plasma minor radius, was installed in top and bottom view ports located in the same machine sector as the DNBI. See Fig. 1 from Ref. [3]. The light disper-sion element is a Holospec spectrograph with three 100µm curved entrance slits (curved to compensate for the short focal length of the spectrograph) equipped with a trans-mission grating sandwiched between two BK7 prisms [7]. It provides a focal-plane dispersion of ∼1.15 nm/mm at 529 nm. Moreover, a narrow bandpass filter (2.0±0.5 nm at full-width at half-maximum, (FWHM)) prevents spec-tral overlapping of the light from the three fibre arrays at the image plane. The set-up also includes a high-efficiency back-illuminated CCD camera and a fast mechanical shut-ter (≥4.5 ms time window). With on-chip binning, multi-ple spectra can be collected during discharges (≤300 ms). Next, line-of-sight alignment was performed by illuminat-ing each fibre bundle with a bright light source and ob-serving, through a nearby viewport, the orientation and lo-cation of the resultant bright spots with respect to mark-ings on the inside of the opposing vacuum flange. In this way, the sightlines through plasmas were determined using a cross-sectional machine drawing and magnetic configu-ration maps. Furthermore, by comparing with the neutral beam geometry, the normalized radius,r/a, corresponding to each beam/line-of-sight interaction volume was found. Finally, for the magnetic configuration used, 100-44-64, the viewing system covered the plasma minor radius from
r/a = 0.3 to 0.8. The radial spatial resolution achieved is almost constant across this range. However, towards both extremes the error bars on the measured parameters increase due to the reduced light collection in the optical system from these positions.
2.2
Instrument calibration
Calibration of individual fibres was performed in or-der to detect any small variations in the position and in the FWHM of spectral lines. Calibration spectra were captured between discharges using a retractile pencil-type Neon lamp positioned between the light collection lens and the fibre bundle head.
Wavelength calibration was performed using a second order (polynomial) fit to three nearby Ne I spectral lines (see Fig. 1). As spectra are recorded simultaneously for all fibres, fine corrections could be made for any nonlinear dispersion present in the spectrometer or displacement er-rors in the entrance slits. Next, the instrument function was determined from the same spectra using a Gaussian func-tion fitting. This was found to be ∼7.6 pixels (∼1.14 Å) and∼6.3 pixels (∼0.95 Å) for the central fibres of the top and bottom arrays respectively (Fig. 1 in [2]). It should be noted that the fits were made using a non-linear least squares method based on trust-region algorithms. For this, comparisons between different fitting methods were made (i.e., robust and non-robust). In general, robust algorithms are considered preferable to non-robust ones, as the for-mer are less sensitive to outlier points (points nufor-merically distant from the rest that can lead to misleading fits). How-ever, here it was found that robust fits show significant fibre-to-fibre variations for both FWHMs and line centres whilst non-robust fits are more stable [9]. Indeed, in cer-tain situations robust methods may be preferable, e.g., for single Gaussian fits, but they prove to be weak when mul-tiple Gaussian fits are performed. Hence, the non-robust method was chosen as the fitting method.
2.3
Active and passive signal treatment
Special care must be taken when treating the CXRS line spectra. For instance, contributions to the measured signal from electron-excited emissions (called the cold componentor passivesignal, P) must be removed since these are not localized. Also, for the experimental set-up, plasma conditions should remain constant along a dis-charge, or discharges should be reproducible (shot to shot technique), so that the active signal,A, can be obtained by subtraction, i.e., (A+P)−P=A. See Fig. 2. For the data presented here, both techniques were employed.2.4
Data analysis
The charge exchange process of interest here consists of the capture, by a fully-stripped carbon ion, C+6, of an
C+5. De-excitation of the upper-state results in the emis-sion of a photon, in this case, the emisemis-sion of a 529.06 nm photon (1).
H0+C+6 → H++C+5(n∗,l∗) ⇒
⇒C+5(n∗,l∗) → C+5(n,l)+hν(n∗>n). (1) Such emissions provide information about C+6 ions
via Doppler shifts and widths of the spectral line (temper-atures and velocities respectively). Moreover, as the level lifetime of the upper C+5level is∼10−9s, and the ions are
predicted to rotate at<20 km s−1, emissions occur within
the same localized volume as the charge exchange (i.e., well within 1 cm). Now the impurity ion temperatures and velocities are deduced from the usual relations:
Ti=1.68·108A ⎛ ⎜⎜⎜⎜⎝Δλ2
fwhm−Δλ 2 instrum
λ2 0
⎞ ⎟⎟⎟⎟⎠,
v=
λ−λ0
λ0 c,
(2)
whereAis the mass of the ion [amu],Δλfwhmthe measured
FWHM,Δλinstrumthe instrument FWHM,λandλ0are the
measured and the unshifted central wavelength of line un-der consiun-deration respectively andcthe speed of light. 2.4.1 Additional corrections
A clear asymmetry was observed about the measured C VI spectral line. This was interpreted as arising from fine structures in the transitions in this hydrogen-like ion [4, 10]. Indeed, there can be up to 13 possible lines with different intensities depending on plasma conditions. Such fine structures give rise to the tail observed on the short wavelength side of the C VI spectral line (see Fig. 2) that results in excess line broadening, and hence overestimated ion temperatures. Thus, in order to correct for this a multi-Gaussian fit, using relative intensity ratios between fine structure components, was employed. In addition, after careful analysis, contamination by a nearby O VI line was ruled out, in particular as there is a strong oxygen reduction due to the coated walls.
Fig. 2 C VI line spectra for consecutive CCD frames atr/a = 0.55. Diamonds, squares and dots represent active, pas-sive and active+passive signals, respectively. A fit to the active C VI signal is shown.
3. Results
For the work undertaken here, hydrogen plasmas last-ing up to 250 ms were created and line-averaged electron densities between 0.4 and 0.9×10¹⁹m−3 were achieved.
Moreover, CXRS data were obtained for plasmas created with different injected ECRH powers. Here, in the fol-lowing sections, impurity temperature and rotation veloc-ity profiles are presented for a variety of plasmas condi-tions. The tendencies observed in these parameters when changing plasma conditions are highlighted and discussed.
3.1
Temperature and poloidal velocity
pro-files
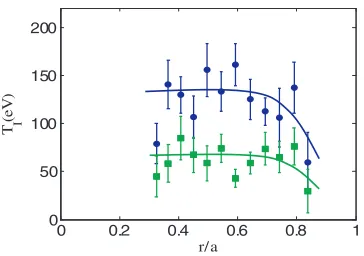
Impurity ion temperatures for two discharges with ap-proximately 400 kW of ECRH, but different line averaged electron densities,<ne>, are plotted in Fig. 3. In the first
instance, the values are in accordance with the weak colli-sional coupling for these densities. However, the impurity temperature is found here to be higher for the discharge with lower<ne>. It is also seen that temperature profiles
are relatively flat except towards the edge (forr/a ≥0.7) where these drop off. The impurity temperatures measured here for the higher density case are similar to those mea-sured for majority ions using neutral particle analyser sys-tems [11]. Moreover, the increased impurity temperature at low densities was seen previously using passive spec-troscopy and accounted for by contributions due to non-thermal velocities [12].
Next, for the same set of discharges, poloidal rotation profiles are shown in Fig. 4. A clear transition from the ion to the electron diamagnetic direction is seen.
Moreover, for the lower line-averaged electron den-sity, the ions rotate poloidally in the ion diamagnetic direc-tion whereas for the higher density this rotadirec-tion changes towards the electron diamagnetic direction. An in depth analysis of this change in rotation is performed for a de-tailed density scan. This is described below.
Fig. 3 Ion temperature profiles obtained for two discharges with
PECRH=400 kW and line averaged densities<ne>=0.42
(dots) and 0.9 (squares)×1019m−3. Lines are plotted to
Fig. 4 Poloidal rotation profiles for the same discharges as shown in Fig. 3. The symbols used are the same as in Fig. 4. Lines are plotted to aid the reader.
Fig. 5 A plot of impurity poloidal velocity as a function of line-averaged electron density showing the change from ion to electron diamagnetic direction. The symbols represent values at different normalized plasma radii,r/a.
3.2
Density scan
A density scan (from 0.4 to 0.92 ×10¹⁹m−3) with
a fixed 400 kW of injected ECRH power was performed. The measured poloidal velocities are presented in Fig. 5. These show a change in direction, from ion to electron dia-magnetic direction (transition from electron to ion root), as the line-averaged electron density is increased. A sim-ilar tendency was reported previously in the TJ-II for pas-sive spectroscopy measurements of C V ion temperatures [13]. Here in Fig. 5, it is seen that the transition point (i.e., where the poloidal velocity ∼ 0) gradually propa-gates towards the plasma edge (i.e., fromr/a ∼ 0.4/0.55 tor/a ∼0.7/0.8) as<ne>increases, in this instance from
∼0.55 to 0.8 × 10¹⁹m−3. These C+6 ion measurements
provide the first experimental evidence that the shear point of the impurity ion rotation propagates outwards towards the plasma edge of TJ-II with increasing electron density. Moreover, by considering the basic equation that relates impurity rotation and the radial electric field,
Vpol =(Er×B)/B2−gradpI×B/nIZIeB2, (3)
wherevpolis the poloidal rotation velocity of the ion under
investigation, pI,nI andZI are the pressure, density and
charge of this ion respectively, eis electron charge, and Er andBare the electric and magnetic fields respectively.
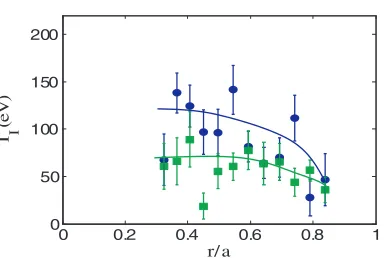
Fig. 6 C6+ ion temperature profiles for 400 kW (dots) and
500 kW (squares) of PECRH and almost the same
line-averaged density<ne>=0.6×10¹⁹m−3.
Fig. 7 C6+ion rotation profiles for 400 kW (dots) and 500 kW
(squares) ofPECRH. Here the line-averaged electron
den-sity is about 0.6×10¹⁹m−3.
Here the first term is the familiarE×Bdrift while the sec-ond term represents the ion diamagnetic drift. It can be assumed for TJ-II that the toroidal rotation can be ignored, i.e., sinceVpolBtor VtorBpoldue to the smallBpol/Btorand
the viscous damping between passing and trapped parti-cles. In this case, since the change in sign ofEris found to
commence at the plasma edge and advance inwards as the density increases [14] it might indicate an important con-tribution of the impurity pressure gradient on this rotation.
3.3
P
ECRHImpurity ion temperature and poloidal rotation pro-files are compared for two different injected ECRH pow-ers (400 kW and 500 kW) with comparable line-averaged electron densities. See Figs. 6 and 7.
Here, for fixed line-averaged density, the impurity temperature is seen to decrease withPECRH. In order to
un-derstand this it is necessary to consider the simple power balance equation given by
dTb
dt =ν
b/e
E (Te−Tb)−
Tb
τb E
, (4)
whereνbE/e∼neTe−3/2,TbandTeare majority ion and
elec-tron temperatures respectively, andτb
E is majority ion
<ne>or decreasing Te) gives rise to increased ion
tem-perature. Hence for a power scan (with fixed<ne> and
non-constantTe), or density scan (at fixedPECRH) the ion
temperature can be expected to change, i.e., to increase when (i) Te decreases (constant <ne>) or (ii) <ne>
in-creases. Moreover, the ion energy confinement time scales inversely with injected PECRH [15] thus enhancing the
above point since (for fixed<ne>) a lower injectedPECRH
implies higher ion temperatures. In ECRH discharges, ion and electron channels are strongly decoupled (Te Tb)
as a consequence of the low electron densities and single channel heating. Thus for constant density,Tbshould
in-crease asTeis decreased, i.e., lowerPECRH, sinceTeis an
increasing function ofPECRH.
Finally, for the same discharges as in the previous fig-ure, the impurity rotation profile is seen to shift to the elec-tron diamagnetic direction for the shot with higherPECRH.
According to neoclassical theory, a shift to the ion diamag-netic direction could be in principle expected. As previ-ously reported (see Fig. 7 of Ref. [13]), in TJ-II there is a transition from positive to negative radial electric field around a critical line-averaged density of 0.6×10¹⁹m−3 and a region (see Fig. 3 of Ref. [13]) with three roots: a positive “electron” root, an unstable intermediate solution, and a negative “ion” root.
Unfortunately, the data currently available for the ECRH scan are precisely around this critical region. For the PECRH = 400 kW shot the density is slightly below
(<ne>=0.58×10¹⁹m−3) this transition thereby indicating
a positiveEr, whereas forPECRH = 500 kW, it is slightly
above the critical density (<ne>= 0.61×10¹⁹m−3) thus
implying that the radial electric field is negative in accor-dance with the results of Ref. [13].
Note that the argument about power balance for the PECRH scan still holds, i.e., the ion temperature is
deter-mined by the power transferred by electrons via collisions and is lost through transport, in this simple modelling with an effective confinement time. For higher PECRH
colli-sional coupling is reduced, and according to neoclassical theory, the confinement time is also reduced, because of the smaller radial electric field, both effects contributing in reducing the ion temperature as is found.
In conclusion, as seen from these experiments, dy-namics depend on<ne>as well as on Te(varied here by
PECRH). It is thus considered that the control-parameter is
the plasma collision frequencyνbE/e∼neTe−3/2.
4. Summary
Radial profiles of impurity ion temperatures and poloidal velocities have been obtained for a range of plasma conditions in the TJ-II. A study of the behaviour of these parameters when changing density or injected ECRH power has been undertaken. Possible controlling mechanisms for the tendencies observed have been put for-ward. For instance, the tendencies observed in the im-purity ion temperature profiles when varying either line-averaged density or injectedPECRH(while maintaining the
other parameter constant) suggest that the plasma collision frequency (∼neT−
3/2
e ) tends to control the dynamics in
TJ-II, thereby providing a clearer description of the trigger mechanism.
With the impending coming on line of the second of TJ-II’s two neutral beam injectors [16], as well as an Electron Bernstein Wave Heating system [17], the CXRS-DNBI diagnostic will be a powerful tool for the different heating scenario envisaged. Moreover, in the near future upgrades to the active diagnostic will be made in order to increase its scientific return.
[1] H. Ehmler et al., Plasma Phys. Control. Fusion 45, 53 (2003).
[2] S. Gangadharaet al., Rev. Sci. Instrum.77, 10F109 (2006). [3] R.C. Isler, Plasma Phys. Control. Fusion36, 171 (1994). [4] K. Idaet al., Rev. Sci. Instrum.71, 2360 (2000). [5] E. Ascas´ıbaret al., Fusion Eng. Des.56-57, 145 (2001). [6] G.F. Abdrashitovet al., Rev. Sci. Instrum.72, 34 (2001). [7] R.E. Bellet al., Rev. Sci. Instrum.75, 4158 (2004). [8] A.S. Stringanovet al,.Tables of Spectral Lines of Neutral
and Ionized Atoms, IFI/Plenum, New York, 1968. [9] J.M. Carmonaet al., to be published.
[10] R.J. Fonck, Phys. Rev. A29, 3288 (1984).
[11] R. Balb´ın et al., Proc.15th Inter. Stellarator Workshop,
Madrid(2005), http://www-fusion.ciemat.es/SW2005/ [12] K.J. McCarthyet al., Europhys. Lett.63, 49 (2003). [13] B. Zurroet al., Fusion Sci. Technol.50, 419 (2006). [14] C. Hidalgoet al., Phys. Rev. E70, 067402 (2004). [15] R. Burhennet al., Fusion Sci. Technol.46,115 (2006). [16] J. Guaspet al., Fusion Technol.35, 32 (1999) .