Corresponding Author E-mail:Kamranmoradpour60@gmail.com 831 | Pag
http://www.ijabbr.com
Available online at
International journal of Advanced Biological and Biomedical Research
Volume 2, Issue 3, 2014: 831-839
Evaluation of leaf proteome in wheat genotypes under drought stress
K. Moradpour1*, A. Najaphy2, S. Mansoorifar2, A. Mostafaie3, M. Bakhtiari3 and S. Kiani3 1
Graduate MSc of Agricultural Biotechnology, Razi University, Kermanshah, Iran 2
Assistant Professor, Department of Agronomy and Plant Breeding, College of Agriculture and Natural Resources,
Razi University, Kermanshah, Iran 3
Medical Biology Research Center, Kermanshah University of Medical Sciences, Kermanshah, Iran
Abstract
Drought stress in plants, the change (increase or decrease) in the production of plant proteins. Proteomics in recent years one of the most powerful tools that help us to study the changes in protein In order to investigate the proteome of wheat leaves in response to terminal drought, two genotypes susceptible and resistant wheat genotypes were evaluated under irrigated (non-stress) and rain-fed (stress) conditions. After applying stress and extraction of leaf proteins, two-dimensional gels were prepared and scanned. Analysis of gel images was performed using Same Spot Progenesis. About 657 protein spots were identified by the software. After alignment of the spots and their correspondence, 148 spot were identified visually and by using the software and statistical analysis was carried out. Five spots with Fold ≥ 1/5 at P ≤ 0/05 were identified, of which 4 spots were significant at P ≤ 0/05 and 1 spot was significant at P ≤ 0/01.
Keywords: drought stress, proteome, wheat
1- Introduction
Moradpour et al . Int J Adv Biol Biom Res. 2014; 2(3):831-839
832 | Page 2- Materials and methods
Experimental location and Plant material
This research was carried out using bread wheat genotypes during 2010 at research farm and laboratories of Razi university and medical biology research center Kermanshah university of medical sciences. At grain filling stage, plants were selected and flag leaf samples were harvested. The experiments on both susceptible (Hamam-4) and resistant (Pishgam (Bkt/Zhong)) genotypes of wheat in irrigated (non-stress) and rain-fed (stress) conditions was performed.
Protein Extraction and Two-dimensional Electrophoresis (2-DE)
Moradpour et al . Int J Adv Biol Biom Res. 2014; 2(3):831-839
833 | Page susceptible -10 a -PH 3 range of pattern in the
electrophoresis dimensional -Two -Figure 1 resistant -c s condition stress in genotype susceptible -b s condition stress -non in genotype s condition stress in genotype resistant -d s stress condition -in non genotype
3- Results and discussion
In order to investigate the wheat leaf proteome, both susceptible and resistant genotypes of wheat in irrigated (non-stress) and rain-fed (stress) conditions were evaluated. Two-dimensional gels were prepared and scanned the stress, Tiff format images to analysis using Same spot progenesis software company became Nonlinear England. The statistical design was composed as follows:
1. Comparison of protein spots in susceptible genotype in stress and non-stress conditions 2. Comparison of protein spots in resistant genotype in stress and non-stress conditions
Moradpour et al . Int J Adv Biol Biom Res. 2014; 2(3):831-839
834 | Page Changes in protein expression were analysis by the software to the spot anywhere in the gel image of the studied groups were compared. Information about changes in protein expression levels for each spot on the graph as " Log normalised volume" was drawn up. Statistical analysis showed that the level of 5% (P ≤ 0.05) show a significant difference in the number 5 spots. a spot at the 1% statistical level showed significant differences (Table 1). Two-dimensional electrophoresis of proteins on tea leaves 750 spots using PDQuest 8.0.1 software was detected on gel, 61 protein spots showed significant differences. The analysis of the protein spots were identified by mass spectrometers 30 protein spots, of which 26 protein spots in the metabolism of carbon, nitrogen and sulphur are important photosynthesis defense proteins were identified (Li et al, 2011). In a study induced changes on the proteome of wheat seeds by two dimensional electrophoresis and quantitative analysis using software Melanie-3 600 protein spots on the reproducibility was assessed for 153 of those parts of the response was significantly stress showed. Among these proteins, 78 protein spots including storage proteins, heat shock proteins, proteinase inhibitors, detoxification enzymes, aldehyde dehydrogenases and LEA proteins by MALDI TOF / TOF were identified (Haj Heydari et al, 2005).
Moradpour et al . Int J Adv Biol Biom Res. 2014; 2(3):831-839
835 | Page Table 1 - Characteristics of the P-value, Fold and protein expression levels of significance in
level 0.05 (**) and 0.01 (*)
4- Conclusion
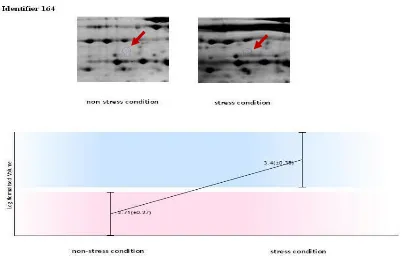
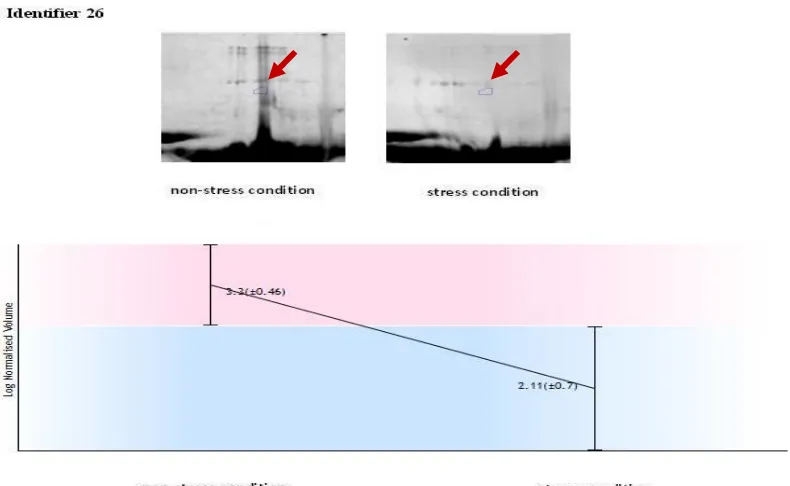
The 164, 26, 287 and 509 spots at the level of 5% are significant. The 164 (Figure 3) and 287 (Figure 4) spots were increased due to drought. while 26 (Figure 5) and 509 (Figure 6) spots showed decreased protein expression. 80 (Figure 7) spot showed a significant change at the level 1% That Protein expression was higher in drought stress. In this research can be obtain more information whit isolation, sequencing and identification of the expression proteins in drought conditions.
Figure 3 - 164 spot and chart " Log normalised volume" in non-stress and stress conditions Spots Anova (p) Fold Tags pI MW Average Normalised Volumes
Condition 1 Condition 2
80 0.007** 2.6 4.88 53 804.829 2059.331
164 0.023* 4.9 5.5 42 524.002 2582.680
26 0.043* 14.1 6.88 66 2107.188 149.322
287 0.043* 2.3 6.1 31 522.801 1220.651
Moradpour et al . Int J Adv Biol Biom Res. 2014; 2(3):831-839
836 | Page conditions stress
and stress -non in g normalised volume" " Lo
chart and spot 287 -4 Figure
Moradpour et al . Int J Adv Biol Biom Res. 2014; 2(3):831-839
837 | Page
Figure 6 - 509 spot and chart " Log normalised volume" in non-stress and stress conditions
Figure 7 - 80 spot and chart " Log normalised volume" in non-stress and stress conditions
5- Acknowledgments
Moradpour et al . Int J Adv Biol Biom Res. 2014; 2(3):831-839
838 | Page 6- References
Bradford, M. M (1976) A rapid and sensitive method for the quantitation of microgram quantities of protein utilizing the principles of protein dye binding.Anal Biochem. 72: 248-254.
Chaves, M.M., M.M. Oliveira (2004) Mechanisms underlying plant resilience to water deficits: prospects for water-saving agriculture, J. Exp. Bot., 55, N 407, 2365-2384.
Damerval C., D. deVienne, M. Zivy and H. Thiellement (1986) Technical improvements in two- dimensional electrophoresis increase the level of genetic variation detected in wheat-seedling proteins. Electrophoresis. 7:52-54.
Demirevska, K., L. Simova-Stoilova, V. Vassileva, I. Vaseva, Grigorova and B. Feller (2008) Drought- induce leaf protein alterations in sensitive and tolerant wheat varieties. J. plant physiology. 34:79-102.
Donnelly. B., R. Madden, P. Ayoubi, D. Porter and J. Dillwith (2005) The wheat (Triticum aestivum L.) leaf proteome. J. Proteomics. 5: 1624–1633.
Farshadfar, E., H. Ghasempour and H. Vaezi (2008) Molecular aspects of drought tolerance in bread wheat (T. aestivum). Pak. J. Biol. Sci. 11(1): 118-112.
Feller, U., I. Anders and T. Mae (2008) Rubiscolytics: fate of Rubisco after its enzymatic function in a cell is terminated. J. Exp. Bot., 59: 1615-1624.
Gorg, A., W. Weiss and M.J. Dunn (2004) Current two-dimensional electrophoresis technology for proteomics. Proteomics, 4: 3665–3685.
Haj Heydari M, E`yvazi A, Hosseini Salekdeh Gh (2005) Proteome analysis of wheat seeds under drought stress. National
Biotechnology Congress of Iran (In Farsi).
Heikkila, J. J., J. E. T. Papp, J. A. Schultz and J. D. Bewley (1984) Introduction of heat shock protein messenger RNA in maize mesocotyls by water stress, abscisic acid and wounding. Plant Physiology, 76:270- 274.
Isaacson, T., C.M.B. Damasceno, R.S. Saravanan, Y. He, C. Catala, M. Saladie and J.K.C. Rose (2006) Sample extraction techniques for enhanced proteomic analysis of plant tissues. Nat. Protocols, 1: 769–774.
Jangpromma.N., S. Kitthaisong, S. Daduang, P. Jaisil and S.Thammasirirak (2007) 18kDa protein accumulation in sugarcane leaves under drought stress conditions. KMITL Sci. Tech. J.Voi. 7No. S1 Nov. pp. 44-54.
Moradpour et al . Int J Adv Biol Biom Res. 2014; 2(3):831-839
839 | Page Li. X. J.,M. F. Yang, Y. Zhu, Y. Liang and Sh. H. Shen (2011) Proteomic analysis of salt stress responses in rice shoot. J. Plant Biol.
Sivamani, E., A. Bahieldin, J. M. Wraith, T. Al- Niemi, W. E. Dyer, T. H. D. Ho and R. Qu (2000) Improved biomass productivity and water use efficiency under water deficit conditions in transgenic wheat constitutively expressing the barley HVA1 gene.
Sujin, Ray wu (2004) Stress-inducible synthesis of proline in transgenic rice confers growth under stress conditions than that with constitutive synthesis. Plant Sci., 166(4): 941-948. Suoyi, H., F. Rui, Z. Tuanjie, Y. Jingjing and Y. Deyue (2009) Seed storage protein components are associated with curled cotyledon phenotype in soybean. African J. of Biotechnology Vol. 8 (22), pp. 6063-6067.