http://www.sciencepublishinggroup.com/j/bio doi: 10.11648/j.bio.20190705.11
ISSN: 2328-5885 (Print); ISSN: 2328-5893 (Online)
Performance Evaluation of Tef [
Eragrostis tef
(Zucc.)Trotter] Genotypes for the Non-traditionally Tef
Growing Area, Western Ethiopia
Misgana Merga
*, Alemu Dabi, Addisu Dereje
Ethiopian Institute of Agricultural Research, Assosa Agricultural Research Center, Assosa, Ethiopia
Email address:
*
Corresponding author
To cite this article:
Misgana Merga, Alemu Dabi, Addisu Dereje. Performance Evaluation of Tef [Eragrostis tef (Zucc.)Trotter] Genotypes for the Non-traditionally Tef Growing Area, Western Ethiopia. Agriculture, Forestry and Fisheries. Vol. 7, No. 5, 2019, pp. 65-70.
doi: 10.11648/j.bio.20190705.11
Received: July 9, 2019; Accepted: August 3, 2019; Published: December 4, 2019
Abstract:
Cereal is very important crop for human consumption in the world. Among the cereal crops, tef is one of the most popular and staple crop that originated and highly diversified in Ethiopia. The demand is very high in the country, and it needs production expansion to the area where tef is not primary grown. The current study was consists of forty-nine tef genotypes were conducted by using simple lattice design at Assosa, Western Ethiopia for two consecutive cropping seasons (2016 and 2017) to evaluate the performance of tef genotypes for the non-traditional tef growing area particularly Assosa, Ethiopia. The analysis of variance indicated that there was high (p ≤ 0.01) significant difference among tested tef genotypes for days to heading, plant height, panicle length, culm length, grain yield, and harvest index. From the mean performance of genotypes, the maximum grain yield of 14.70 kg ha-1, 14.33 kg ha-1, 13.49 kg ha-1, and 13.31 kg ha-1 were obtained from G-12, G-1, G-37 and G-19. These genotypes were showed superior performance in grain yield and they could be recommended for further evaluating under the next breeding phase of variety trail.Keywords:
Tef, Grain Yield, Shoot Biomass, Staple Crop1. Introduction
Crop like cereal is very important for human consumption in the world. Among cereal crops Tef is one of the most popular and staple crops originated and highly diversified in Ethiopia. It has several advantages; such as adapted to diverse agro-ecological zones which are marginal to most of other crops [10], excellent in nutritional contents and serve as staple food crop for Ethiopians [5, 12], very important in case of health aspect since its free of gluten [18], its straw is highly nutritious and more palatable for livestock [2] and also sources of income for most of the farmers [17], thus why tef is widely acceptable in Ethiopia.
In Ethiopia during 2016/17 main cropping season, tef was covered over three million hectares of land, and five million tons of grain was produced [7]. In case of productivity, it is low which is estimated to 1.6 tons per hectare. The demand is still beyond to the production. On the other hand, the
population growth of Ethiopia is radically increased. From 18 million people in 1950, it becomes increased to about 108 million in 2017 (https://countrymeters.info/en/Ethiopia). This has been a critical impact on the availability of food and most of the people in the country are in-secured with food. According to FAO [8] report, 32% of the total population in Ethiopia is estimated to have been undernourished in 2014. One of a potential food cereal crops is tef, which is widely grown and able to provide over two-thirds of nutrition in the Ethiopian diet. It’s grain is serve about 50 million inhabitants (60% of the total population) accounting for 14% of all calories consumed [1]. So, over 60% of tef is directly consumed by farm households and consequently plays a crucial role in food security [17]. Therefore, improving the productivity of the crops through breeding and also increasing the production of potential food crops like tef, is very important inorder to feed these people.
cultivation of tef to the non-traditional tef growing area which has the largest marginal and cultivation land such as Benishangul Gumuz region, and then increasing the production of tef in the country. Prior to do this, performance evaluation of tef materials to this area is primary important duties that given to the research institution. Therefore, considering such phenomena the current study was conducted to evaluate some of tef genotypes for the agro-ecology of Assosa and then identify the most performed genotypes for the next tef breeding research.
2. Materials and Methods
2.1. Experimental Site and Planting
The experiment was conducted during 2016 and 2017 main cropping season at the field of Assosa Agricultural Research Center (AsARC) in Benishangul Gumuz Region, Ethiopia. Its altitude is 1547 meters above sea level (masl). Assosa district receive an average annual rainfall of 1275 mm. The minimum and maximum temperatures are 17°C and
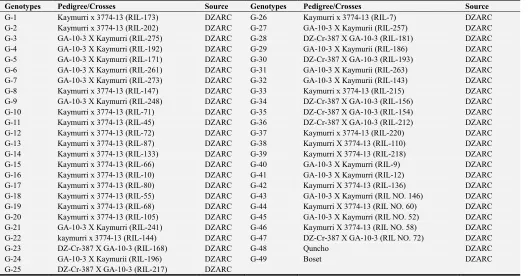
28°C, respectively. The dominant soil types of this area are Nitosols and Fluvisols with a soil pH range of 5.0 to 6.0 [3]. For this study, a total of 49 tef, genotypes along with two standard checks, Quncho and Boset were used. They were kindly obtained from Debre Zeit Agricultural Research Center (Table 1).
2.2. Experimental Design and Management
The experiment was conducted by using 7 x 7 simple lattice design with two replications. Each plot was consists of five rows of 2m length with 0.2 m inter-row distance (1 m x 2 m = 2 m2). The distance between plots, blocks and replications were 0.5m, 1m and 1.5m, respectively. The seed rate of 15 kg ha-1 was drilled by hand within the prepared rows. Fertilizer rate of 46 kg ha-1 P2O5 in the form of NPS
was applied at the time of sowing and 23 kg ha-1 N2 in the
form of Urea was applied in split form (i.e. half of recommended N2 at sowing and the left was applied 30-35
days after sowing). Hand weeding was performed frequently based on the extents of weed.
Table 1. Description of Tef genotypes used in the experiment.
Genotypes Pedigree/Crosses Source Genotypes Pedigree/Crosses Source
G-1 Kaymurri x 3774-13 (RIL-173) DZARC G-26 Kaymurri x 3774-13 (RIL-7) DZARC
G-2 Kaymurri x 3774-13 (RIL-202) DZARC G-27 GA-10-3 X Kaymurii (RIL-257) DZARC
G-3 GA-10-3 X Kaymurri (RIL-275) DZARC G-28 DZ-Cr-387 X GA-10-3 (RIL-181) DZARC
G-4 GA-10-3 X Kaymurri (RIL-192) DZARC G-29 GA-10-3 X Kaymurii (RIL-186) DZARC
G-5 GA-10-3 X Kaymurri (RIL-171) DZARC G-30 DZ-Cr-387 X GA-10-3 (RIL-193) DZARC
G-6 GA-10-3 X Kaymurri (RIL-261) DZARC G-31 GA-10-3 X Kaymurii (RIL-263) DZARC
G-7 GA-10-3 X Kaymurri (RIL-273) DZARC G-32 GA-10-3 X Kaymurii (RIL-143) DZARC
G-8 Kaymurri x 3774-13 (RIL-147) DZARC G-33 Kaymurri x 3774-13 (RIL-215) DZARC
G-9 GA-10-3 X Kaymurri (RIL-248) DZARC G-34 DZ-Cr-387 X GA-10-3 (RIL-156) DZARC
G-10 Kaymurri x 3774-13 (RIL-71) DZARC G-35 DZ-Cr-387 X GA-10-3 (RIL-154) DZARC
G-11 Kaymurri x 3774-13 (RIL-45) DZARC G-36 DZ-Cr-387 X GA-10-3 (RIL-212) DZARC
G-12 Kaymurri x 3774-13 (RIL-72) DZARC G-37 Kaymurri x 3774-13 (RIL-220) DZARC
G-13 Kaymurri x 3774-13 (RIL-87) DZARC G-38 Kaymurri X 3774-13 (RIL-110) DZARC
G-14 Kaymurri x 3774-13 (RIL-133) DZARC G-39 Kaymurri X 3774-13 (RIL-218) DZARC
G-15 Kaymurri x 3774-13 (RIL-66) DZARC G-40 GA-10-3 X Kaymurri (RIL-9) DZARC
G-16 Kaymurri x 3774-13 (RIL-10) DZARC G-41 GA-10-3 X Kaymurri (RIL-12) DZARC
G-17 Kaymurri x 3774-13 (RIL-80) DZARC G-42 Kaymurri X 3774-13 (RIL-136) DZARC
G-18 Kaymurri x 3774-13 (RIL-55) DZARC G-43 GA-10-3 X Kaymurri (RIL NO. 146) DZARC
G-19 Kaymurri x 3774-13 (RIL-68) DZARC G-44 Kaymurri X 3774-13 (RIL NO. 60) DZARC
G-20 Kaymurri x 3774-13 (RIL-105) DZARC G-45 GA-10-3 X Kaymurri (RIL NO. 52) DZARC
G-21 GA-10-3 X Kaymurri (RIL-241) DZARC G-46 Kaymurri X 3774-13 (RIL NO. 58) DZARC
G-22 kaymurri x 3774-13 (RIL-144) DZARC G-47 DZ-Cr-387 X GA-10-3 (RIL NO. 72) DZARC
G-23 DZ-Cr-387 X GA-10-3 (RIL-168) DZARC G-48 Quncho DZARC
G-24 GA-10-3 X Kaymurii (RIL-196) DZARC G-49 Boset DZARC
G-25 DZ-Cr-387 X GA-10-3 (RIL-217) DZARC
G: genotype.
2.3. Data Collected
Data were collected based on plot and individual plant bases. Plot based data were days to seedling emergence, days to heading, days to maturity, grain filling period, above ground biomass, grain yield, harvest index, and lodging index using the method of Caldicott and Nuttall [6]. Whereas panicle length, plant height, and culm length data were taken on individual plant basis from five randomly selected and pre-tagged plants of the central rows of each plot and its
average values were used for data analysis.
2.4. Statistical Analyses
3. Result and Discussion
3.1. Analysis of Variance
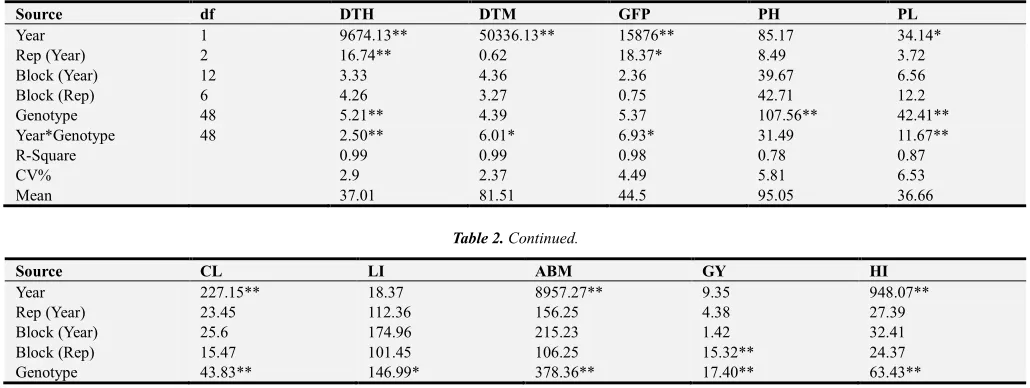
Analysis of variance for all traits was presented in Table 2. As the result indicated, highly (p ≤ 0.01) significant differences were observed among evaluated tef genotypes for days to heading, plant height, panicle length, culm length, above ground biomass, grain yield, and harvest index; significant (p ≤ 0.05) for only lodging index. Besides, a significant (p ≤ 0.05) year variation also observed in all of the traits except plant height, lodging index and grain yield. On the other hand, genotype by year interaction did induce a significant variation in days to heading and maturity, grain filling period, panicle length, above graound biomass and grain yield. This indicates the different tef genotypes were performed in different manner in both cropping seasons. The variation in weather condition is always has a primary impact on the crops phenology and growth. The significant variation of grain yield trait is supported by the previous studies of Wondewosen, et al [19], Mizan, et al [14] and Plaza-Wüthrich, et al [16].
3.2. Mean Performance of the Genotypes
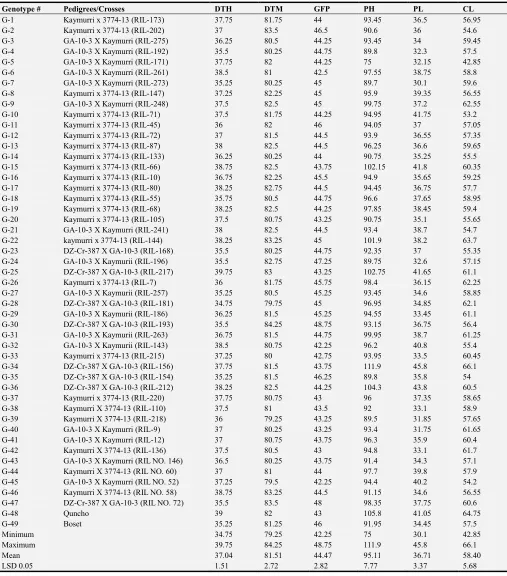
The maximum day to maturity was 84 days for the genotype G-34 and the least was 79 days for genotype G-3. The mean number of days to heading was 81 day (Table 3). The overall evaluated genotypes at this area are relatively early matured. The ranges of days to maturity was narrower as compared to the previous study of Kebebew, et al [11] who reported 84 to 100 days to maturity of 320 tef germplasms collected from diverse agro-ecology of Ethiopia and evaluated at Debrezait and Alem Tena. Hence the climatic conditions of one area adversely affect the maturity period of crop and thus most of the materials evaluated in this area were forced to early. The shorter phenology of the genotypes evaluated at this area might be due to the low altitude of the area. Thus, knowing of the phonological features of crop is important to adjusting the time of planting and may be reduces the adverse effects of weather condition [4].
There were high significant difference among genotypes for plant height; which was ranged from 75cm for G-5 to 111.9cm for G-34 with an average mean value of 95cm. Genotype G-34 was the tallest height of 111.9cm followed by variety Quncho (105.8cm), G-36 (104.3cm), and G-25 (102.8cm), while the shortest plant height were found for G-5 (75cm). The length of panicle was ranged between 30cm to 45.8cm with an average mean value of 36.7cm. The maximum panicle length is for G-34 and the least one is for G-7. Culm length is the difference of plant height and panicle length. Maximum culm length was found for G-34 (66cm) while the least culm length was for G-5 (42.8cm). Most of the time, these three traits have strong positive association with each other’s [13, 15]. Consideration of such plant growth characters during selection is very important as it is helpful to selecting the genotype with relatively withstand lodging.
The highest above ground shoot biomass in tons ha-1 were recorded for G-32 (9.4) followed by G-29 (7.75), G-21 (72.5), G-15 (71.25) and G-12 (70) in a descending order. While the least in biomass yield was for G-5 (2.5). The biomass of tef is very crucial, which have a comparative importance with grain yield since its straw is more palatable for animal and also used for market price [1-2]. Sometimes, an increase in biomass yield may be leads to decrease in grain yield due to its negative association of lodging index [13]. So, selecting the genotype which has not very high biomass is important. Big grain yield variation was observed among the genotypes, which is ranged from 0.57 (G-5) to 1.47 ton ha-1 (G-12). This big variation among genotypes might be mainly due to the genetic potential of the genotypes. The two standard checks, Boset and Quncho were gave 1.086 and 0.6 t ha-1 respectively. The top genotype (G-12) has about 35% of yield advantage over the best standard check, Boset and also relatively better harvest index. Based on the mean value, overall genotypes which have minimum of 10% yield advantage over the best check were selected and advanced to the next breeding step which is a regional variety trail.
Table 2. Mean squares from combined analysis for ten traits of 49 tef genotypes evaluated at Assosa in 2015 to 2017 cropping seasons.
Source df DTH DTM GFP PH PL
Year 1 9674.13** 50336.13** 15876** 85.17 34.14*
Rep (Year) 2 16.74** 0.62 18.37* 8.49 3.72
Block (Year) 12 3.33 4.36 2.36 39.67 6.56
Block (Rep) 6 4.26 3.27 0.75 42.71 12.2
Genotype 48 5.21** 4.39 5.37 107.56** 42.41**
Year*Genotype 48 2.50** 6.01* 6.93* 31.49 11.67**
R-Square 0.99 0.99 0.98 0.78 0.87
CV% 2.9 2.37 4.49 5.81 6.53
Mean 37.01 81.51 44.5 95.05 36.66
Table 2. Continued.
Source CL LI ABM GY HI
Year 227.15** 18.37 8957.27** 9.35 948.07**
Rep (Year) 23.45 112.36 156.25 4.38 27.39
Block (Year) 25.6 174.96 215.23 1.42 32.41
Block (Rep) 15.47 101.45 106.25 15.32** 24.37
Source CL LI ABM GY HI
Year*Genotype 12.9 72.21 358.93** 8.53* 41.61
R-Square 0.76 0.71 0.78 0.81 0.74
CV% 6.91 14.59 24.87 21.99 28.72
Mean 58.38 64.14 55.84 10.13 19.41
Df: degree of freedom, DTH: days to heading, DTM: days to maturity, GFP: grain filling period, PH: plant height, PL: panicle length, CL: culm length, LI: lodging index, ABM: above ground biomass, GY: grain yield, HI: harvest index, CV%: coefficient of variation.
Table 3. Mean performance for ten traits of 49 tef genotypes evaluated at Assosa in 2015 to2017 cropping seasons.
Genotype # Pedigrees/Crosses DTH DTM GFP PH PL CL
G-1 Kaymurri x 3774-13 (RIL-173) 37.75 81.75 44 93.45 36.5 56.95
G-2 Kaymurri x 3774-13 (RIL-202) 37 83.5 46.5 90.6 36 54.6
G-3 GA-10-3 X Kaymurri (RIL-275) 36.25 80.5 44.25 93.45 34 59.45
G-4 GA-10-3 X Kaymurri (RIL-192) 35.5 80.25 44.75 89.8 32.3 57.5
G-5 GA-10-3 X Kaymurri (RIL-171) 37.75 82 44.25 75 32.15 42.85
G-6 GA-10-3 X Kaymurri (RIL-261) 38.5 81 42.5 97.55 38.75 58.8
G-7 GA-10-3 X Kaymurri (RIL-273) 35.25 80.25 45 89.7 30.1 59.6
G-8 Kaymurri x 3774-13 (RIL-147) 37.25 82.25 45 95.9 39.35 56.55
G-9 GA-10-3 X Kaymurri (RIL-248) 37.5 82.5 45 99.75 37.2 62.55
G-10 Kaymurri x 3774-13 (RIL-71) 37.5 81.75 44.25 94.95 41.75 53.2
G-11 Kaymurri x 3774-13 (RIL-45) 36 82 46 94.05 37 57.05
G-12 Kaymurri x 3774-13 (RIL-72) 37 81.5 44.5 93.9 36.55 57.35
G-13 Kaymurri x 3774-13 (RIL-87) 38 82.5 44.5 96.25 36.6 59.65
G-14 Kaymurri x 3774-13 (RIL-133) 36.25 80.25 44 90.75 35.25 55.5
G-15 Kaymurri x 3774-13 (RIL-66) 38.75 82.5 43.75 102.15 41.8 60.35
G-16 Kaymurri x 3774-13 (RIL-10) 36.75 82.25 45.5 94.9 35.65 59.25
G-17 Kaymurri x 3774-13 (RIL-80) 38.25 82.75 44.5 94.45 36.75 57.7
G-18 Kaymurri x 3774-13 (RIL-55) 35.75 80.5 44.75 96.6 37.65 58.95
G-19 Kaymurri x 3774-13 (RIL-68) 38.25 82.5 44.25 97.85 38.45 59.4
G-20 Kaymurri x 3774-13 (RIL-105) 37.5 80.75 43.25 90.75 35.1 55.65
G-21 GA-10-3 X Kaymurri (RIL-241) 38 82.5 44.5 93.4 38.7 54.7
G-22 kaymurri x 3774-13 (RIL-144) 38.25 83.25 45 101.9 38.2 63.7
G-23 DZ-Cr-387 X GA-10-3 (RIL-168) 35.5 80.25 44.75 92.35 37 55.35
G-24 GA-10-3 X Kaymurii (RIL-196) 35.5 82.75 47.25 89.75 32.6 57.15
G-25 DZ-Cr-387 X GA-10-3 (RIL-217) 39.75 83 43.25 102.75 41.65 61.1
G-26 Kaymurri x 3774-13 (RIL-7) 36 81.75 45.75 98.4 36.15 62.25
G-27 GA-10-3 X Kaymurii (RIL-257) 35.25 80.5 45.25 93.45 34.6 58.85
G-28 DZ-Cr-387 X GA-10-3 (RIL-181) 34.75 79.75 45 96.95 34.85 62.1
G-29 GA-10-3 X Kaymurii (RIL-186) 36.25 81.5 45.25 94.55 33.45 61.1
G-30 DZ-Cr-387 X GA-10-3 (RIL-193) 35.5 84.25 48.75 93.15 36.75 56.4
G-31 GA-10-3 X Kaymurii (RIL-263) 36.75 81.5 44.75 99.95 38.7 61.25
G-32 GA-10-3 X Kaymurii (RIL-143) 38.5 80.75 42.25 96.2 40.8 55.4
G-33 Kaymurri x 3774-13 (RIL-215) 37.25 80 42.75 93.95 33.5 60.45
G-34 DZ-Cr-387 X GA-10-3 (RIL-156) 37.75 81.5 43.75 111.9 45.8 66.1
G-35 DZ-Cr-387 X GA-10-3 (RIL-154) 35.25 81.5 46.25 89.8 35.8 54
G-36 DZ-Cr-387 X GA-10-3 (RIL-212) 38.25 82.5 44.25 104.3 43.8 60.5
G-37 Kaymurri x 3774-13 (RIL-220) 37.75 80.75 43 96 37.35 58.65
G-38 Kaymurri X 3774-13 (RIL-110) 37.5 81 43.5 92 33.1 58.9
G-39 Kaymurri X 3774-13 (RIL-218) 36 79.25 43.25 89.5 31.85 57.65
G-40 GA-10-3 X Kaymurri (RIL-9) 37 80.25 43.25 93.4 31.75 61.65
G-41 GA-10-3 X Kaymurri (RIL-12) 37 80.75 43.75 96.3 35.9 60.4
G-42 Kaymurri X 3774-13 (RIL-136) 37.5 80.5 43 94.8 33.1 61.7
G-43 GA-10-3 X Kaymurri (RIL NO. 146) 36.5 80.25 43.75 91.4 34.3 57.1
G-44 Kaymurri X 3774-13 (RIL NO. 60) 37 81 44 97.7 39.8 57.9
G-45 GA-10-3 X Kaymurri (RIL NO. 52) 37.25 79.5 42.25 94.4 40.2 54.2
G-46 Kaymurri X 3774-13 (RIL NO. 58) 38.75 83.25 44.5 91.15 34.6 56.55
G-47 DZ-Cr-387 X GA-10-3 (RIL NO. 72) 35.5 83.5 48 98.35 37.75 60.6
G-48 Quncho 39 82 43 105.8 41.05 64.75
G-49 Boset 35.25 81.25 46 91.95 34.45 57.5
Minimum 34.75 79.25 42.25 75 30.1 42.85
Maximum 39.75 84.25 48.75 111.9 45.8 66.1
Mean 37.04 81.51 44.47 95.11 36.71 58.40
Table 3. Continued.
Genotype # Pedigrees/Crosses LI SBM (t/ha) GY (Kg/ha) HI% Yield advantage over standard
G-1 Kaymurri x 3774-13 (RIL-173) 70.4 66.25 14.325 21.938 31.87
G-2 Kaymurri x 3774-13 (RIL-202) 60.75 56.25 9.225 18.513 -15.08
G-3 GA-10-3 X Kaymurri (RIL-275) 62.5 55 12.538 23.62 15.42
G-4 GA-10-3 X Kaymurri (RIL-192) 76 48.75 9.888 21.865 -8.98
G-5 GA-10-3 X Kaymurri (RIL-171) 64.25 25 5.688 31.275 -47.64
G-6 GA-10-3 X Kaymurri (RIL-261) 67.6 55 11.213 22.643 3.22
G-7 GA-10-3 X Kaymurri (RIL-273) 67.75 57.5 12.363 20.77 13.81
G-8 Kaymurri x 3774-13 (RIL-147) 61.5 51.25 8.7 17.75 -19.91
G-9 GA-10-3 X Kaymurri (RIL-248) 69 56.25 13.075 23.47 20.36
G-10 Kaymurri x 3774-13 (RIL-71) 73.5 52.5 12.375 24.155 13.92
G-11 Kaymurri x 3774-13 (RIL-45) 60 60 9.225 15.218 -15.08
G-12 Kaymurri x 3774-13 (RIL-72) 61.75 70 14.7 22.135 35.32
G-13 Kaymurri x 3774-13 (RIL-87) 52.5 55 10.825 20.285 -0.35
G-14 Kaymurri x 3774-13 (RIL-133) 54.75 47.5 8.4 20.065 -22.67
G-15 Kaymurri x 3774-13 (RIL-66) 65 71.25 8.688 12.648 -20.02
G-16 Kaymurri x 3774-13 (RIL-10) 51.45 58.75 10.55 18.048 -2.88
G-17 Kaymurri x 3774-13 (RIL-80) 58.25 51.25 7.063 14.7 -34.98
G-18 Kaymurri x 3774-13 (RIL-55) 58.75 58.75 8.8 15.753 -18.99
G-19 Kaymurri x 3774-13 (RIL-68) 71 58.75 13.313 23.765 22.55
G-20 Kaymurri x 3774-13 (RIL-105) 65.25 50 12.125 25.018 11.62
G-21 GA-10-3 X Kaymurri (RIL-241) 66.5 72.5 11.788 20.44 8.52
G-22 kaymurri x 3774-13 (RIL-144) 62 57.5 7.988 14.108 -26.47
G-23 DZ-Cr-387 X GA-10-3 (RIL-168) 66.75 50 10.463 21.028 -3.68
G-24 GA-10-3 X Kaymurii (RIL-196) 54.5 51.25 11.963 23.835 10.13
G-25 DZ-Cr-387 X GA-10-3 (RIL-217) 73.5 60 8 13.543 -26.36
G-26 Kaymurri x 3774-13 (RIL-7) 62.55 70 12.325 17.93 13.46
G-27 GA-10-3 X Kaymurii (RIL-257) 61.5 52.5 9.438 18.018 -13.12
G-28 DZ-Cr-387 X GA-10-3 (RIL-181) 64.75 51.25 10.925 21.355 0.57
G-29 GA-10-3 X Kaymurii (RIL-186) 79 77.5 13.075 20.27 20.36
G-30 DZ-Cr-387 X GA-10-3 (RIL-193) 68 50 12.913 25.72 18.87
G-31 GA-10-3 X Kaymurii (RIL-263) 69.2 60 9.825 16.383 -9.56
G-32 GA-10-3 X Kaymurii (RIL-143) 68.5 93.75 10.75 14.73 -1.04
G-33 Kaymurri x 3774-13 (RIL-215) 66.65 52.5 10.225 19.398 -5.87
G-34 DZ-Cr-387 X GA-10-3 (RIL-156) 70.25 51.25 9.625 18.245 -11.40
G-35 DZ-Cr-387 X GA-10-3 (RIL-154) 71 46.25 9.713 22.76 -10.59
G-36 DZ-Cr-387 X GA-10-3 (RIL-212) 60.75 61.25 8.088 13.928 -25.55
G-37 Kaymurri x 3774-13 (RIL-220) 66.25 60 13.488 22.94 24.16
G-38 Kaymurri X 3774-13 (RIL-110) 49.75 51.25 6.95 15.545 -36.02
G-39 Kaymurri X 3774-13 (RIL-218) 62.35 45 8.5 18.795 -21.75
G-40 GA-10-3 X Kaymurri (RIL-9) 59 47.5 6.263 13.998 -42.35
G-41 GA-10-3 X Kaymurri (RIL-12) 66.25 58.75 12.663 22.285 16.57
G-42 Kaymurri X 3774-13 (RIL-136) 56.9 47.5 7.8 17.025 -28.20
G-43 GA-10-3 X Kaymurri (RIL NO. 146) 51.75 40 8.713 23.345 -19.79
G-44 Kaymurri X 3774-13 (RIL NO. 60) 55.75 61.25 9.4 15.698 -13.47
G-45 GA-10-3 X Kaymurri (RIL NO. 52) 76 61.25 10.138 16.663 -6.67
G-46 Kaymurri X 3774-13 (RIL NO. 58) 57.65 38.75 7.075 20.483 -34.87
G-47 DZ-Cr-387 X GA-10-3 (RIL NO. 72) 71.75 52.5 8.25 16.138 -24.05
G-48 Quncho 64 56.25 6 12.86 -44.77
G-49 Boset 68.25 53.75 10.863 20.163 -
Minimum 49.75 25 5.688 12.648
Maximum 79 93.75 14.7 31.275
Mean 64.06 55.89 10.11 19.40
LSD 0.05 13.18 19.55 3.14 7.85
DTH: days to heading, DTM: days to maturity, GFP: grain filling period, PH: plant height, PL: panicle length, CL: culm length, LI: lodging index, ABM: above ground biomass, GY: grain yield, HI: harvest index.
4. Conclusion
Tef is very important cereal crop which plays a crucial role in the Ethiopian deit. The expansion of its cultivation to the area where tef is not primary grown is useful to increasing the amount of production in the country and also able to improve the gap between demand and production relatively.
Those genotypes which have more than 10% of yield advantage over the best check were selected as interesting genotypes and they are advanced to the next breeding stage being evaluated as a regional variety trail.
References
[1] Abraham R. Achieving food security in Ethiopia by promoting productivity of future world food tef: a review. Adv Plants Agric Res, 2015. 2 (2): p. 00045.
[2] Alemayehu R. TEF: Post-harvest Operations. Institute of Agricultural Research Organization, Holetta Agricultural Research Center (IARO), Edited by AGSI/FAO. 2001.
[3] AsARC. Assosa Agricultural Research Center. Farming system survey document. Assosa, Benishangul-Gumuz Regional State, Ethiopia. 2007.
[4] Bedane G. M., Saukuru A. M., George D. L. and Gupta M. L. Evaluation of Teff (Eragrostis tef [Zucc.] Trotter) Lines for Agronomic Traits in Australia. Australian Journal of Crop Science, 2015. 9 (3): p. 242.
[5] Bultosa G., Hall A. N. and Taylor J. R. Physico chemical characterization of grain tef [Eragrostis tef (Zucc.) Trotter] starch. Starch Stärke, 2002. 54 (10): p. 461-468.
[6] Caldicott J. J. B. and Nuttall A. M. A method for the assessment of lodging in cereal crops. Journal of the National Institute of Agricultural Botany, 1979.
[7] CSA. Central Statistical Agency. Agricultural sample survey for 2016/17. Addis Ababa, Ethiopia. Statistical Bulletin 1. 2017.
[8] FAO. FAO, IFAD, and WFP. The state of food insecurity in the world 2015: meeting the 2015 international hunger targets: taking stock of uneven progress. Rome: FAO, 2015. 2015.
[9] Gomez K. A. and Gomez A. A. Statistical Procedures for Agricultural Research, 2nd edn. New York: Wiley. 1984.
[10] Kebebew A., Seyfu K., Hailu T., Nguyen H. T., et al. Diversity among germplasm lines of the Ethiopian cereal tef [Eragrostis
tef (Zucc.) Trotter]. Euphytica, 1999. 106: p. 87-97.
[11] Kebebew A., Seyfu K., Hailu T., Teruneh K. and Fufa H. Trait diversity, heritability and genetic advance in selected germplasm lines of tef [Eragrostis tef (Zucc.) Trotter]. Hereditas, 2000. 133: p. 29-37.
[12] Melak-Hail M. Chemical composition of Teff (Eragrostis tef) compared with that of wheat, barley and grain sorghum. Econ. Bot, 1966. 19: p. 268-273.
[13] Misgana M. Genetic Variability of Tef [Eragrostis tef (Zucc.) Trotter] Genotypes for Soil Acidity Tolerance in Assosa, Western Ethiopia. Plant and Horticultural Science, 2018. MSc. Thesis, p. 101.
[14] Mizan T. A., Hussein S., Laing M. and Kebebew A. Performance of Tef [Eragrostis tef (Zucc.) Trotter] Genotypes for Yield and Yield Components Under Drought-Stressed and Non-Stressed Conditions. Crop Science, 2016. 56: p. 1799-1806.
[15] Mizan T. A., Shimelis H., Mark L. and Kebebew A. Genetic variation and trait association of tef [Eragrostis tef (Zucc.) Trotter] evaluated under optimal and moisture stressed environments. Australian Journal of Crop Science, 2017. 11 (3): p. 241-247.
[16] Plaza-Wüthrich S., Gina C. and Zerihun T. Genetic and phenotypic diversity in selected genotypes of tef [Eragrostis tef (Zucc.) Trotter. African Journal of Agricultural Research, 2013. 8 (12): p. 1041-1049.
[17] Samuel H. Assessing the resilience of the tef value chain in Ethiopia. Department of Environmental Systems Science, 2015. MSc. Thesis, p. 163.
[18] Spaenij Dekking L., Kooy Winkelaar Y. and Koning F. The Ethiopian cereal tef in celiac disease. New England Journal of Medecine, 2005. 353: p. 1748-1749.