508 |
P a g e
AN EXPERT SYSTEM FOR DIAGNOSIS OF
NEUROPSYCHIATRIC DISEASE
Shabeeha Khatoon
1, Kavita Agarwal
2, Ravi Prakash Verma
3 1Masters degree Student, computer science and engineering, Integarl university , (India)
2,3
Assistant Professor,Deptt. Of computer science and engineering,Integarl university(India)
ABSTRACT
Intelligent computing methods have been mostly used to the diagnosis of Neuro-Psychiatric Abnormalities
dependent on EEG signals. A new approach made by research scholars to integrate Case based system along
rule-based system (RBS) and Bayesian Model, this enhance the reasoning and computational efficiency of the
problem-solving method. In this paper an integrated model of CBS for making cases, RBS is used for representing
the inter relation of different symptoms with diseases by making different rules, and Bayesian methods is used for
the probabilistic calculation. The Integration of these three methods is used for interpretation and diagnosis of
Neuropsychiatric diseases based on electro encephalon graph and as well as FMRI symptoms. In this method
first of all CBR is used for calculating similarity by using Jaccard coefficient, if similarity is not matched with
calculated threshold value then a model is developed by using RBR and on the basis of this models Bayesian is
applied for the process of diagnosis of the Neuropsychiatric diseases. The main objective of this work is to
improve the computational effort with certain level of efficiency, accuracy and decision support.
Keywords - CBS, RBS, Prior probability ,Conditional probability, Joint probability, Dependent
probability, Cognitive
I. INTRODUCTION
Intelligent Calculation is taken to include the development and application of artificial intelligence (Al) methods
tools i.e. who have characteristics associated with intelligence in human behavior. Artificial Intelligence is the
study of ideas that enable computers to do things that make people seem intelligent[9].The central objectives of
the artificial intelligence are to make it more useful and to understand the principles that make
intelligence possible. Many approaches have been proposed to apply Al methods,[14] techniques and paradigms
to the solution of manufacturing problems. Intelligent computer systems and knowledge based systems (KBS)
have been used in the medical diagnosis, planning, and treatment. Knowledge-based systems (KBS) composed of
case-based reasoning (CBR), based on rules, reasoning (RBR) and based on a logic model (MBR) .then that smart
computing method (ICM) are made up of artificial neural networks (ANN), genetic algorithm (GA), fuzzy logic
(FL) and other. The combination of methods of KBS such that RBR-CBR, MBR-CBR and CBR-RBR-MBR and
509 |
P a g e
of ICM to KBS is ANN-RBR, ANN-CBR, ANN-RBR-CBR, FL-RBR, FL-CBR and FL-CBR-ANN. We canmake diseases description table by its different syndromes (Table 1) for the neuropsychiatric diseases on the basis
of their three important parameters: Pysical, Psychophysical syndromes, EEG parameters and brain image (FMRI)
analysis. Psychophysical syndromes is further divided into three parts: Psychological syndrome consisting of 12
sub syndromes such as: Anger , Abnormal Behavior , Anxiety, Agitation , Delusion , Distraction of Work , Fear ,
Hallucination , Need of Perfection , Stress , Hyper Activity ; and Cognitive syndrome consisting of 8 syndromes
such as: Confusion in Decision Making , Hearing , Judgment , Learning , Forgetting Memory , Reasoning ,
Speech and Vision ; and Physical syndromes consisting of 8 syndromes such as: Climbing , Walking , Hearing ,
Locomotion , Vision , Speech , Over Sleeping and Hygiene . The EEG signal characteristics are ACC , CG ,
Frontal , Perietal , Oclipetal , and Temporal . The Image (FMRI) characteristics are ACC , CG , Frontal , Perietal,
Oclipetal , Temporal and BG . In Table 1 first Coolum contains diseases. The second column contains syndromes
of the diseases. The columns contain “1” if the respective symptoms is present in the disease shown in that row.
For example,ADHD has Psychological syndrome such as: Anger ,Abnormal Behavior ,Anxiety ,Agitation ,
Distraction of Work , hyper activity . Therefore, the columns contain “1” as in Table 1.The third and fourth columns of the Table 1 contains EEG and FMRI parameters such as of a particular row contain “1” or “0”
depending upon whether the particular symptom present or not in that particular disease.
II. METHODOLOGY
2.1 Case Based System (CBS)
Case based reasoning system design which has been worked as follows (Fig-1). When a new problem is come,
510 |
P a g e
suggested solution, and then revision stage corroborate the solution, then retain stage can store the new case in theprevious base of case[8][9][13][15][17].
Fig-1 CBR System
Similarity Calculation
In this method we are calculating similarity by using Jacquard Coefficient. The Jacquard index, also known as
the Jacquard similarity coefficient (originally coined coefficient de communauté by Paul Jacquard), is
a statistic used for comparing the similarity and diversity of sample sets[18][21].
2.1.1 Similarity of Asymmetric Binary Attributes
Given two objects, a and b , each with n binary attributes, the Jacquard coefficient is a useful for finding of the
overlap that a and b share with their attributes[1][3][7][8]. Each attribute of a and b can either be 0 or 1. The total
number of each combination of attributes for both a and b are specified as follows:
a. represents the total number of attributes where a and b both have a value of 1.
b. represents the total number of attributes where the attribute of a is 0 and the attribute of b is 1.
c. represents the total number of attributes where the attribute of a is 1 and the attribute of b is 0.
d. represents the total number of attributes where A and B both have a value of 0.
Each attribute must fall into one of these four categories, meaning that
q+r+s+t=n
The Jaccard similarity coefficient, S(I,j), is given as:
S(I,j)= q/(q+r+s)
The Jaccard distance, dJ, is given as:
d(I,j)=r+s/(q+r+s)
2.2 Rule-Based System (RBR)
RBR is the process of drawing conclusions by linking together generalized rules, starting from scratch. Basically, RBR
models are rooted in the philosophy belief that humans are rational beings and that the laws of logic are the laws of thoughts
[5].Although some rules are very specific, the goal is to formulate rules that are generally applicable [5]. One very important
advantage of rules is the economy of storage they allow as compared to the storage of cases in CBR system. We believe that
511 |
P a g e
when rules R111, R112 and R113 are satisfied then R11 satisfied and when R11, R12 and R13 are satisfied then R1 is satisfied.
Similarly as Table 2, rules for other diseases of are generated to any lower level to upper level. The hierarchal model will help
to compute diseases probability. Rule-based model shows modular representation of the facts. Modules can be hierarchically
related as shown in tree structure. Sign and symptoms at the lowest level are correlated to the parameters at the higher level
and also the lower level parameters to the higher level parameters. In t his way, going from bottom to up i.e. lower to higher
level and after travel of certain level we reach to the highest level i.e. root level.
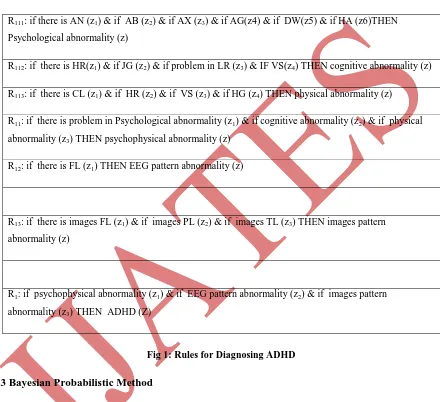
R111: if there is AN (z1) & if AB (z2) & if AX (z3) & if AG(z4) & if DW(z5) & if HA (z6)THEN
Psychological abnormality (z)
R112: if there is HR(z1) & if JG (z2) & if problem in LR (z3) & IF VS(z4) THEN cognitive abnormality (z)
R113: if there is CL (z1) & if HR (z2) & if VS (z3) & if HG (z4) THEN physical abnormality (z)
R11: if there is problem in Psychological abnormality (z1) & if cognitive abnormality (z2) & if physical
abnormality (z3) THEN psychophysical abnormality (z)
R12: if there is FL (z1) THEN EEG pattern abnormality (z)
R13: if there is images FL (z1) & if images PL (z2) & if images TL (z3) THEN images pattern
abnormality (z)
R1: if psychophysical abnormality (z1) & if EEG pattern abnormality (z2) & if images pattern
abnormality (z3) THEN ADHD (Z)
Fig 1: Rules for Diagnosing ADHD
2.3 Bayesian Probabilistic Method
Bayesian statistics are about the alteration of belief. Bayesian statisticians look into statistically optimal ways of
combining new information with old beliefs .Prior probability – personal belief or data. Input. Likelihood –
likelihood of data given hypothesis. Posterior probability – probability of hypothesis given data. The
term Bayesian refers to Thomas Bayes (1702–1761), who proved a special case of what is now called Bayes'
theorem in a paper titled "An Essay towards solving a Problem in the Doctrine of Chances"[9]. In that special
case, the prior and posterior distributions were Beta distributions and the data came from Bernoulli trials. It
was Pierre-Simon Laplace(1749–1827) who introduced a general version of the theorem and used it to approach
problems in celestial mechanics, medical statistics, reliability, and jurisprudence.[10] Early in Bayesian inference,
"inverse probability" was an uniform priors following Laplace's principle of insufficient reason, was called
512 |
P a g e
"inverse probability" was heavily replaced by a collection of methods that came to be called bayesianstatistics.[11]
Bayes' theorem is stated mathematically as the following simple form:
Where:
P(A), the prior probability, is the initial degree of belief in A.
P(A|B), the conditional probability, is the degree of belief having accounted for B.
the quotient P(B|A)/P(B) represents the support B provides for A.
Another form of Bayes Theorem that is generally encountered when looking at two competing statements or
hypotheses is:
P(A|B) = P(B|A) P(A)/P(B/A)P(A)+ P(B|-A) P(-A)
Where:
1. P(A),the prior probability, is the initial degree of belief in A.
2. P(-A), is the corresponding probability of the initial degree of belief against A: 1-P(A)=P(-A)
3. P(B|A), the conditional probability, is the degree of belief in A, given evidence or background B.
4. P(B|-A), the conditional probability, is the degree of belief against A, given evidence or background B.
5. P(A|B), the posterior probability, is the probability for A after taking into account B for and against A.
Prior Probability:
In Bayesian statistic inference, a prior probability distribution, is often called as simply the prior, of an unsure
quantity p is the probability distribution that would express one's uncertainty about p before some evidence is
taken into account.
There are two types of prior probabilities:
Conditional Probability:
In probability theory, a conditional probability measures the probability of an event given that (by assumption,
presumption, assertion or evidence) another event has occurred. If the events are A and B respectively, this is said
to be "the probability of a given value of B", and is represented by P(A|B), or sometimes PB(A). In case that both
"A" and "B" are categorical variables, conditional probability table is typically used to represent the conditional
probability.
Posterior Probability:
In Bayesian statistics, the posterior probability of a random event or an uncertain proposition is the conditional
probability that is assigned after the relevant evidence or background is taken into account. The posterior
513 |
P a g e
on the evidence obtained from an experiment or survey. "Posterior", in this context, means after taking intoaccount the relevant evidence related to the specific case being examined.
III. PROPOSED SYSTEM
There are three main steps for the diagnosis,
1. Use case based reasoning system for diagnosis
2. Use Rule based reasoning system for modeling
3. Use Bayesian Probabilistic model for Probability
calculation
Steps involves in the algorithm are,
Step 1. Create a case based for new case
Step 2. Retrieve [search the existing similar case by Jacard Coeeficient]
(i) Problem Identification phase
(ii) Matching phase
(iii) Selecting
Step 3. Reuse
Step 4. Revise
Step 5. Retain
Step 6. Similarity value is compared by threshold value
Step 7. Value is in Normal patient given threshold value
Step 8. Display Patient is Normal
Step 9. Used RBR for generating rules
Step 10. Calculate Probability
(i) Calculate Prior Probability
(ii) Calculate conditional Probability
(iii) Calculate Joint Probability
(iv) Calculate Dependent Probability
(v) Calculate Probability for Disease
3.1 Algorithm
514 |
P a g e
2. Create CBR for different diseases
3. Calculate Similarity S=q/q+r+s
4. If (S<= given ThN )
5. {
6. Display(“Normal”)
7. }
8. Else if(S>=ThN & S<=)
9. {
10. Adapt the most similar case
11. Modified the receive case with Intelligent human Reason
12. Save the NC and update the index
13. }
14. Else
15. {
16. Create the RBR
17. Calculate PP
18. Calculate CP
19. Calculate JP
20. Calculate DP
21. Calculate PD
22. }
23. Provide the solution to the user
24. }
VI. CONCLUSION
By using this method, diagnosis of similar cases that occurred normally in neuropsychiatric abnormality is easily
diagnose and will be given the appropriate solution if the similarity value is with in the given threshold value
range Otherwise the diagnosis is done by using integrated method of RBR with Bayesian .Also this solution will
reduce the time of process and will increase the processing speed and also save the memory space.
V. FUTURE SCOPE
The signs and symptoms of neuropsychiatry anomaly have been taken from the literature and from the
consultation with the doctor and the researchers in the field. The sign, the symptoms can be changed or become
unanimously, in consultation with several number of doctors and experiences in clinical environments. The
experimentation in clinical environment could confirm the effectiveness of this method which is in question for
515 |
P a g e
REFERENCES
[1] Patel V. et al. (1997), British Journal of Psychiatry (1997). Volume 171, 60-64.
[2] Thom R.S.M, Zwi R.M and Reinach S.G. (1993), The Prevalence of Psychiatric disorders at a Primary
Care Clinic – Soweto, Johannesburg South Africa. Medicine Journal 1993, 83, 653-655.
[3] Fogel BS, Schiffer, RB, Rao, SM (1996) (eds.), Neuropsychiatry. Baltimore: Williams and Wilkins, 1996.
[4] James J. Heckman & James M. Snyder, Jr., 1996. "Linear Probability Models of the Demand for Attributes
with an Empirical Application to Estimating the Preferences of Legislators," NBER Working Papers 5785,
National Bureau of Economic Research, Inc.
[5] Stephenson, T. A. (2000). An Introduction To Bayesian Network Theory And Usage , Institut Dalle Molle
d'Intelligence Artificielle Perceptive, Technical Report IDIAP-RR00-03,2000.
[6] Liping AN, Jianyuan YAN,” An Integrated Rule-based and Case-based Reasoning System for Customer
Service Management”, Proceedings of the 2005 IEEE International Conference on e-Business Engineering
(ICEBE’05)
[7] Watson, I., Applying Case-Based Reasoning : Techniques for Enterprise Systems, San Fransisco: Morgan
Kauffman Publishers, Inc., 2011
[8] Mohit Gangwar ,” Intelligent Computing Method for the Interpretation of Neuropsychiatric
Diseases”International Journal of Computer Applications (0975 – 8887) Volume 55– No.17, October
2012
[9] Hindayati Mustafidah#1, Suwarsito* “Fish Diseases Control System Using Case-Based Reasoning”2010
International Conference on Distributed Framework for Multimedia Applications (DFmA)
[10] Guo-Cyuan Chen; Chia-Feng Juang (2013). "Object Detection Using Color Entropies and a Fuzzy
Classifier". IEEE Computational Intelligence Magazine8 (1). pp. 33–45.doi:10.1109/MCI.2012.2228592.
[11] P.J.F. Lucas. Certainty-like structures in Bayesian belief networks. Knowledge-based Systems (2001).
[12] P.J.F. Lucas and A.R. Janssens. Development and validation of HEPAR. MedicalInformatics 16(3) (2013)
259{270.
A. Oni_sko, M.J. Druzdzel, and H. Wasyluk. Extension of the Hepar II model to multiple-disorder diagnosis.
In: S.T. Wierzcho_n M. K lopotek, M. Michalewicz (Eds.). Intelligent Information Systems. Advances in
Soft Computing Series (Physica-Verlag Heidelberg, 2007) 303{313.
[13] Russell A. Barkley” Behavioral Inhibition, Sustained Attention, and Executive Functions:Constructing a
Unifying Theory of ADHD” Psychological Bulletin 2007, Vol. 121, No. 1. 65-94
[14] Peter M. Wehmeier, Alexander Schacht and Russell A. Barkley, “Social and Emotional Impairment in
Children and Adolescents with
A. ADHD and the Impact on Quality of Life”, Journal of Adolescent Health 46 (2010) 209–217
[15] McGonigal A, Bartolomei F, Regis J, Guye M, Gavaret M, Fonseca AT-D, Dufour H, Figarella-Branger D,
Girard N, Peragut JC, Chauvel P. Stereoelectroencephalography in presurgical assessment of MRI-negative
epilepsy.Brain 2007;awm218
[16] Hamer HM, Morris HH, Mascha EJ, Karafa MT, Bingaman WE, Bej MD, Burgess RC, Dinner DS,
516 |
P a g e
[17] Complications of invasive video-EEG monitoring with subdural grid electrodes. Neurology2012;58:97-103.
[18] Lemieux L, Salek-Haddadi A, Josephs O, Allen P, Toms N, Scott C, Krakow K, Turner R, Fish DR.
Event-related fMRI with simultaneous and continuous EEG: description of the method and initial case report.
NeuroImage 2011;14:780-7.
[19] Humberto Quintana a,⁎, Steven M. Snyder b, William Purnell,” Comparison of a standard psychiatric
evaluation to rating scales and EEG in the differential diagnosis of attention-deficit/hyperactivity
disorder”,Science Direct Psychiatry Research 152 (2007) 211–222
[20] Andrew M. Michael, Vince D. Calhoun, Nancy C. Andreasen, Stefi A. Baum,” A Method to Classify
Schizophrenia Using Inter-Task Spatial Correlations of Functional Brain Images”, 30th Annual
International IEEE EMBS Conference Vancouver, British Columbia, Canada, August 20-24, 2008
[21] Hajar Mat Jani, Lee Sai Peck, PhD,” Applying Machine Learning using Case-Based Reasoning (CBR) and
Rule- Based Reasoning (RBR) Approaches to Object-Oriented Application Framework Documentation”,
Third International Conference on Information Technology and Applications (ICITA’05)
0-7695-2316-1/05 $20.00 © 2005 IEEE
[22] Suphakit Niwattanakul, Jatsada Singthongchai, Ekkachai Naenudorn and Supachanun Wanapu,” Using of
Jaccard Coefficient for Keywords Similarity”, Proceedings of the International MultiConference of