Effects of Reduced Juice Allowances in Food Packages
for the Women, Infants, and Children Program
WHAT’S KNOWN ON THIS SUBJECT: Juice consumption among 2- to 5-year-old children exceeds dietary recommendations. In 2007, the US Department of Agriculture revised the composition and quantities of prescribed foods in WIC food packages to align them with dietary guidelines. Juice allowances were reduced by approximately half.
WHAT THIS STUDY ADDS: WIC participants purchased about a quarter less juice volume after implementation of the revised WIC packages. Large reductions in WIC-provided juice were only partly compensated for by extra juice purchases with non-WIC funds. Little compensation occurred for other beverages.
abstract
OBJECTIVES:In 2009, the Special Supplemental Nutrition Program for Women, Infants, and Children (WIC) implemented revisions to the com-position and quantities of WIC food packages. Juice allowances were reduced by approximately half. This report describes changes in pur-chases of 100% juice and other beverages among WIC participants af-ter the WIC revisions.
METHODS:Scanner data from a New England supermarket chain were used to assess juice and other beverage purchases among 2137 WIC-participating households during a 2-year period (N = 36 051 household-months). Purchased beverage amounts were compared before (January–September 2009) and after (January–September 2010) implementation of the revised WIC packages. Generalized estimating equation models were used.
RESULTS:Before the revisions, WIC juice accounted for two-thirds of purchased juice volume among WIC households. After implementation of the revisions, WIC juice purchases were reduced on par with allowance changes (43.5% of juice volume, 95% confidence interval [CI] 41.9%–45.1%). This reduction was only partly compensated for by an increase of 13.6% (8.4%–19.0%) in juice purchases using personal and other non-WIC funds. In total, juice purchases declined by 23.5% (21.4%–25.4%) from an adjusted monthly total of 238 oz to 182 oz per household. WIC households increased purchases of fruit drinks by 20.9% (14.9%–27.3%) and other noncarbonated beverages by 21.3% (12.1%–31.2%) but purchased 12.1% (8.1%–15.0%) less soft drinks.
CONCLUSIONS:After the WIC revisions, total purchases of 100% juice among WIC households declined by about a quarter, with little compen-sation occurring from non-WIC funds for juice and other beverages. The public health impact of the shift in beverage purchase patterns could be significant.Pediatrics2013;131:919–927
AUTHORS:Tatiana Andreyeva, PhD,aJoerg Luedicke, MS,a
Amanda S. Tripp, MPH,band Kathryn E. Henderson, PhDa
aRudd Center for Food Policy and Obesity, andbYale School of Public Health, Yale University, New Haven, Connecticut
KEY WORDS
food assistance, WIC, juice, food policy
ABBREVIATIONS
EBT—electronic benefit transfer
SNAP—Supplemental Nutrition Assistance Program UPC—Universal Product Code
WIC—Special Supplemental Nutrition Program for Woman, Infants, and Children
Dr Andreyeva conceptualized and designed the study, carried out initial analyses, contributed to drafting and revising the initial manuscript, and approved thefinal manuscript as submitted; Mr Luedicke carried out thefinal analyses, contributed to drafting and revising the initial manuscript and interpretation of results, and approved thefinal manuscript as submitted; Ms Tripp contributed to data preparation and analyses, revised the initial manuscript and interpreted results, and approved thefinal manuscript as submitted; and Dr Henderson contributed to drafting and revising the initial manuscript and interpretation of results and approved thefinal manuscript as submitted.
The views expressed in this article are those of the authors and do not necessarily represent the official views of Economic Research Service or US Department of Agriculture.
www.pediatrics.org/cgi/doi/10.1542/peds.2012-3471
doi:10.1542/peds.2012-3471
Accepted for publication Jan 29, 2013
Address correspondence to Tatiana Andreyeva, Rudd Center for Food Policy and Obesity, Yale University, 309 Edwards St, New Haven, CT 06520-8369. E-mail: [email protected]
PEDIATRICS (ISSN Numbers: Print, 0031-4005; Online, 1098-4275).
Copyright © 2013 by the American Academy of Pediatrics
FINANCIAL DISCLOSURE:The authors have nofinancial relationships relevant to this article to disclose.
The Special Supplemental Nutrition Pro-gram for Women, Infants, and Children (WIC) has provided a set of nutrient-dense foods, nutrition education and medical referrals to approximately half of all infants born in the United States and a quarter of all children ages 1–4, pregnant and postpartum women.1Due to its broad reach and targeted impact on young children at high risk, WIC has significant capacity for early in-tervention to establish healthy eating habits and prevent obesity in low-income youth. In 2009, on recommendation from the Institute of Medicine, WIC imple-mented revised WIC food packages that align with dietary guidelines to consume less fat and sugar and more fiber.2 Noteworthy changes included a re-duction in dairy fat, the addition of whole grains and cash-value vouchers for fruits and vegetables, and reduced milk and juice allowances. These were the largest WIC package changes since the program’s inception in 1972, which pro-vided a unique natural experiment for assessing effects of the revisions on behavior and nutrition outcomes in low-income communities.
Before the WIC food package revisions, the federal monthly allowance of 100% juice to WIC-participating 1- to 4-year-old children was 288 oz, although some states provided less juice (eg, 192 oz in Connecticut and 184 oz in Massachusetts).3 These provisions largely exceeded dietary recommenda-tions for juice consumption in young children (4 oz/d4,5). After the revisions, WIC-participating children in all states receive 128 oz/mo. Juice is no longer allowed for infants; women partic-ipants had their juice reduced by about half.6 Even after a considerable re-duction, WIC still provides enough juice to meet the maximum recommended level of juice intake in young children. WIC-participating children almost cer-tainly receive juice from other sources as well (eg, childcare, restaurants).7
It is currently unknown how the re-duced WIC juice allowances affected juice purchases and consumption among WIC participants. One hypothesis is that all or most of the reduction in WIC-provided juice was substituted with increased juice purchases using non-WIC funds (eg, cash). If such compen-sation occurred, no significant changes in juice consumption would be ob-served. It is also possible that WIC participants chose to substitute the lost juice allowances from WIC with in-creased purchases of less nutritious beverages such as fruit drinks or soda, which would be an unintended negative consequence of the WIC revisions. These substitutes are never allowed by WIC but could appeal to participants due to their lower cost. This study describes the effect of the WIC food package revisions on supermarket purchases of 100% juice and other beverages among a panel of WIC-participating households in New England.
METHODS
Scanner Data
The data come from a New England supermarket chain with.60 stores in two states. The chain has a loyalty card system, which provides card users with access to store promotions. At least 90% of the chain transactions include the use of a loyalty card. The current analysis excludes purchases made without the use of loyalty cards, as they cannot be tracked over time. There is no identifiable information about house-holds using loyalty cards, such as sociodemographics or availability of multiple cards per family. Each loyalty card is assumed to represent 1 house-hold. The study was based on deidenti-fied secondary data and exempt from institutional review board approval.
Data on every purchase include in-formation about products purchased and types of payment used, including SNAP benefits via electronic benefit
transfer (EBT), WIC benefits via paper-based vouchers, nonfood EBT (cash assistance), and personal funds (eg, cash). The majority of purchases (∼80%) have a single method of payment. A household’s use of SNAP, WIC, and/or nonfood EBT benefits indicates its par-ticipation in the respective program at the time of the purchase. Program participants can have purchases for which they use only personal funds; participation is assessed based on multiple purchases during each month of the analysis.
Participants
The sample is conditioned on WIC par-ticipation to provide a policy-relevant subset of low-income young families. Household WIC participation is de-termined based on the use of WIC benefits (ie, WIC purchase) at the chain. The panel is unbalanced as households joined the sample at different points in time; many did not shop at the chain every month. Approximately half of WIC households also used SNAP benefits. No data were collected for households that never participated in WIC due to income ineligibility or self-selection into non-participation.
In a pre–post design, the current study used data for households that partici-pated in WIC before and after the WIC revisions implementation in October 2009. Households were selected if they used WIC benefits during January– September 2009 and January–September 2010, excluding a 3-month transition period after the implementation to avoid misinterpretation of data.1* The WIC sample with pre–post data were also restricted to households using WIC benefits regularly (ie, at least once in each of the 3 quarters in 2009 and 2010). Each household’s purchases were aggregated at the monthly level; if
a household made multiple purchases that month, they were summed. Thefinal sample included 2137 WIC households providing 36 051 observation-months.
Beverage Identification
The grocery chain provided data on all products sold at the store, including 392 119 Universal Product Codes (UPCs) and Price-Look Up codes for products sold by weight. All beverages purchased were selected and coded for their con-tainer size, beverage type, and sweet-ener type. Two coders independently performed cross-verification of bever-age UPCs using data from the store UPC description, ingredient lists in the Gladson’s Nutrition Database,8or Inter-net searches for UPCs or brand names. A total of 615 UPCs were identified as 100% fresh (concentrate or not) or as frozen fruit or vegetable juice, all with-out added sweeteners. More details on beverage identification and categoriza-tion are available elsewhere.9
Outcome Variables
The primary outcome was total volume (or amount) of 100% juice purchased in a given month, measured influid oun-ces. In addition, juice purchases were distinguished by payment type, such as the amount of juice purchased with WIC benefits, juice purchased with personal funds or cash assistance, and juice purchased with SNAP benefits. The study also assessed changes in the purchased amounts of fruit drinks, soft drinks, bottled water, and new age beverages (ie, sports drinks, energy drinks, flavored water, and ready-to-drink tea and coffee).
Predictor Variables
The main predictor was an indicator variable for preimplementation and postimplementation periods of the WIC food package revisions: January– September 2009 and January– September 2010, respectively. A set of
household-level monthly variables in-cluded indicators for the state of the store location, household’s SNAP par-ticipation, and receipt of nonfood cash assistance (assessed based on using nonfood EBT). Total household monthly grocery expenditure was included to account for differences in available grocery funds for shopping at the grocery chain. Finally, a set of store-level variables was included to cap-ture differences in the socioeconomic composition of the areas surrounding supermarkets, which may reflect neigh-borhood differences in prices and product selection and marketing, as well as to serve as proxies for un-observed household-level sociodemo-graphics. Each store was linked to a census tract where it was located, with the census-level 5-year estimates over 2006–2010 American Community Survey data10extracted for each tract. The average of census-tract measures was calculated for household mem-bers shopping in multiple stores.
Regression Analysis
Because the outcome variables are nonnegative and positively skewed, generalized linear models from the Poisson family with a logarithmic link function11 were used. To account for repeated observations within house-holds, the models were estimated us-ing generalized estimatus-ing equations12 with an exchangeable working corre-lation and robust SEs. Each outcome was evaluated in 2 models. The first model included a binary indicator for the implementation period to esti-mate the adjusted mean difference between the 2 periods, controlling for covariates. The model can be written as:
E½YitjXi; Xit ¼expðb0þb1PERIODit
þb2STATEiþb3SNAPit
þb4EBTitþb5TOTEXPit
þb6Titþb7CitÞ ð1Þ
where PERIODit is a period indicator (coded 1 for postimplementation);
STATEitis an indicator for the state in which household i shopped; SNAPit indicates SNAP participation for house-holdiat timet, EBTitis receipt of non-food cash assistance by householdiat timet, TOTEXPitis total grocery expen-diture for householdiat timet, and Tit is a set of 8 indicator variables for the month of purchase. Citdenotes a vector of store-level sociodemographic cova-riates, reported in Table 1.
The second model analyzed temporal aspects within and between the 2 periods to rule out potential market trends, which could coincide with implementation of the WIC revisions. This was assessed by including a month of the year as a continuous covariate with second- and third-degree poly-nomials and interaction terms between the month and the implementation period to check whether the fitted slopes differed across the 2 periods. The model selection included 2 steps: models with the second- and third-degree polynomials were fit to the data, and the bestfit was determined based on the quasi-likelihood under the independence model information cri-terion and graphical and substantial assessments of the modelfit.12In the next step, interaction terms with time periods were built to test whether either quadratic or cubic slopes were statistically significantly different across the 2 periods. If this was not the case, the model without interaction terms was used. In addition, graphic inspections of the modelfit were used to check if a more parsimonious model was justified.
RESULTS
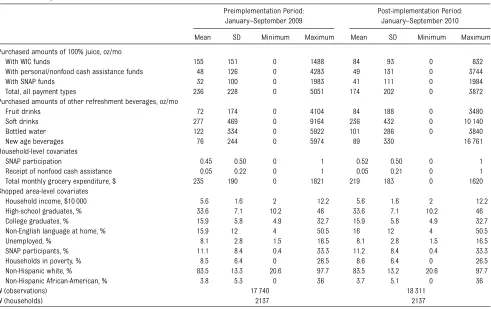
new WIC packages were implemented, WIC households purchased much less juice in total and with WIC benefits in particular, an average monthly volume of 174 and 84 oz, respectively. Juice purchases with personal funds remainedflat, whereas monthly pur-chases with SNAP benefits by SNAP households increased by 9 oz. At the same time, purchases of less nutri-tious fruit drinks increased between the 2 periods, from 72 to 84 oz/mo, on average. A similar trend was seen for new age beverages (76 to 89 oz). There was a considerable decline in pur-chases of the largest category of re-freshment beverages, soft drinks, which decreased from 277 to 236 oz, potentially reflecting ongoing mar-ket trends of shifting away from soda.13,14 WIC participants also re-duced amounts of bottled water from 122 to 101 oz.
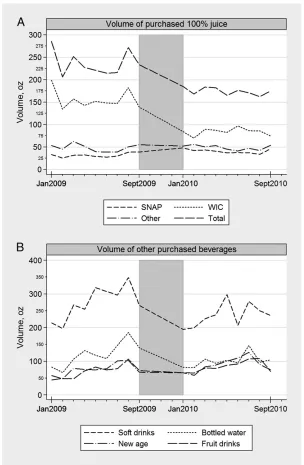
Figure 1 presents unadjusted data on purchased monthly amounts of 100% juice and other beverages in January 2009–September 2010. The expected seasonal variation reflects the peaks in purchases in July–August for all beverages and troughs in January– February for fruit drinks and other refreshment beverages, similar to general market trends.15 In contrast, 100% juice had higher than average purchases in January, especially in 2009.
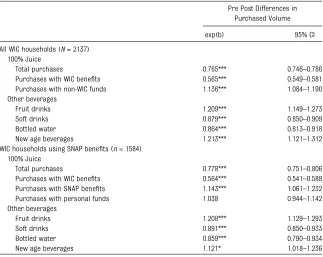
Estimation results of the pre–post implementation differences in pur-chases are reported in Table 2. The values shown are exponentiated co-efficients from the Poisson models and can be interpreted as a per-centage change in the outcome [(exp(b) 2 1) 3 100] between the preimplementation and postimple-mentation periods, after controlling
for household- and store-level cova-riates.1† After implementation, WIC participants reduced total juice pur-chases by 23.5% (95% confidence in-terval [CI] 21.4%–25.4%), from 238 to 182 oz (adjusted monthly). This re-duction was driven by a much larger decline in juice purchased with WIC benefits, by 43.5% (41.9%–45.1%), from 154 to 87 oz monthly, which reflected lower juice allowances in the revised WIC food packages. Juice purchases with personal funds, SNAP benefits and nonfood cash assistance in-creased modestly by 13.6% (8.4%– 19%), from 84 to 95 oz/mo. This in-crease in non–WIC-provided juice purchases is considerably short of matching the reductions of WIC-provided juice.
TABLE 1 Descriptive Statistics
Preimplementation Period: January–September 2009
Post-implementation Period: January–September 2010
Mean SD Minimum Maximum Mean SD Minimum Maximum
Purchased amounts of 100% juice, oz/mo
With WIC funds 155 151 0 1488 84 93 0 832
With personal/nonfood cash assistance funds 48 126 0 4283 49 131 0 3744
With SNAP funds 32 100 0 1983 41 111 0 1984
Total, all payment types 236 228 0 5051 174 202 0 3872
Purchased amounts of other refreshment beverages, oz/mo
Fruit drinks 72 174 0 4104 84 188 0 3480
Soft drinks 277 469 0 9164 236 432 0 10 140
Bottled water 122 334 0 5922 101 286 0 3840
New age beverages 76 244 0 5974 89 330 16 761
Household-level covariates
SNAP participation 0.45 0.50 0 1 0.52 0.50 0 1
Receipt of nonfood cash assistance 0.05 0.22 0 1 0.05 0.21 0 1
Total monthly grocery expenditure, $ 235 190 0 1821 219 183 0 1620
Shopped area-level covariates
Household income, $10 000 5.6 1.6 2 12.2 5.6 1.6 2 12.2
High-school graduates, % 33.6 7.1 10.2 46 33.6 7.1 10.2 46
College graduates, % 15.9 5.8 4.9 32.7 15.9 5.8 4.9 32.7
Non-English language at home, % 15.9 12 4 50.5 16 12 4 50.5
Unemployed, % 8.1 2.8 1.5 16.5 8.1 2.8 1.5 16.5
SNAP participants, % 11.1 8.4 0.4 33.3 11.2 8.4 0.4 33.3
Households in poverty, % 8.5 6.4 0 26.5 8.6 6.4 0 26.5
Non-Hispanic white, % 83.5 13.3 20.6 97.7 83.5 13.2 20.6 97.7
Non-Hispanic African-American, % 3.8 5.3 0 36 3.7 5.1 0 36
N(observations) 17 740 18 311
N(households) 2137 2137
New age beverages include energy drinks, sports drinks,flavored water, and ready-to-drink tea and coffee. Fruit drinks and other refreshment beverages cannot be purchased with WIC benefits. Store-level sociodemographics represent the census tract–level demographics of the store locations where household members shop.
†Full model results are available from the authors
The effects were similar among WIC households also using SNAP benefits (Table 2). Their postimplementation purchases of 100% juice amounts de-clined in total by 22.2% (19.4%–24.9%). Juice amounts purchased with WIC benefits were, on average, reduced by 43.6% (41.2%–45.9%). There was no change in juice purchased with per-sonal funds, and juice amounts
pur-chased with SNAP benefits increased by 14.3% (6.1%–23.2%). Changes in the total amounts of fruit drinks and other beverages were similar to the results for all WIC households.
Figures 2 and 3 present estimation results from the time–slope models that control for temporal trends in the data. They show the marginal pre-dictions and their confidence intervals
at discrete points in time, averaged across other covariates in the model. The figures depicts a significant re-duction in WIC-provided (Fig 2A) and total juice purchases (Fig 2D) between the 2 periods of analysis. Fruit drinks increased significantly during this time (Fig 3A), but baseline purchase levels were low and the monthly average in-crease was∼10 oz. There was no shift FIGURE 1
of purchases to other beverages such as soft drinks (Fig 3B) or bottled water (Fig 3C). A slight increase was ob-served for new age beverages (Fig 3D), which likely reflects a general market trend rather than a substitution effect. Purchases of energy drinks, sports drinks, and teas have been increasing rapidly over the past years while con-sumers have been shifting away from soft drinks.13
DISCUSSION
The current analysis shows that WIC-participating households purchased about a quarter less juice volume after implementation of the revised WIC food packages. Large reductions in WIC-provided juice were only partly com-pensated for by juice purchases with non–WIC-provided funds. This indicates that WIC participants did not seek to
purchase the amounts of juice pro-vided by WIC before the food pack-age revisions. This conclusion echoes previous data documenting that WIC-participating children were receiving excessive amounts of 100% juice be-fore the WIC revisions (9.5oz/d), al-most twice the American Academy of Pediatrics–recommended daily limit for preschool-age children.7,16To our knowledge, this is thefirst analysis to document changes in juice purchases among WIC participants after the WIC revisions.
Another importantfinding of this study is that the WIC revisions were not ac-companied by unintended negative consequences of the policy change, such as a dramatic increase in pur-chases of cheaper and less nutritious beverage substitutes. An increase in purchases of fruit drinks and new age
beverages was overcompensated by reduced purchases of soft drinks, most of which were sugar-sweetened.9,17 Reductions in soft drink purchases could reflect ongoing market trends (soft drink sales have been declining since 2004, especially in the past several years17) or WIC success in nutrition education of participants. A reduction in juice and sugar consumption among WIC participants was one of the goals for the revisions in the WIC food pack-ages.2 The current study documents WIC success in this domain, at least among WIC-participating households in New England. This is an important public health achievement given the high prevalence of obesity in very young children, particularly from low-income families.18
Although 100% fruit juices are widely marketed as healthy beverages,19their caloric content is similar to one of sodas, and they lackfiber present in whole fruit. Excessive consumption of 100% juice has been associated with increased risk of weight gain20–22and dental caries.22 Mounting evidence supports the role of limiting con-sumption of 100% juice and other energy-dense beverages, in part be-cause liquid carbohydrates from bev-erages are poorly compensated for by reduced caloric intake elsewhere23,24 In addition, a recommended daily limit does not imply that children should consume juice on a daily basis. Accord-ing to the American Academy of Pediat-rics, juice offers no nutritional advantage over whole fruit for children.6 months old.
Exposure to significant amounts of energy-dense sweet beverages is par-ticularly concerning in young children. The sweet taste of beverages makes them more palatable than water, and children like sweet foods. Frequent consumption of sweet beverages, in-cluding 100% juice, could affect child-ren’s taste sensitivity and make them
TABLE 2 Changes in Purchased Beverage Amounts After Implementation of the Revised WIC Food Packages
Pre Post Differences in Purchased Volume
exp(b) 95% CI
All WIC households (N= 2137) 100% Juice
Total purchases 0.765*** 0.746–0.786
Purchases with WIC benefits 0.565*** 0.549–0.581
Purchases with non-WIC funds 1.136*** 1.084–1.190
Other beverages
Fruit drinks 1.209*** 1.149–1.273
Soft drinks 0.879*** 0.850–0.909
Bottled water 0.864*** 0.813–0.918
New age beverages 1.213*** 1.121–1.312
WIC households using SNAP benefits (n= 1584) 100% Juice
Total purchases 0.778*** 0.751–0.806
Purchases with WIC benefits 0.564*** 0.541–0.588
Purchases with SNAP benefits 1.143*** 1.061–1.232
Purchases with personal funds 1.038 0.944–1.142
Other beverages
Fruit drinks 1.208*** 1.129–1.293
Soft drinks 0.891*** 0.850–0.933
Bottled water 0.859*** 0.790–0.934
New age beverages 1.121* 1.018–1.236
more averse to less sweet foods.25Water and low-fat milk could be convenient alternatives to energy-sense sweet bev-erages. More work is necessary to ed-ucate parents about healthy beverage options for their children. Pediatricians, dentists, and WIC nutritionists can play a crucial role in informing parents about healthy beverages for their children. The WIC program has already improved beverage consumption among WIC participants through nutrition educa-tion and the revisions in WIC packages.
Continuing efforts are important to maintain focus on reducing sugar and caloric beverage intake in youth.
This study has a number of strengths. It used unique data on grocery purchases of .2000 WIC-participating house-holds during the pre–post imple-mentation period. The source of payment for groceries was available to examine the use of WIC and SNAP ben-efits along with personal funds. Gen-eralized estimating equation models were used to assess changes in
bev-erage purchases of WIC households. The analysis was also subject to limi-tations. Data were from two New Eng-land states, which may differ in beverage purchase patterns from other regions. For example, per capita pur-chases of 100% juice were consider-ably higher in the northeast than in the southwest or south, while soft drink consumption in the south and west central region was more than double that observed in the Pacific area in 2008.14,17 Given the lower FIGURE 2
baseline juice allowances in Connec-ticut and Massachusetts, the imple-mentation effects could be more significant in states with higher base-line allowances and larger relative reductions in juice after the revisions. In addition, no household sociodemo-graphic characteristics were available in this study, including no data about
how juice and other beverage con-sumption was partitioned between members of WIC households. Finally, these data reflect purchase behaviors at a single grocery chain and do not represent all household bever-age purchases and actual beverbever-age consumption by the household or in-dividual WIC participants.
CONCLUSIONS
These data support the positive impact of the revised WIC food packages on over-all purchases of 100% juice by WIC-participating households. Importantly, decreased juice purchases do not appear to be offset by an increase in the purchase of other caloric, less healthy beverages, such as soda. On a population level, such FIGURE 3
a shift in beverage purchase patterns could significantly affect health out-comes related to excessive consump-tion of caloric beverages in vulnerable populations. Future research should explore the impact of the revised WIC
food packages on dietary intake in WIC participants nationwide.
ACKNOWLEDGMENTS
The authors thank Victoria Zigmont for excellent research assistance and
Rachel Colchamiro and Caroline Cooke for helpful advice on the state-specific implementation of the WIC food package revisions. Special thanks go to the con-fidential grocery store chain for sharing its data.
REFERENCES
1. Oliveira V, FrazÄo E. The WIC Program: Back-ground, Trends, and Economic Issues, 2009 Edition. Washington, DC: US Department of Agriculture, Economic Research Service; 2009. Economic Research Report No. 73
2. Institute of Medicine. WIC Food Packages: Time for a Change. Washington, DC: The National Academies Press; 2005
3. US Department of Agriculture. Special Supplemental Nutrition Program for Women, Infants and Children (WIC): Revi-sions in the WIC Food Packages; Interim Rule. Table 5 Prescription Estimates for Current Food Packages. Federal Register 72(234); December 6, 2007
4. Committee on Nutrition. American Academy of Pediatrics: The use and misuse of fruit juice in pediatrics.Pediatrics. 2001;107(5):1210–1213 5. American Academy of Pediatrics. Caring for Your Baby and Young Child: Birth to Age 5. Shelov SP, ed. Bantam Books; 2009
6. US Department of Agriculture. Special Sup-plemental Nutrition Program for Women, Infants and Children (WIC): Revisions in the WIC Food Packages; Interim Rule. Table 4 Prescription Estimates Under Interim Rule. Federal Register 72(234); December 6, 2007
7. Wang YC, Bleich SN, Gortmaker SL. In-creasing caloric contribution from sugar-sweetened beverages and 100% fruit juices among US children and adolescents, 1988-2004.Pediatrics. 2008;121(6):e1604–e1614 8. Gladson. Nutrition Database. 2011. www.
gladson.com/SERVICES/NutritionDatabase/ tabid/89/Default.aspx
9. Andreyeva T, Luedicke J, Henderson KE, et al. Grocery store beverage choices by participants in federal food assistance and nutrition programs. Am J Prev Med. 2012; 43(4):411–418
10. U.S. Census Bureau. American Community Survey. 5-Year Estimates. 2006-2010. Available at: www.census.gov/acs/www/. Accessed March 15, 1013
11. Nichols A. Regression for nonnegative skewed dependent variables. BOS10 Stata Conference, Boston, MA, July 15–16 2010 12. Hardin JW, Hilbe J.Generalized Estimating
Equations. Boca Raton, FL: Chapman & Hall/ CRC; 2003. xiii
13. Beverage Marketing Corporation. 2012 State of the Industry Report. 2012. www. nxtbook.com/nxtbooks/macfadden/bw0512/ #/24
14. Beverage Marketing Corporation. Fruit Beverages in the U.S. Beverage Marketing Corporation of New York, July, 2009
15. Beverage Digest. 2011 April 21, 2011:3. Available at: www.beverage-digest.com/. Accessed March 15, 1013
16. Gidding SS, Dennison BA, Birch LL, et al. Dietary recommendations for children and adolescents: a guide for practitioners: consensus statement from the American Heart Association. Circulation. 2005;112 (13):2061–2075
17. Beverage Marketing Corporation. Carbon-ated Soft Drinks in the U.S.New York, NY: Beverage Marketing Corporation; 2009: Chap 3
18. Centers for Disease Control and Prevention (CDC). Obesity prevalence among low-income, preschool-aged children –United States, 1998–2008. MMWR Morb Mortal Wkly Rep. 2009;58(28):769–773
19. Institute of Medicine, Committee on Food Marketing and the Diets of Children and Youth. Food Marketing to Children and Youth: Threat or Opportunity?Washington, DC: National Academies Press; 2006
20. Faith MS, Dennison BA, Edmunds LS, et al. Fruit juice intake predicts increased adipos-ity gain in children from low-income families: weight status-by-environment interaction.
Pediatrics. 2006;118(5):2066–2075
21. Dennison BA, Rockwell HL, Baker SL. Excess fruit juice consumption by preschool-aged children is associated with short stature and obesity.Pediatrics. 1997;99(1):15–22 22. Marshall TA, Levy SM, Broffitt B, et al.
Dental caries and beverage consumption in young children.Pediatrics. 2003;112(3 Pt 1): e184–e191
23. DiMeglio DP, Mattes RD. Liquid versus solid carbohydrate: effects on food intake and body weight. International journal of obe-sity and related metabolic disorders.J Int Assoc Study Obes. 2000;24(6):794–800 24. Bellisle F, Rolland-Cachera MF. How
DOI: 10.1542/peds.2012-3471 originally published online April 29, 2013;
2013;131;919
Pediatrics
Tatiana Andreyeva, Joerg Luedicke, Amanda S. Tripp and Kathryn E. Henderson
and Children Program
Effects of Reduced Juice Allowances in Food Packages for the Women, Infants,
Services
Updated Information &
http://pediatrics.aappublications.org/content/131/5/919
including high resolution figures, can be found at:
References
http://pediatrics.aappublications.org/content/131/5/919#BIBL
This article cites 1 articles, 1 of which you can access for free at:
Subspecialty Collections
http://www.aappublications.org/cgi/collection/nutrition_sub
Nutrition
_sub
http://www.aappublications.org/cgi/collection/community_pediatrics
Community Pediatrics following collection(s):
This article, along with others on similar topics, appears in the
Permissions & Licensing
http://www.aappublications.org/site/misc/Permissions.xhtml
in its entirety can be found online at:
Information about reproducing this article in parts (figures, tables) or
Reprints
http://www.aappublications.org/site/misc/reprints.xhtml
DOI: 10.1542/peds.2012-3471 originally published online April 29, 2013;
2013;131;919
Pediatrics
http://pediatrics.aappublications.org/content/131/5/919
located on the World Wide Web at:
The online version of this article, along with updated information and services, is
by the American Academy of Pediatrics. All rights reserved. Print ISSN: 1073-0397.