Translated from Nankai guanli pinglun 南开管理评论 (Nankai Business Review), 2010, (3): 136–149
Hai Li ()
School of Economics and Business Administration, Beijing Normal University, Beijing 100875, China
E-mail: [email protected]
Mian Zhang
School of Economics and Management, Tsinghua University, Beijing 100084, China E-mail: [email protected]
RESEARCH ARTICLE
Hai Li, Mian Zhang
The Development and Validation of an
Organizational Cohesion Inventory
© Higher Education Press and Springer-Verlag 2010
Abstract This study develops a scale, organizational cohesion inventory (OCI), which measures cohesion at the organizational level. The OCI contains six dimensions: employee centripetalism, leader cohesiveness, task cooperation, interpersonal harmony, benefit sharing, and value identification. We conducted three studies to develop and validate the OCI in the Chinese context. In Study 1, we generated and selected scale items, and examined the construct validity of the OCI. Study 2 tested its incremental validity and nomological validity. Study 3 assessed its concurrent validity. In general, results of the three studies show that the OCI has good psychometric properties. It is therefore could be useful for more thorough and comprehensive studies on organizational cohesion.
Keywords organizational cohesion, scale development, validation
1 Introduction
organizations. Only by adapting to external environment can organizations survive, while internal integration is the foundation and prerequisite for external adaptation. Cohesion is an important indicator of internal integration.
However, most of the prior studies have focused on cohesion at the group level. And the measures of cohesion suffer from various limitations too. This paper argues that cohesion should be studied at the organizational level. In doing so, we need first to explore the construct of cohesion, and develop a valid measure. At the same time, we need to consider the effects of national culture and social changes in China on the construct and measure of cohesion.
In the Western organizational management literature, cohesion is traditionally regarded as an important concept at the group level (Carron, Widmeyer and Brawley, 1985; Estabrooks and Carron, 2000). Only few studies explored cohesion at the organizational and community levels (e.g., Bollen and Hoyle, 1990; Siebold, 1999). However, in the context of a collectivistic culture, and during the transformation period of economy and society, studying cohesion at the organizational level is important to the theories and practices of organizational management in China. Therefore, this article attempts to study cohesion in China at the organizational level.
Cultural tradition in China reflects rich collectivism orientations. For instance, some Chinese ancient philosophers emphasized that “ren zhi sheng buneng wuqun (one cannot survive apart from groups)” (quoted from the ancient Chinese book named Xunzi·Fuguo) and “jing ye le qun (dedicated to your job and to enjoy being in a group)” (quoted from Liji·Xueji). Nowadays, collectivism is still considered as one of the important characteristics of Chinese culture and values (Hofstede, 1992; Trompenaars, 1993). Employees in a high collectivistic culture have a more intensive sense of belonging, and are more likely to subordinate personal goals to organizational ones (Earley, 1989; Triandis, 1995). Meanwhile, organizations in a high collectivistic culture also put more emphasis on keeping the long-term relationship with employees, as well as on the enhancement of organizational cohesion (Ungson, Sterrs and Park, 1997).
regarded themselves as “the psychological owner” of enterprises. In Jing and Tong’s (1992) survey with managers from 345 firms in Tianjin, 83.3% of respondents believed that employees’ ownership consciousness was low or poor. Therefore, in this changing social background, it is urgent for enterprises to rebuild their organizational cohesion.
How to define and measure cohesion is a primary issue for conducting cohesion research in Chinese enterprises. Based on a careful review of relevant literature, we concluded that the research gaps in organizational cohesion need to be filled.
First, most existing scales in the west are at the group level, and are limited to some special occupations highlighting group work, such as sports teams, military units, and psychic therapy groups. For example, cohesion scales which are widely used in the literature, like Seashore’s scale, Yalom, Houts, Zimerberg and Rand’s measure, SCQ (cited from Hogg, 1992), GEQ (Carron, Widmeyer and Brawley, 1985) and Langfred’s (1998) scale, are all measures at the group level.
Second, although there are several cohesion scales at the organizational level, these scales lack strong validity evidence. For instance, based on the sample from military units, Siebold (1999) developed the Combat Platoon Cohesion Questionnaire (CPCQ) which includes six dimensions. Although CPCQ can serve as a measure at the organizational level, empirical evidence has failed to support the six-dimension structure. Specifically, the two leader-related factors in the model could not be distinguished. Bollen and Holye (1990)analyzed the cohesion of community residents and developed the Perceived Cohesion Scale (PCS). The PCS includes two dimensions, sense of belonging and feelings of morale. It can be used at different levels. For instance, the item “I feel a sense of belonging to” can be applied at the group, organization, and community level. However, in their studies, the correlation coefficients between belonging and morale based on two samples were both above 0.92, showing the lacking of discriminant validity.
To sum up, existing cohesion scales have the following limitations, focused on the group level; limited to special occupations, lacking of sufficient empirical validity, short of clarity (Evans and Jarvis, 1980) and consistency (Mudrack, 1989), or lacking of solid theoretical foundation (Carron, Widmeyer and Brawley, 1985; Hogg, 1992). Considering that there are few valid cohesion scales at the organizational level in business sectors, it is hence necessary to develop a valid and general measure for cohesion at the organizational level to fill in the gap.
structure of cohesion.
In an individualistic society, organizational cohesion is more likely to stem from work orientation and fair competition. For instance, in Cameron and Quinn’s (1999) Organizational Culture Assessment Instrument, the origins of organizational cohesion include the pursuit of innovation, attention to performance and targets, and ordinary operation of firms regulated by institutional norms. In Mullen and Copper’s (1994)meta-analysis, cohesion was operationalized as a three-dimension construct consisting of interpersonal attraction, commitment to task and group pride. The relationship between cohesion and group performance was examined, and the results showed task commitment was the most significant predictor of group performance. However, in a collectivistic society such as China, we posit that cohesion is mostly from relationship orientation and interpersonal harmony. Farh, Early and Lin (1997) furnished some evidence supporting our argument. In their organizational citizenship behavior (OCB) scale developed in the Chinese context, two emic dimensions were different from the scales in the west, one of which was interpersonal harmony.
Power distance in the Chinese society is higher than in the American society (Hofstede, 1992). Power distance affects the relationship between leaders and employees, which further influences organizational cohesion. In organizations with higher power distance, employees are more likely to accept the authority of leadership, and leaders are more likely to be recognized as representatives, tokens, or even substitutes of the organization. Chen, Tsui and Farh (2002)found that employees in the Chinese context are inclined to being loyal to their supervisors rather than the organizations. Most extant western cohesion scales, except the ones developed in the military, do not involve leadership components. Siebold’s (1999)CPCQ includes two leader-related dimensions, leader caring and leader competence. It may be due to the reason that, although power distance in the American society is relatively lower, America’s military organization is a kind of exception with higher power distance. Therefore, we posit that leadership is probably an important dimension of cohesion in the context of China.
embodies closer relationship between individuals and organizations, more intensive individual dependence upon organizations, and more beyond contractual responsibilities of organizations toward individuals. For example, Chinese often emphasize that employees and enterprises are “ming yun gong tong ti (a community of destiny),” and should “tong hu xi, gong ming yun (share the common fate)”; the Chinese also advocate that “qi ye shi wo jia, xing wang kao da jia (the firm is our home, so its prosperity depends on everyone),” and employees should have “zhu ren weng jing shen (ownership consciousness).” For another instance, Chinese enterprises are often involved in employees’ family issues, including wedding and funeral, and providing assistance to employees. All of these issues are the responsibilities beyond the simple employment contract.
Li and Zhang (2008), Li, zhang and Li (2009)advanced a conceptual model of organizational cohesion, consisting of six dimensions: employee centripetalism, leader cohesiveness, task cooperation, interpersonal harmony, benefit sharing, and value identification. These six dimensions reflect the construct of organizational cohesion at the individual, group, and organizational level, respectively. The purpose of this study is to develop and validate an Organizational Cohesion Inventory (OCI) in the Chinese context based on the proposed six-dimension conceptual framework. This paper includes three studies. In Study 1, based on a sample of 818 participants, we developed the OCI and tested its reliability (alpha coefficients) and construct validity. Study 2 tested the incremental validity and nomological validity of the OCI based on a sample of 364 participants. Study 3 examined the concurrent validity of the OCI based on a sample of 111 participants.
2 Theoretical Background
The development of cohesion measurement can be divided into three stages: uni-dimension, multi-dimension, and multi-level multi-dimension. The early studies regarded cohesion as a uni-dimension construct and mostly centered on measuring “attraction” (Evans and Jarvis, 1986). At the multi-dimension stage, a three-dimension construct, including interpersonal attraction, commitment to task and group pride, was widely accepted (Mullen and Copper, 1994; Beal, Cohen, Burke, and McLendon, 2003). At the multi-level multi-dimension stage, the representative instruments are the group environment questionnaire (GEQ) developed by Carron, Widmeyer and Brawley (1985) and the CPCQ developed by Siebold (1999).
the individual, group and organizational levels. Farh, Zhong and Organ (2004) developed an OCB measure at the individual, group, organizational, and society levels. The trend indicates that studies on organizational behavior have become increasingly comprehensive, thorough, and complicated. Researchers have started to pay more attention to analyzing phenomenon systematically and aim to reflect the real world by exploring the relations among multi-level and multi-variables. The present study has advanced a conceptual model of organizational cohesion at the individual, group, and organizational levels, each of which includes two dimensions. Thus, it is a multi-level multi-dimension model. The following parts of this section focus on discussing about the multi-level multi-dimension models, especially the OCI model developed in this paper.
Carron, Widmeyer and Brawley (1985) defined cohesion as “a dynamic process which is reflected in the tendency for a group to stick together and remain united in the pursuit of its goals and objectives.” They argued that cohesion has two levels: individual attraction to group and group integration, and each level has two aspects: task and social. Therefore, their conceptual model of cohesion contains four dimensions. However, when Carless and De Paola (2000) empirically tested the GEQ’s construct validity by adopting the Structural Equation modeling (SEM), they found a three-dimension model fitted the data better than the hypothesized four-dimension model. Specifically, it was difficult to discriminate the task and social aspects at the individual level. Besides, GEQ is a group-level measure and limited to sports teams.
Siebold (1999) stated “the level of unit cohesiveness is defined as the degree to which mechanisms of social control operant in a unit maintain a structured pattern of social relationships between unit members, individually and collectively, necessary to achieve the unit’s purpose.” Meanwhile, he posited cohesiveness contains three levels, individual, group and organizational. Each level has two aspects, affective and instrumental. Thus, his conceptual model includes six dimensions. However, a subsequent empirical study found that all indicators of two leader dimensions loaded on one factor. In other words, there is no significant difference between the affective and instrumental aspects at the individual level. Besides, although CPCQ is an organizational level instrument, it is limited at military organizations. It remains unclear whether this instrument can be generalized to business units and public departments.
a typical case reflecting Chinese firms’ developmental history. Company A has experienced different kinds of ownership changes, including foreign owned, state owned, foreign holding and joint venture companies. Additionally, it has a diverse employee group. From the nationality perspective, there are Chinese and foreign employees in company A. From the perspective of educational background, it has blue collar workers who are less educated, such as migrant rural workers, as well as senior administrative and technical employees who graduated from prestigious domestic and overseas universities. From the perspective of tenure, it has old employees who experienced the planned economic system and new employees who are trained in the marketing economy. Therefore, company A can be used as a typical Chinese firm with a representative labor force.
Data were collected via semi-structured in-depth interviews by two interviewing groups. We used theoretical and snowball sampling method to generate 49 participants from company A. With the approval of interviewees, we recorded 36 interviews with voice recorders. Then a research assistant transcribed and sorted out the records. A coding group composed of three researchers conducted content analyses following a three-step procedure based on Strauss and Corbin’s (1990), including excerpting, coding, and categorizing. Excerpting is to extract excerpts from the primary texts the parts (paragraphs or sentences) that are highly related with the research topics, with the purpose of exploring the topic. Coding is to transform layman languages to academic concepts, for identifying concepts. Categorizing is to integrate the emerged concepts with similar meanings discovered in the coding process, with the purpose of discovering categories. The step of categorizing might be repeated several times. In the case study, the agreement rates among the coding group members during the excerpting, coding, and categorizing stages were 78.42%, 67.48% and 71.43%, respectively. Compared with the data agreement consistency reported by most studies, such agreement rates are not very high. However, considering there has been no extant codebook for reference in advance, we thought the results were acceptable. Then, the coding group discussed the inconsistent contents and finally reached agreements. The final result of content analyses generates a five-dimension construct model of organizational cohesion encompassing employee centripetalism, leader cohesiveness, task cooperation, interpersonal harmony, shared goals and value.
important” and 5 stands for “very important”); the scores ranged from 4.12 to 4.45. The open-ended item was “in additional to the five dimensions above, what else important dimensions do you think organizational cohesion should contain.” We collected 40 valid questionnaires containing answers to the open-ended item. Two graduate students of a business school who had not participated in the former research conducted the coding process. Researchers explained the theoretical framework and the definitions of five cohesion dimensions to the two coders. The coders were asked to conduct pilot coding with 5 copies of questionnaires. They then discussed the pilot coding results and generated some coding rules to follow. After that, the coders conducted formal coding and did not find any new dimension of organizational cohesion.
The questionnaire survey containing the same closed and open-ended items was conducted twice among eight professional experts. Except for a doctoral advisor and an associate professor (a Ph.D. candidate), all others held a doctoral degree. In the first round survey, researchers delivered questionnaire to each expert face to face, collected the answer, and then had a discussion with each expert. In the second round survey, researchers informed each expert the summarized results of the first round survey and asked his/her comments. In doing so, our surveys took the merits of both Delphi and focus group methods. During the first round survey, two experts suggested a new dimension of cohesion: benefit sharing. In the second round survey, researchers added this dimension into the questionnaire. All experts accepted this new dimension.
To make sure that there is enough evidence of the new dimension, we checked the interview texts and coding records again and found that the beneath the dimension of shared targets and value, the subcategory of benefit sharing did exist. However, it was omitted because of the limited frequencies (n = 4). We found that measuring concepts from both benefits and value aspects is fairly common in organizational behavior research. For instance, in Meyer and Allen’s (1991) three-dimension model of organizational commitment, continuance commitment is based on the calculation of benefits, while normative commitment is based on the identification of values. For another instance, Siebold’s (1999) CPCQ model also distinguishes the affective and instrumental (benefit) aspects. Accordingly, we added benefit sharing as the sixth dimension to the originally five dimension model of organizational cohesion.
together and remain united in the pursuit of its goals and objectives.” This definition is similar to Carron, Widmeyer and Brawley’s (1985). However, we explicitly define cohesion at the organizational level.
The three levels of organizational cohesion represent three kinds of “social control mechanisms” (Siebold, 1999), respectively. Employee centripetalism and leader cohesiveness at the individual level indicate individuals’ social identity (Tajfel, 1982). Specifically, the former represents the identity with organization and the latter with leaders. The organization is a system, and leaders are the representatives of this system (Masterson, Lewis, Goldman, and Taylor, 2000). Task cooperation and interpersonal harmony at the group level reflect the reciprocal principle of social exchange in groups (Blau, 1964; Gouldner, 1960; Homans, 1958). Benefit sharing and value identification at the organizational level reveal the principles of social integration in organizations (Durkheim, 1930/1996; Li and Wen, 2007). Specifically, the former is economic, interest and instrumental oriented, while the latter is value, affective and visionary oriented. All of the three kinds of social control mechanisms aim to unit an organization and attain organizational goals and objectives more efficiently.
In this study, we define cohesion as a construct at the organizational level, but it could be measured by the individual perception. Individuals could assess their perceptions of task cooperation and interpersonal harmony in their own groups (departments). When we aggregate the perceptions of all participants, we could know about the cohesion scores of the organization on these two dimensions. The cohesion scores of the two organizational level dimensions could also be obtained by gathering the respondents’ perceptions.
Tsui and Farh, 2002). However, except for the CPCQ, few Western cohesion measures include leader dimension. Third, at the organizational level, the OCI and the CPCQ include seemingly similar dimensions. However, as we argued, the CPCQ is more suitable to military organizations in which leaders have absolute authority to subordinates and the power distance is fairly high. In the Western organizations, this may be a special case. However, in Chinese organizations including business, non-profit, and public organizations, it may be a general situation. Lastly, at the group level, no distinct differences exist among the three models. All of them contain the task and interpersonal/social coordination inside the group.
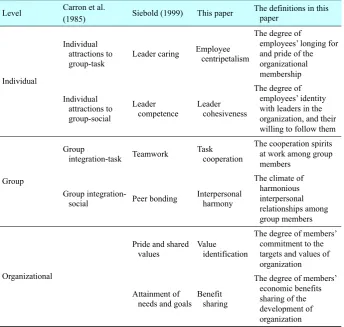
Table 1 Comparison of Different Definitions for Organizational Cohesion
Level Carron et al.
(1985) Siebold (1999) This paper
The definitions in this paper
Individual attractions to group-task
Leader caring Employee centripetalism
The degree of
employees’ longing for and pride of the organizational membership Individual
Individual attractions to group-social
Leader competence
Leader cohesiveness
The degree of employees’ identity with leaders in the organization, and their willing to follow them
Group
integration-task Teamwork
Task cooperation
The cooperation spirits at work among group members
Group
Group
integration-social Peer bonding
Interpersonal harmony
The climate of harmonious interpersonal relationships among group members
Pride and shared values
Value identification
The degree of members’ commitment to the targets and values of organization Organizational
Attainment of
needs and goals Benefit sharing
The degree of members’ economic benefits sharing of the development of organization
degree of harmony among members of groups in the organization, both inside and outside of work. At the organizational level, it indicates the degree of consistency and sharing benefits and values among all members in the organization.
Based on the theoretical model stated above, we conducted three studies to develop and validate the OCI. The purpose of Study 1 was to generate and select scale items, and test its reliability as well as construct validity. The purpose of Study 2 was to test the incremental and nomological validity of the OCI. The purpose of Study 3 was to test the concurrent validity of the OCI. We report the three studies in the following sections as follows, respectively.
3 Study 1
3.1 Methods
3.1.1 Items Generation
We collected 119 items from the existing literature, and added another 48 items by referring to interviewees’ words about cohesion in the case study. Thus a total of 167 items were generated in our items pool. Then we deleted some overlapping or severely context-dependent items (e.g., the items are only suitable for sports teams), and modified the words of items to fit the context of Chinese organizations. Accordingly, 50 items were retained to form the expert version of the OCI.
To test the face validity of the expert version, we handed out questionnaires to seven experts of organizational cohesion. They were asked to classify the randomly assigned items into the six dimensions according to the definitions we provided. The experts were informed that they need to classify items into more than one dimension or into none. Five of the seven experts’ research fields were organizational culture and human resource management; one leadership and organization; and one leadership and trust. Except two veteran doctoral advisors and one associate professor (a Ph.D. candidate), all others had a doctoral degree.
Result showed that the classification of 29 items was exactly in consistent with our expectation; the agreement rate among experts was 7/7. The agreement rates for the 15 items, 2 items, 3 items, and 1 item were 6/7, 5/7, 4/7 and 3/7, respectively. We deleted the 1 item with agreement rate lower than 50%. Thus, the initial version of OCI included 49 items.
3.1.2 Data
Beijing and 4 management training classes. 1 093 questionnaires were sent out and 818 valid ones were collected, representing a 74.84% valid response rate. All participants were informed that the survey was totally voluntary and their information will be kept confidential. Respondents distributed widely across 13 provinces in China. 65.2% of the respondents worked in SOEs, 33.9% in private companies, and 0.9% in foreign-invested companies. The respondents’ positions in the organization included senior executives (5.6%), middle managers (26.6%), and non-management employees (67.8%). Their educational attainment contained below or high school (37.4%), junior college degree (26.5%) and undergraduate or above degree (36.1%). In addition, 44.4% of the respondents were male. The average age of respondents was 36.3 years (SD = 8.2). The average company tenure was 6.6 years (SD = 7.4). The average history of organizations in which respondents worked at was 31.3 years (SD = 18.1).
3.1.3 Data Analysis
The data analysis was performed with SPSS 10.0 and LISREL 8.50. Two main steps were used to assess the construct validity of OCI. In the first step, we conducted the Confirmatory Factor Analysis (CFA) to select the items, to form a refined version of the OCI, and to test its construct validity. In the second step, we used the Average Variance Extracted (AVE) and other methods to further examine the construct validity of the OCI. Since the sample is relatively large (N = 818), we randomly divided it into two independent samples. One was designated as the exploratory sample (N = 408), and the other as the confirmatory sample (N = 410). In both steps, the two samples were independently analyzed to check cross validation.
3.1.4 Selecting Items and Examining Construct Validity
Based on the theoretical model, we posited organizational cohesion was a six-factor construct with 49 items. The first step of data analysis was to select the most suitable items and test whether the six-factor construct was reasonable.
First, we used the model generation (MG) method (Jöreskog, 1993) to select the most suitable items in the exploratory sample. The MG method could help researchers shorten the instrument without changing the theoretical structure (Yang, Watkins and Marsick, 2004). The specific approach of MG is to delete one item each time until the researchers find an acceptable balance between content validity and goodness of fitting, robustness and parsimony.
theory-driven factor analysis method (Qiu, 2003). Because we have a hypothesized conceptual model of organizational cohesion already, the CFA is more suitable for our current study.
Third, alternative models were used to compare and assess the construct validity (Bollen, 1989; Hou, Wen, and Cheng, 2004). We formulated and tested nine alternative models. The first model was a null model with no common factor. The second one was a single-factor model with all observed variables loading on one underlying factor. The third one was a three-factor model hypothesizing that the individual, group, and organizational levels have only one common factor, respectively. The fourth, fifth, and sixth models were four-factor models assuming that any two of the individual, group and organizational levels have one common factor and the remaining level has two latent factors. The seventh, eighth, and ninth models were five-factor models hypothesizing that one of the individual, group and organizational levels has only one common factor, while each of the two remaining levels have two latent factors.
3.1.5 Testing Construct Validity
Convergent validity and discriminant validity are two important facets of construct validity. Traditionally, the multi-trait multi-method matrix (MTMM) was employed to assess the two kinds of validities. However, the CFA has recently become a popular method, among other newly-emerged testing methods.
First, following Fornell and Larcker (1981), we used the AVE method and compared AVE and φ2 to test the convergent and discriminant validity. AVE stands for the common variance shared by factors and their corresponding items. The AVE greater than 0.50 means the factors rather than the random errors explain the more variance of items, representing good convergent validity. φ2 is the square of standardized correlation coefficient between two factors and stands for the common variance shared by the two factors. When the AVE is greater than φ2, it means that the common variance shared by a factor and its items is greater than the one shared by two factors, showing the evidence of discriminant validity.
Second, we employed three other methods: models comparison, confidence interval, and Fisher’s Z-transformation to further test discriminant validity of the OCI.
includes 1. If the coefficient does not include 1, it indicates acceptable discriminant validity. Furthermore, we calculated the path coefficients between any two factors by Fisher’s Z-transformation (Johnson, Kotz and Balakrishnan, 1995). If the Z value is significantly different from 1, the discriminant validity is acceptable.
Finally, we performed the second-order CFA to further assess the convergent validity of OCI. Spreitzer (1995) also employed the same method to test the convergent validity of a psychological empowerment scale. We proposed a second-order factor model in which organizational cohesion was defined as the second-order factor and the six dimensions as the first-order factors. If the fit indices are acceptable and the first-order factors have relatively high loadings on the second-order factor, we can conclude that the six dimensions load on a common latent variable and the OCI has acceptable convergent validity.
3.2 Results
3.2.1 Items and Factor Structure
In the exploratory sample, using the MG method, we ultimately selected 18 items in the final version of the OCI. Each dimension has three items. Table 2 lists the standardized loadings and measurement errors of each item. Only one item’s loading was 0.66 in the exploratory sample and another one’s loading was 0.66 in the confirmatory sample. Most items’ loadings ranged from 0.71 to 0.96. Meanwhile, except one item, all the measurement errors were below 0.50. The high loadings and low measurement errors show that the variances of observed variables could be explained well by the hypothesized latent variables. This provides preliminary evidence that OCI have good psychometric properties.
Ta bl e 2 S tandardized Loadings (L) a
nd Errors (E) of the OC
I
Items
Employee centripetalism
L
eader cohesiveness
Ta
sk
cooperation
Interpersonal harmony
Benefit sharing Va lu e commitment S1 S2 S1 S2 S1 S2 S1
S2 S1 S2 S1
S2 Item L E LE L ELE L E L ELELE L EL ELE L 1 0.79 0.38 0.81 0.35 0.77 0.41 0.90 0.18
0.79 0.37 0.89
0.21 0.79 0.37 0.66 0.57 0.82 0.32 0.86 0.26 0.82 0.33 0.72 0.48 2 0.75 0.43 0.71 0.50 0.79 0.37 0.94 0.12
0.80 0.36 0.85
0.28 0.80 0.36 0.85 0.27 0.88 0.22 0.87 0.25 0.80 0.36 0.89 0.21 3 0.91 0.17 0.92 0.15 0.85 0.27 0.71 0.50
0.93 0.13 0.87
0.24 0.89 0.20 0.84 0.30 0.96 0.07 0.88 0.23 0.66 0.56 0.76 0.42
Note: 1. Item 1, 2, and 3 represent the first, s
econd, and third item of each dimension, respectively
.
2.
Ta
bl
e 3
Results of the CF
A
for the OCI’
s Construct
V
alidity
Fit index
N
ull model 1-factor model 3-factor model 4-factor model 1 4-factor model 2 4-factor model 3 5-factor model 1 5-factor model 2 5-factor model 3
6-factor
The exploratory sample (
N = 408) χ 2 10 317.48 2 452.28 1 526.38 1 312.46 1 202.83 981.99 770.09 984.92 654.01 df 153 135 132 129 129 129 125 125 125 χ 2 /df 67.43 18.17 1 1.56 10.17 9.32 7.61 6.16 7.88 5.23 RMSEA 0.404 0.205 0.162 0.150 0. 143 0.127 0.1 13 0.130 0.102 CFI 0 0.56 0.74 0.77 0.79 0.84 0.87 0.83 0.89 TLI 0 0.50 0.70 0.73 0.75 0.81 0.85 0.79 0.87 SRMR 0.39 0.13 0.1 1 0.094 0.098 0.073 0.055 0.085 0.061
The confirmatory sample (
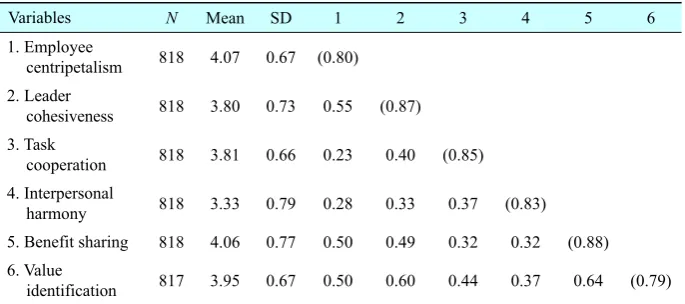
Table 4 presents the summary statistics of the OCI’s six factors. Standard deviation of every factor was around 0.70, indicating that subscales measured enough variance among individuals from various organizations. The Cronbach’s alpha coefficients ranged from 0.79 to 0.88, indicating good reliabilities of each subscale. All of the correlation coefficients were moderately related, ranging from 0.23 to 0.64. The results above indicated that the six factors measured the same latent variable and could be distinguished from each other.
Table 4 Summary Statistics of Dimensions of the OCI
Variables N Mean SD 1 2 3 4 5 6
1. Employee
centripetalism 818 4.07 0.67 (0.80)
2. Leader
cohesiveness 818 3.80 0.73 0.55 (0.87)
3. Task
cooperation 818 3.81 0.66 0.23 0.40 (0.85) 4. Interpersonal
harmony 818 3.33 0.79 0.28 0.33 0.37 (0.83)
5. Benefit sharing 818 4.06 0.77 0.50 0.49 0.32 0.32 (0.88) 6. Value
identification 817 3.95 0.67 0.50 0.60 0.44 0.37 0.64 (0.79) Note: 1. All of the correlation coefficients are significant at the level of p < 0.001 (two-tailed test).
2. Each dimension was measured by Likert five-point scale. 3. Alpha coefficients are presented in the diagonal parentheses.
3.2.2 Construct Validity
The results of the CFA in Table 3 indicate that the construct validity of the OCI was acceptable. Meanwhile, the moderate level of correlation coefficients among factors in Table 4 provides preliminary support to the convergent validity and discriminant validity.
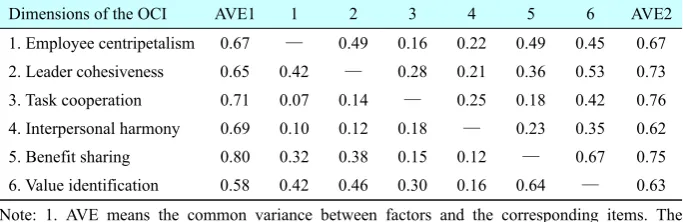
show that OCI had overall good discriminant validity whereas the discrimination between benefit sharing and value identification dimensions still need further test.
Table 5 Results of Testing the Discriminant Validity of OCI (Common Variance Method)
Dimensions of the OCI AVE1 1 2 3 4 5 6 AVE2
1. Employee centripetalism 0.67 — 0.49 0.16 0.22 0.49 0.45 0.67 2. Leader cohesiveness 0.65 0.42 — 0.28 0.21 0.36 0.53 0.73 3. Task cooperation 0.71 0.07 0.14 — 0.25 0.18 0.42 0.76 4. Interpersonal harmony 0.69 0.10 0.12 0.18 — 0.23 0.35 0.62 5. Benefit sharing 0.80 0.32 0.38 0.15 0.12 — 0.67 0.75 6. Value identification 0.58 0.42 0.46 0.30 0.16 0.64 — 0.63 Note: 1. AVE means the common variance between factors and the corresponding items. The
calculation formula is: ( ) 2 2
1 1 1
( )
p p p
vc yi yi i
i i i
Var
η
ρ λ λ ε
= = =
⎛ ⎞
= ⎜⎜ + ⎟⎟
⎝ ⎠
∑
∑
∑
.2. Others numbers except the AVEs are common variance among factors, i.e., the square of correlation coefficients (φ2).
3. The lower triangle part reports the results from the exploratory sample; the upper shows those from the confirmatory sample.
3.2.3 Discriminant Validity
We further tested the discriminant validity between benefit sharing and value identification dimensions by three methods including models comparison, confidence interval, and Fisher’s Z-transformation. First, we employed the six-dimension model as the theoretical model. In the competing model, the path coefficient between benefit sharing and value identification was constrained to 1. The result of models comparison showed that χ2 changed significantly when the
path coefficient between benefit sharing and value identification was constrained to 1 (for the exploratory sample, ∆χ2(1) = 113.94, p < 0.001; for the confirmatory
sample, ∆χ2
(1) = 100.92, p < 0.001). The results indicated the path coefficient
3.2.4 Convergent Validity
The second-order CFA was employed to further assess the convergent validity of OCI. The results suggested that the fit indices were acceptable for both samples (for the exploratory sample: χ2 = 473.93, df = 129, RMSEA = 0.081, CFI = 0.92, TLI = 0.90; for the confirmatory sample: χ2 = 465.89, df = 129, RMSEA = 0.080, CFI = 0.93, TLI = 0.92). Among the loadings of first-order factors on second-order factor, only interpersonal harmony (0.45) and task cooperation (0.52) were slightly low (yet significant, p < 0.001) for the exploratory sample. The loadings of other first-order factors ranged from 0.62 to 0.95. The results corroborated the convergent validity of the OCI.
4 Study 2
The purpose of Study 2 was to test the incremental validity and nomological validity of OCI. For this purpose, we selected organizational justice, organizational commitment, and organizational citizenship behavior (OCB) as criterion variables. Many studies have shown that the perception of organizational justice has significant effects on both employees’ organizational commitment and OCB (e.g., Colquitt, 2001; Podsakoff, Mackenzie, Paine, and Bachrach, 2000). Organizational commitment has been found to be positively associated with OCB (e.g., Podsakoff et al., 2000). We thus anticipated that, besides the effect of organizational justice, organizational cohesion is supposed to have incremental and unique predictive effects on organizational commitment; besides the effects of organizational justice and organizational commitment, it would show additional and unique predictive effects on OCB. At the same time, we expected a logical network of relationships among organizational justice, organizational cohesion, organizational commitment, and OCB.
4.1 Methods
4.1.1 Data
pairs of questionnaires were administered on site. After collecting the questionnaires, we matched the valid organizational cohesion questionnaire (N = 499) with valid criterion questionnaires (N = 588). Finally, we obtained 364 valid matching questionnaires. Among the respondents, 47.8% worked in SOEs, 52.2% in private firms. The positions included senior managers (1.9%), middle managers (19.2%), and non-management employees (78.9%). Their educational attainment included high school or below (51.1%), junior college degree (29.7%), and bachelor degree or above (19.2%). 33.1% of the respondents were male. The average age was 36.1 years (SD = 8.0). The average company tenure was 4.8 years (SD = 5.3). The average history of organizations in which respondents worked at was 28.6 years (SD = 17.5).
4.1.2 Measures
We used the three-dimension measurement of organizational justice. Six items adapted from Giles, Findley and Field (1997) were used to assess distribution justice and procedure justice. Three items adapted from Folger and Konovsky (1989) were used to evaluate interactive justice. The alpha coefficients of the three scales were 0.88, 0.71, and 0.83, respectively. We measured organizational cohesion with the OCI developed in Study 1. The reliability coefficients for the six dimensions were 0.79, 0.82, 0.84, 0.82, 0.84 and 0.72, respectively. We used nine items adapted from Chen and Francesco (2003) to measure organizational commitment, including affective, continuance, and normative commitment. The alpha coefficients of the three components of commitment were 0.78, 0.76, and 0.82, respectively. Ten items adapted from Wu and Wu’s (2005) were used to measure three dimensions of the OCB: dedication to job, interpersonal promotion and organizational obligation. All alpha coefficients were 0.81.
The CFA results of each variable indicated that all scales achieved relatively good psychometric properties. The fit indices of organizational justice (χ2 = 68.02, df = 24, RMSEA = 0.071, CFI = 0.97, TLI = 0.96), organizational cohesion (χ2 = 445.59, df = 120, RMSEA = 0.086, CFI = 0.92, TLI = 0.89), organizational commitment (χ2 = 80.48, df = 24, RMSEA = 0.081, CFI = 0.96, TLI = 0.94), and OCB (χ2 = 139.15, df = 32, RMSEA = 0.096, CFI = 0.95, TLI = 0.93) demonstrated a good or marginally acceptable degree.
The CFA results of the model, including predictive and criterion variables (χ2 = 257.51, df = 84, RMSEA = 0.075, CFI = 0.93, TLI = 0.91), indicate that the variables were distinct constructs.
4.1.3 Data Analysis
hierarchical regression analysis to assess the incremental validity of OCI, and used the SEM to test the nomological validity of OCI.
4.1.3.1 Testing the Incremental Validity
Incremental validity refers to the extent to which a predictor can improve the predictive power after controlling for other predictors (Sechrest, 1963). If the additional explained variance of criterion is statistically significant, the incremental validity of the predictor is supported.
As a rule, researchers are mostly interested in criteria that they aim to predict (Cronbach and Meehl, 1955). The purposes of OCI are to predict: 1) individual level outcomes, such as employees’ attitudes and behaviors. We expect that in organizations with different degrees of cohesion, employees would have different attitudes and behaviors; 2) organizational level results, such as performance and organization health. We anticipate that organization cohesion is associated with performance and health condition of organization. In Study 2, we chose organizational commitment and OCB as criterion variables for three reasons. First, they are important variables measuring organizational members’ attitude and behavior. Second, in recent 30 years, these two variables have been widely used in organizational behavior researches. Third, there are psychometrically sound scales of the two criteria.
To test the incremental validity of OCI, we formulated two regression equations. In Equation 1, OCB was dependent variable whereas organizational justice, organizational commitment, and organizational cohesion were independent variables. Additionally, we included gender, educational degree, age, positive affect, and negative affect as the control variables. Gender and educational degree (i.e., below or high school, junior college degree or above) were constructed as dichotomous variables. In Equation 2, organizational commitment was the dependent variable. Organizational justice and organizational cohesion were independent variables. We included the same control variables as those in Equation 1. We used hierarchical regression analyses to examine the additional effects of organizational cohesion on dependent variables beyond other control variables.
4.1.3.2 Testing the Nomological Validity
To test the nomological validity of the OCI, we constructed a nomological net, including organizational justice, organizational cohesion, organizational commitment, and OCB. At the individual level, organizational cohesion indicates employees’ identity with the organization and leaders; at the group level, it represents the harmonious interpersonal relationship and good task cooperation among group members; at the organizational level, it reflects that all employees share economic benefits associated with organization’s development and identify with organizational values. Therefore, we anticipated that the perception of organizational cohesion is positively related to employees’ attitudes (e.g., organizational commitment) and behaviors (e.g., OCB). Some researchers found that cohesion is significant related to OCB (Podsakoff et al., 2000). Although there have been few studies focused on the relationship between cohesion and organizational commitment, we speculated that employees in a highly cohesive organization are more likely to have strong affective bonds with the organization. In addition, the perception of organizational justice in such aspects as performance appraisal, distribution, and interaction between leaders and subordinates probably affects employees’ trust as well as identification with the organization and leaders, which in turns may influence employee’s attitudes and behaviors. Therefore, we proposed that organizational justice has positive impacts on organizational cohesion, organizational commitment, and OCB. Previous studies also found that perception of organizational justice is significantly related to the three variables (e.g., Colquitt, 2001; Podsakoff et al., 2000), and organizational commitment is positively related to OCB (e.g., Podsakoff et al., 2000).
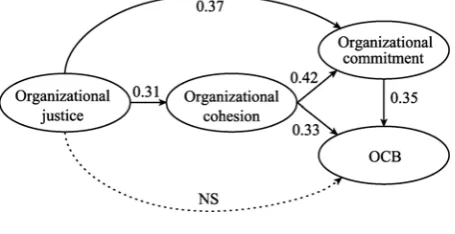
Based on the above rationale, we formulated a structural equation model (see Fig. 1), in which we supposed that organizational justice leads to organizational cohesion, and organizational cohesion to organizational commitment and OCB. Meanwhile, we expected that organizational justice has direct relationships with
Fig. 1 The Nomological Net Model of the OCI
organizational commitment and OCB, and organizational commitment direct relationship with OCB. If this model fit our data well and the path coefficients are significant, we could conclude that the nomological validity of the OCI is supported.
We performed a series of CFA first to test the psychometric properties of the four variables’ measures; then, we used the models comparison method to test the nomological validity.
4.2 Results
4.2.1 Incremental Validity
Table 6 presents the descriptive statistics and correlations of Study 2. The Cronbach’s alpha coefficients of the six measures ranged from 0.79 to 0.89, indicating good internal reliabilities. The correlation coefficients between outcome (organizational commitment and OCB) and predictive variables (organizational justice and organizational cohesion) were significant at the p < 0.001 level.
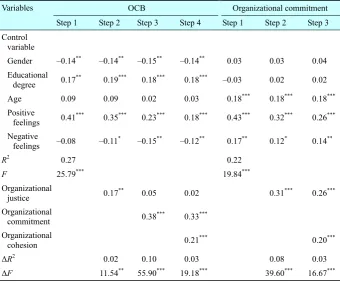
The results of hierarchical regression analyses are shown in Table 7. After controlling demographic variables, positive and negative affectivity, organizational justice and organizational commitment, the incremental effect of organizational cohesion on OCB was 3% (p < 0.001). After controlling demographic variables, positive and negative affectivity and organizational justice, the incremental effect of organizational cohesion on organizational commitment was 3% (p < 0.001). We checked the multi-collinearity of the two regression equations. The maximum values of VIF (Variance Inflation Factor) in the two equations were, 1.50 and 1.27, respectively, indicating that multi-collinearity was not a serious issue in our study. The results of hierarchical regression analyses showed that OCI had good incremental validity.
4.2.2 Nomological Validity
Ta
bl
e 6
Means, S
tandard Deviations
, and Correlations
(S tu dy 2 ) V ariables N Mean SD
1 2 3
4 5 6 7 8 1. Gender 362 1.67 0.47 — 2. Edecational degree 354 0.49 0.50 –0.37 — 3. Age 360 36.14 8.04 0.08 –0.23 — 4. Positive af fect 364 3. 69 0. 68 –0. 16 0. 07 –0. 05 (0. 82)
5. Negative af
fect 364 2.79 0.86 0.20 –0.17 0.16 –0.13 (0.82) 6. Or ganizational justice 364 3.56 0. 61 –0.04 –0.18 0.03 0.30 0.15 (0.79) 7. Or ganizational commitment 364 3. 73 0. 56 0. 01 –0. 08 0. 18 0. 38 0. 16 0. 43 (0. 83) 8. Or ganizational cohesion 364 3.98 0.44 –0.13 0.04 –0.05 0.39 –0. 15 0.28 0.34 (0.89) 9. OCB 364 3.95 0.49 –0.28 0.24 –0.01 0.42 –0.16 0.24 0.46 0.42 N ote: 1. G
ender: 1 = male,
2 = female.
2. Educational degree: 0 = high school or be
low
, 1 = junior college degree or above.
3.
V
ariables 4–9 were measured
by Likert five-point scale.
4. | r | ≥ 0.13, p
< 0.05; |
r
|
≥
0.15,
p
< 0.01; |
r
|
≥
0.20,
p
< 0.001 (two-tailed test).
5.
Alpha coef
Table 7 Results of Hierarchical Regression Analyses (Incremental Validity)
OCB Organizational commitment
Variables
Step 1 Step 2 Step 3 Step 4 Step 1 Step 2 Step 3 Control
variable
Gender –0.14** –0.14** –0.15** –0.14** 0.03 0.03 0.04
Educational degree 0.17
** 0.19*** 0.18*** 0.18*** –0.03 0.02 0.02
Age 0.09 0.09 0.02 0.03 0.18*** 0.18*** 0.18***
Positive
feelings 0.41*** 0.35*** 0.23*** 0.18*** 0.43*** 0.32*** 0.26*** Negative
feelings –0.08 –0.11
* –0.15** –0.12** 0.17** 0.12* 0.14**
R2 0.27 0.22
F 25.79*** 19.84***
Organizational
justice 0.17
** 0.05 0.02 0.31*** 0.26***
Organizational
commitment 0.38*** 0.33*** Organizational
cohesion 0.21*** 0.20***
ΔR2 0.02 0.10 0.03 0.08 0.03
ΔF 11.54** 55.90*** 19.18*** 39.60*** 16.67***
Note: * indicates significant at 0.05 level; ** indicates significant at 0.01 level; *** indicates significant at 0.001 level.
The final results supported the nomological validity of the OCI. Besides, comparing the standardized coefficients in the model, we found that as for the two variables affecting organizational commitment, the effect of organizational justice was 0.47 and the effect of organizational cohesion was 0.42. As for the three variables affected OCB, the effect of organizational cohesion (0.47) was greater than that of organizational justice (0.28) and that of organizational commitment (0.35). Thus, we concluded that the effects of organizational cohesion on related variables were significant and substantial.
5 Study 3
The purpose of Study 3 was to test concurrent validity of the OCI by examining the correlations between the OCI and other existing cohesion scales. We chose the widely used scales in cohesion research field, including the GEQ (Carron, Widmeyer and Brawley, 1985), the PCS (Bollen and Hoyle, 1990), and Langfred’s cohesion scale (1998). Because we were unable to obtain Siebold’s cohesion scale CPCQ, we did not include it in Study 3.
The GEQ contains four subscales. We chose the group integration-social subscale and hypothesized that the group integration-social was positively related to the interpersonal harmony of the OCI. The PCS includes two subscales: sense of belonging and group morale. We chose the subscale of sense of belonging and proposed it was significantly associated with the employee centripetalism of the OCI. Langfred (1998) developed a single dimension scale of cohesion and the items focused on the group members’ cooperation and helping behaviors in their work. Thus we anticipated that it has significant correlation with the task cooperation of the OCI.
5.1 Methods
5.1.1 Data
education included high school or below (32.7%), junior college degree (30.9%), and bachelor degree or above (36.4%). 48.2% of the respondents were male. The average age was 34.8 years (SD = 8.2). Their average company tenure was 5.5 years (SD = 5.5). The average history of organizations in which respondents worked at was 22.4 years (SD = 19.5).
5.1.2 Measures
The GEQ was developed in the context of sport teams. Both the GEQ and Langfred’s scale were used to measure group level’s cohesion. Therefore, we slightly modified the words of items to fit the contexts of business and organizational level’s cohesion. For example, we changed one item of GEQ “our team would like to spend time together in the off season” into “our team would like to spend time together off the work.”
5.2 Analyses and Results
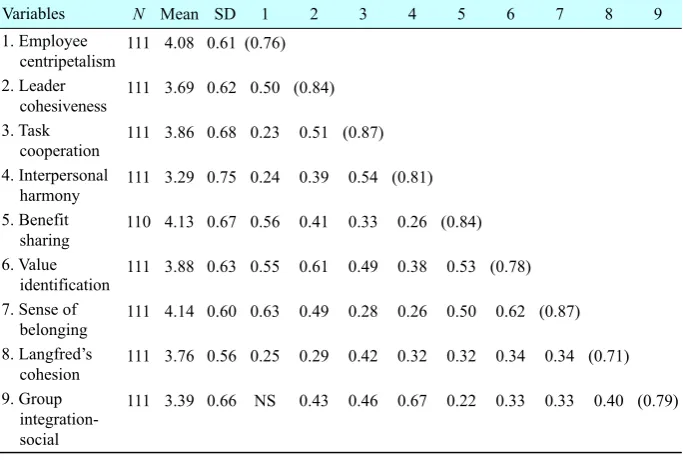
Table 8 shows that all Cronbach’s alpha coefficients of the scales were above 0.70,
Table 8 Test Results of the OCI’s Concurrent Validity
Variables N Mean SD 1 2 3 4 5 6 7 8 9
1. Employee
centripetalism 111 4.08 0.61 (0.76)
2. Leader
cohesiveness 111 3.69 0.62 0.50 (0.84) 3. Task
cooperation 111 3.86 0.68 0.23 0.51 (0.87) 4. Interpersonal
harmony 111 3.29 0.75 0.24 0.39 0.54 (0.81) 5. Benefit
sharing 110 4.13 0.67 0.56 0.41 0.33 0.26 (0.84) 6. Value
identification 111 3.88 0.63 0.55 0.61 0.49 0.38 0.53 (0.78) 7. Sense of
belonging 111 4.14 0.60 0.63 0.49 0.28 0.26 0.50 0.62 (0.87) 8. Langfred’s
cohesion 111 3.76 0.56 0.25 0.29 0.42 0.32 0.32 0.34 0.34 (0.71) 9. Group
integration- social
111 3.39 0.66 NS 0.43 0.46 0.67 0.22 0.33 0.33 0.40 (0.79)
Note: 1. All variables were measured with Likert five-point scale. 2. NS = Not Significant.
indicating satisfying reliabilities. The Cronbach’s alpha coefficient of each subscale of the OCI was above 0.75 and the correlation coefficients among dimensions ranged from 0.23 to 0.61, which corroborated the good psychometric properties of the OCI.
The correlation coefficients between group integration-social and interpersonal harmony of the OCI was the highest (r = 0.67, p < 0.001) among the correlations between group integration-social and each dimension of the OCI. Similarly, the correlation coefficient (r = 0.63, p < 0.001) between sense of belonging and employee centripetalism was the highest. Langfred’s cohesion scale had the highest correlation coefficient with task cooperation (r = 0.42, p < 0.001). Thus, our proposition was supported, which lent credence to the OCI’s concurrent validity.
6 Discussion and Conclusion
Most extant scales measure cohesion at the group level. In the present study, we developed an organizational level’s scale of cohesion (OCI) which contain six dimensions with 18 items, and tested its validity. Through experts’ participation, the OCI’s face validity was supported, and its construct validity was preliminarily testified. The results of CFA showed that the loadings of most items of OCI were above 0.70 and measurement errors were low. The six-dimension structure of the OCI was supported, with the Cronbach’s alpha coefficients of all dimensions ranging from 0.79 to 0.88, and dimensions being moderately correlated (r ranged from 0.23 to 0.64, p < 0.001). Multiple testing methods, such as CFA, AVE, models comparison, confidence interval, Fisher’s Z-transformation, and second- order CFA, corroborated the construct validity of the OCI (including convergent and discriminant validity). The OCI’s incremental validity was also supported by the results of hierarchical regression analyses. The incremental effect of organizational cohesion on OCB and organizational commitment were all 3% (p < 0.001) beyond control variables. We also tested the nomological net comprising organizational justice, organizational cohesion, organizational commitment, and OCB by the SEM. The results verified the nomological validity of the OCI. In terms of the concurrent validity, the criterion scales, including the GEQ, the PCS, and Langfred’s cohesion scale, were found to have significant correlations corresponding the OCI subscales (r ranged from 0.42 to 0.67, p < 0.001). All the results above suggest that the OCI has satisfying reliabilities and validities.
(individual attractions to group-task and individual attractions to group-social, leader caring and leader competence) are both challenged by empirical tests. In contrast, the discriminant validity of the OCI’s individual level dimensions (employee centripetalism and leadership cohesiveness) is supported empirically. Moreover, as we expected, leadership factor is also an important dimension in the Chinese business organizations. Although the CPCQ also includes leadership factors, the scale is limited in the setting with high power distance like military organizations. Meanwhile, interpersonal harmony and “a common destiny” (benefit sharing and value identification) are important components of cohesion. All contents of the dimensions are consistent with the Chinese cultural features.
Future research can use the OCI as an instrument to explore the antecedents and consequences of organizational cohesion, as well as their process mechanisms, to further understanding organizational cohesion. In practices of organizational management, the OCI can be applied to examine an organization’s cohesion status, and managers can be informed the cohesion variances at different levels (individual, group, and organizational) as well as on different dimensions. Thus, managers can figure out methods to resolve the problem. China is a country with strong collectivism tradition. Thus most Chinese values social integration at all levels and stresses harmony as well as cohesion. For instance, as for a family, there is a saying “jia he wan shi xing (harmony brings wealth)”; for a group, “er ren tong xin, qi li duan jin (if two people unite as one, their strength is powerful enough to cut through metal)”; for the country, “he xie she hui (harmonious society)”; for the world, “da tong shi jie (one world).” Accordingly, organizations in Chinese cultural background pay special attentions to harmonious relationships. The cultural traditions make cohesion an essential and profound issue of management theories and practices in Chinese organizations.
job involvement, etc., so as to test the validity of the OCI in a broader conceptual network, and to deepen the understanding about the relationships between cohesion and other related concepts.
Acknowledgements This research is supported by the National Social Science Foundation of China (No. 06CJY024). We thank Professor Baiyin Yang for his helpful comments on an earlier draft of this paper. Sincere thanks also go to Doctor Xiangyang Zhao and Ms. Hongguo Wei for their help in the translation of this work.
References
Anderson J C, Gerbing D W (1988). Structural equation modeling in practice: A review and recommended two-step approach. Psychological Bulletin, 103(3): 411–423
Bagozzi R P, Philips L W (1982). Representing and testing organizational theories: A holistic construal. Administrative Science Quarterly, 27(3): 459–489
Beal D J, Cohen R R, Burke M J, McLendon C L (2003). Cohesion and performance in groups: A meta-analytic clarification of construct relations. Journal of Applied Psychology, 88(6): 989–1004
Benson J, Hagtvet K (1996). The Interplay among Design, Data Analysis, and Theory in the Measurement of Coping. New York: Wiley
Blau P (1964). Exchange and Power in Social Life. New York: Wiley
Bollen K A (1989). Structural Equations with Latent Variables. New York: Wiley
Bollen K A, Hoyle R H (1990). Perceived cohesion: A conceptual and empirical examination. Social Forces, 69(2): 479–504
Cameron K S, Quinn R E (1999). Diagnosing and Changing Organizational Culture: Based on the Competing Values Framework. Reading, MA: Addison-Wesley
Carless S A, De Paola C (2000). The measurement of cohesion in work teams. Small Group Research, 31(1): 71–88
Carron A V, Widmeyer W N, Brawley L R (1985). The development of an instrument to assess cohesion in sport teams: The group environment questionnaire. Journal of Sport Psychology, (7): 244–266
Chen Z X, Francesco A M (2003). The relationship between the three components of commitment and employee performance in China. Journal of Vocational Behavior, 62(3): 490–510
Chen Z X, Tsui A S, Farh J L (2002). Loyalty to supervisor vs. organizational commitment: Relationships to employee performance in China. Journal of Occupational and Organizational Psychology, 75(3): 339–356
Colquitt J A (2001). On the dimensionality of organizational justice: A construct validation of a measure. Journal of Applied Psychology, 86(3): 386–400
Cronbach L J, Meehl P E (1955). Construct validity in psychological tests. Psychological Bulletin, 52: 281–302
Durkheim E (1930/1996). 自杀论 ( Le Suicide). 冯韵文 (Feng Yunwen) (Trans.). 北京: 商 务印书馆
Earley C (1989). Social loafing and collectivism: A comparison of the United States and the People’s Republic of China. Administrative Science Quarterly, 34: 565–581
Research and Practice, 4(3): 230–243
Evans N J, Jarvis P A (1980). Group cohesion: A review and re-evaluation. Small Group Behavior, 17: 359–370
Evans N J, Jarvis P A (1986). The group attitude scale: A measure of attraction to group. Small Group Behavior, 17(2): 203–216
Farh J L, Zhong C B, Organ D W (2004). Organizational citizenship behavior in the People’s Republic of China. Organization Science, 15: 241–253
Farh J, Early P C, Lin S (1997). Impetus for action: A cultural analysis of justice and organizational citizenship behavior in Chinese society. Administrative Science Quarterly: 421–444
Folger R, Konovsky M A (1989). Effects of procedural and distributive justice on reactions to pay raise decisions. Academy Of Management Journal, 32: 115–130
Fornell C, Larcker D F (1981). Evaluating structural equation models with unobservable variables and measurement error. Journal of Marketing Research, 18: 39–50
Giles W F, Findley H M, Field H S (1997). Procedural fairness in performance appraisal: Beyond the review session. Journal of Business and Psychology, 11: 493–506
Gouldner A W (1960). The norm of reciprocity. American Sociological Review, 25: 161–178 Hofstede G (1983). National cultures in four dimensions. International Studies of Management
and Organization, 13: 46–74
Hofstede G (1992). Cultural constraints in management theories. Paper presented at the annual meeting of the Academy of Management, Las Vegas, NV
Hofstede G, Bond, M H (1988). The Confucius connection: From cultural roots to economic growth. Organizational Dynamics, 16(4), 5–21
Hogg M A (1992). The Social Psychology of Group Cohesiveness: From Attraction to Social Identity. New York: Harvester Wheat Sheaf
Homans G C (1958). Social behavior as exchange. American Journal of Sociology, 63: 597–606
Johnson N L, Kotz S, Balakrishnan N (1995). Continuous Univariate Distributions. 2nd edition. New York: Wiley
Jöreskog K G (1971). Statistical analysis of congeneric tests. Psychometrika, 36: 109–133 Jöreskog K G (1993). Testing Structural Equation Models. Thousand Oaks, CA: Sage Kotter J P, Heskett J L (1992). Corporate Culture and Performance. New York: Free Press Langfred C W (1998). Is group cohesiveness a double-edged sword? An investigation of the
effects of cohesiveness on performance. Small Group Research, 29(1): 124–143 Lewin K (1935). A Dynamic Theory of Personality. New York: McGraw-Hill
Masterson S S, Lewis K, Goldman B M, Taylor M S (2000). Integrating justice and social exchange: The differing effects of fair procedures and treatment on work relationships. Academy Of Management Journal, 43: 738–748
Meyer J P, Allen N J (1991). A three-component conceptualization of organizational commitment. Human Resource Management Review, 1: 61–89
Mudrack P E (1989). Defining group cohesiveness: A legacy of confusion? Small Group Behavior, 20: 37–49
Mullen B, Copper C (1994). The relation between group cohesiveness and performance: An integration. Psychological Bulletin, 115(2): 210–227
Podsakoff P M, Mackenzie S B, Lee J Y, Podsakoff N P (2003). Common method biases in behavioral research: A critical review of the literature and recommended remedies. Journal of Applied Psychology, 88(5): 879–903
behaviors: A critical review of the theoretical and empirical literature and suggestions for future research. Journal of Management, 26: 513–565
Schein E (1985). Organizational Culture and Leadership. San Francisco, CA: Jossey-Bass Schwab D P (1980). Construct validity in organizational behavior. In: Cummings L L & Staw
B M (eds.), Research in Organizational Behavior, Vol. 2. Greenwich, CT: JAI Press, 3–43 Sechrest L (1963). Incremental validity: A recommendation. Educational and Psychological
Measurement, 23: 153–158
Siebold G L (1999). The evolution of the measurement of cohesion. Military Psychology, 11(1): 5–26
Spreitzer G M (1995). Psychological empowerment in the workplace: Dimensions, measurement, and validation. Academy Of Management Journal, 38(5): 1442–1465.
Strauss A, Corbin J (1990). Basic of Qualitative Research: Grounded Theory Procedures and Techniques. Newbury Park: Sage
Tajfel H (1982). Social identity and intergroup relations. Annual Review of Psychology, 33: 1–39
Thompson B, Daniel L G (1996). Factor analytic evidence for the construct validity of scores: A historical overview and some guidelines. Educational and Psychological Measurement, 56: 197–208
Triandis C H (1995). Individualism and Collectivism. Boulder, CO: Westview Press.
Trompenaars F (1993). Riding the Waves of Culture: Understanding Diversity in Global Business. London: The Economist Books
Ungson G R, Sterrs R M, Park S (1997). Korean Enterprise: The Quest for Globalization. Boston: Harvard Business School Press
Yang B Y, Watkins K E, Marsick V J (2004). The Construct of learning organization: Dimensions, measurement, and validation. Human Resource Development Quarterly, 15(1): 31–55
侯杰泰, 温忠麟, 成子娟 (Hau K T, Wen Zhonglin, Cheng Zijuan) (2004). 结构方程模型及 其应用 (Structural equation model and its applications). 北京: 教育科学出版社
敬之, 佟沛 (Jing Zhi, Tong Pei) (1992). 关于企业凝聚力的调查分析 (An investigation and analysis on enterprises’ cohesiveness). 经营与管理, (5): 30–31
李海, 张勉 (Li Hai, Zhang Mian) (2008). 凝聚力的结构、形成和影响:一个研究述评 (A review on the construct, measures, and impacts of cohesiveness). 经济管理, (7): 47–51 李海, 张勉, 李博 (Li Hai, Zhang Mian, Li Bo) (2009). 组织凝聚力结构与影响因素:案例
研究及理论构建 (The construct and antecedents of organizational cohesiveness: A case study and the theory development). 北京师范大学学报(社会科学版), (6): 49–58
李辽宁, 闻燕华 (Li Liaoning, Wen Yanhua) (2007). 近年来我国对社会整合问题的研究综 述 (A studies review on the social integration in recent years China). 贵州社会科学, (2): 56–60
邱皓政 (Qiu Haozheng) (2003). 结构方程模式:LISREL的理论、技术与应用(Principles and practice of structural equation model with LISREL). 台北: 双叶书廊
吴志明, 武欣 (Wu Zhiming, Wu Xin) (2005). 知识工作团队中组织公民行为对团队有效 性的影响作用研究 (Effects of organizational citizenship behaviors on team effectiveness: A empirical study on knowledge work teams). 科学学与科学技术管理, (8): 92–96 张潘仕 (Zhang Panshi) (1991). 关于大中型国营企业凝聚力的调查分析 (Investigation and