R E S E A R C H A R T I C L E
Open Access
A survey on predicting the popularity of web
content
Alexandru Tatar
1*, Marcelo Dias de Amorim
1, Serge Fdida
1and Panayotis Antoniadis
2Abstract
Social media platforms have democratized the process of web content creation allowing mere consumers to become creators and distributors of content. But this has also contributed to an explosive growth of information and has intensified the online competition for users attention, since only a small number of items become popular while the rest remain unknown. Understanding what makes one item more popular than another, observing its popularity dynamics, and being able to predict its popularity has thus attracted a lot of interest in the past few years. Predicting the popularity of web content is useful in many areas such as network dimensioning (e.g., caching and replication), online marketing (e.g., recommendation systems and media advertising), or real-world outcome prediction (e.g., economical trends). In this survey, we review the current findings on web content popularity prediction. We describe the different popularity prediction models, present the features that have shown good predictive capabilities, and reveal factors known to influence web content popularity.
Keywords: Web content; Social media; Popularity; Prediction
1 Introduction
In the digital world, web content has become the main attraction. Whether it is useful information and enter-tainment to Internet users or a business opportunity for marketing companies and content providers, web content is a valuable asset on the Internet. At the same time, the growth in social media innovation, the ease of content creation and low publishing costs has created a world sat-urated with information. For example, every minute, users around the world send more than 300,000 tweets [1], share more than 680,000 pieces of content on Facebook [2], and upload 100 hours of video on YouTube [3]. Yet the online ecosystem adheres to a “winner-take-all” society: the attention is concentrated on only a few items. In this context, identifying the web content that will become popular becomes of utmost importance. Online users, flooded by information, can reduce the clutter and focus their attention – the most valuable resource in the online world – on the most relevant information for them. In a world where companies spend up to 30% of their budget on online marketing [4], early detection of the next rising
*Correspondence: [email protected]
1LIP6/CNRS – UPMC Sorbonne Universités, 4 Place Jussieu, 75005 Paris, France Full list of author information is available at the end of the article
star of the Internet can maximize their revenues through better ad placement. Moreover, given the ever-growing consumer Internet traffic, content-distribution networks can rely on popularity prediction methods to proac-tively allocate resources according to the future users’ demand.
But predicting the popularity of web content is a chal-lenging task. First, different factors known to influence content popularity, such as the quality of the content or its relevance to users, are difficult to measure. Then, other factors, such as the relationship between events in the physical world and the content itself are hard to capture and included in a prediction model. Moreover, at a micro-scopic level, the evolution of content popularity may be described by complex online interactions and information cascades that are difficult to predict [5-7].
Predicting the popularity of web content has become an active area of research and, while still in an incipient phase, a large number of prediction methods for dif-ferent types of web content have been proposed in the latest years. In this article we review the current state of research in this field, identify trends, and suggest domains that can benefit from these studies. To the best of our knowledge there has been no prior attempt to summa-rize this research area. The closest to our work is the
survey proposed by Yu and Kak, which describes the dif-ferent real-life outcomes that can be predicted using social media (e.g., election results, box-office revenues, mar-keting impact) [8]. In our work we focus on a different prediction objective related to social media: predicting the amount of attention that web content will generate on the Internet.
The remainder of the paper is organized as follows. We narrow down the scope of this survey in Section 2 and briefly review the evolution of this research area in Section 3. We continue with a presentation of the most popular types of web content analyzed so far (Section 4) and describe the measures used to evaluate the pre-diction performance (Section 5). In order to structure the prediction methods, we propose a classification in Section 6 and describe the prediction methods based on this classification in Section 7. We present the fac-tors known to influence content popularity (Section 8) and review the predictive features that have already been used in a prediction model in Section 9. Finally, we con-clude with a presentation of some representative domains that could benefit from web content popularity predic-tion (Secpredic-tion 10) and look at potential future direcpredic-tions in Section 11.
2 Scope of the survey
Let us now define the scope of this survey. The termweb contentis effectively generic as it broadly defines any type of information on a web site. It can refer both to the sub-ject of the information and the individual item used to deliver the information. In this survey we define web con-tent as any individual item (in the form of text, image, audio, or video), publicly available on a web site, which contains a measure that reflects a certain level of interest showed by an online community.
On the Internet, the popularity of web content can have different connotations. If by content we refer to the sub-ject of the content, such as a person or an organization, then popularity could be expressed by a greater web pres-ence or activity. From a different perspective, one may see web content as an individual web link and define pop-ularity as the poppop-ularity of the link (the quantity and quality of inbound links). For the scope of this survey, we consider popularity from the standpoint of the relation-ship between an individual item and the online users who consume it.
Seen from this perspective, there are different metrics used to quantitatively evaluate web content popularity. The classical way of doing this is to measure the num-ber of views. However, this information is often hidden from the online users and crawling engines. For exam-ple, social networking sites, for various reasons, usually do not disclose this information to the online users [9].
But nowadays, with the growing prevalence of Web 2.0 platforms, there are new indicators – publicly available – that reflect users’ interest. In response to the publication of a web content, users can now provide a direct feed-back, through comments and ratings, or further share it in their online social circles (using, for example, Facebook, Twitter, or Digg). These metrics capture different levels of user engagement and provide valuable information, com-plementary to view counts: rating improves the quality of publications, comments increase the time spent on a web page, and sharing gives content a greater notoriety. In general, it has been observed that there is a moderate cor-relation between the different popularity metrics [9-13], as they probably capture different types of habits on the Internet (to observe, comment, rate, or share). In this con-text, studying these metrics individually or how they relate to each other [14,15] provides a wider and better per-spective of what the popularity of a web content actually means.
3 A brief history of the evolution of popularity prediction methods
The beginning of this research area can be found in the early studies on users’ web access patterns [16-19]. An important observation of these initial studies was that the distribution of users’ requests for web pages is highly skewed and could be described by a Zipf ’s law [18]. Online videos, accounting for a significant amount of Internet traffic, have been one of the main attraction of these early measurements [20-27]. During this initial phase, researchers have looked at the degree of skewness in the popularity of videos [20,21,24,25] (to determine potential benefit of caching videos) and analyzed which probabil-ity distribution best describes the video access patterns (to understand the mechanism that explains users’ consump-tion patterns [28]). These studies revealed that the interest generated by a web content is transient, heterogeneous, and often unpredictable [24,28].
published on various web sites has been analyzed, and dif-ferent measures about web content popularity have been considered.
These initial prediction methods were simple but often inaccurate for web content that remains attractive for longer periods of time [30]. An important step forward has been made with the finding that the evolution of web content popularity over time can be described by a only small number of temporal patterns [31,32]. Thus, more accurate prediction methods that include infor-mation about the evolution patterns of content pop-ularity, have been proposed [32-34]. But the content published on a web site is part of a global informa-tion ecosystem as it can spread on several web sites and reach consumers through different communication mediums. So, a further breakthrough in the design of more accurate prediction methods has been made with the development of algorithms that can extract and cross-correlate information from different web domains [14,35,36].
4 Types of web content
Users attention is spread across multiple web sites and various types of web content. Some of the most pop-ular types of web content studied so far include: user-generated videos that account for a great percent of Internet traffic [37]; news articles, massively diffused through social networking sites [38] and heavily con-sumed on mobile devices [39]; stories published on social news aggregators that provide an even greater exposure to the most popular content on the Internet; and items (comments, photos, or videos) published on social net-working sites, the most popular platforms to share infor-mation and encourage users’ participation on a global scale.
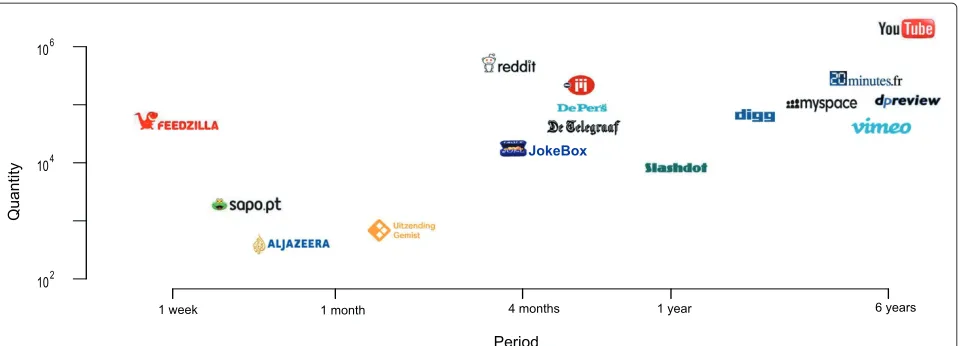
Examples of the variety of web content, gathered from different web sites and used in the context of popularity prediction, are illustrated in Figure 1, together with infor-mation about the number of items and the time period covered by each data set.
Online videos.YouTube, the world’s largest video shar-ing platform with 100 hours of upload per minute [3] and more than 1 trillion worldwide views per year [40], has been the main focus of the existing studies. The site’s content, with more than 200 million unique videos, cov-ers a broad range of topics and is sustained by a big and active online community [41]. Studying the popu-larity of YouTube content is challenging given the ever-growing number of videos, the many features that the platform provides (e.g., video recommendations, inter-nal search, online social networking), and the limitations associated with the retrieval of a representative sample of videos [42].
The popularity of YouTube videos, commonly expressed by the number of views in research studies, follows a heavy-tailed distribution that, depending on the data set and the method used to fit the distribution, can be described by power-law with exponential cut-off [28], Weibull [41], log-normal [42], or Gamma distribu-tions [43]. But the popularity of videos over time is highly non-stationary. From a high-level point of view, the popularity growth of videos over time can be repre-sented by power-law or exponential distributions [44]. A more fine-grained analysis exhibits even more complex and diverse patterns. For instance, Crane and Sornette found that, while the activity around most YouTube videos can be described by a Poisson process, many videos reveal similar activity around the peak period that can be accurately described by three popu-larity evolution patterns [31]. Similar temporal evolution patterns have been observed by Figueiredo [45] and even more diverse shapes have been discovered by Gorsun et al. [32].
In addition to YouTube, the popularity of videos published on other platforms has been studied (e.g., Daum [28], Dutch TV [44], DailyMotion [46,47], Yahoo! video [47], Veoh [47], Metacafe [47], Vimeo [34]), but on a smaller scale, and no significant differences have been signaled in terms of popularity distributions.
Online news.The primary source of information in the digital world, news, are created in large numbers and massively diffused through online social networks [38]. Compared to videos that catch users’ attention for a longer period of time, the interest in news articles fades quickly, within days after publication [14,48]. The popu-larity of online news, frequently expressed by the number of comments (the number of views are rarely disclosed by news platforms), is also highly skewed, and can be described by power-law [49,50] or log-normal [51] distributions.
Social bookmarking sites.The third major type of web content analyzed so far is represented by stories posted on social bookmarking sites such as Digg [30,52,53], Slashdot [29], or Reddit [53,54]. Content published on these sites experiences an even greater rate of change with stories reaching their attention peak in the first six hours after publication and being completely sat-urated within one day [30]. Prediction becomes even more difficult in this setting given the complex inter-actions between users [55,56] and the promotion algo-rithm based on the collective opinion of users [57,58]. The popularity of the content published on these sites is described by a heavy-tailed nature that is best rep-resented by Weibull [53] or log-normal distributions [30,52,59].
Figure 1Data sets used as case studies to evaluate the performance of prediction methods.On a log-log scale we depict the total number of items and the cumulative time period covered by each data set.
these sites allow users to build and maintain online social relationships with people that share common interest, background, or real-life relationships. While there are different types of social networking services the most pop-ular are the ones built on the idea of content sharing. Microblogs, such as Twitter and Weibo, are a specific type of social networking services that have been exten-sively studied. These platforms are probably the most dynamic representation of social media. Users create and share information in the form of short messages, known as tweets, containing up to 140 characters. When a user posts a (re)tweet it becomes visible to all its followers (i.e., members of the social group). Content can easily spread through the social connectivity graphs as followers can further share the content to their own list of followers. Two metrics have been used to measure the popularity of a tweet: the number of users that receive a message in their tweet feed [60], or most commonly, the num-ber of retweets. The popularity of tweets is also highly skewed and can be described by a power-law distribution [61-63].
Tweets are probably one the most ephemeral type of web content as they become popular very fast and they quickly die out. For example, studies conducted on Ten-cent Weibo found out that an insignificant number of tweets get retweeted after one day [63]. Similarly, a study on Twitter revealed that most tweets receive half of their retweets within the first hour after publication [64]. Useful predictions thus need to be done in the order of minutes after the post of a tweet.
In addition to these main categories, content published on other web sites have been used for popularity pre-diction tasks such as threads published on discussion forums (DPReview, MySpace [65]) and movie ratings on
IMDb [36]. Due to the relevancy of the results we also include in our analysis the prediction results for the con-tent published on two applications: an interactive video sharing application (Zync) [66] and a joke sharing applica-tion (JokeBox) [67].
5 Evaluating the prediction models
To provide a more explicit description of the prediction algorithms, let us introduce the terminology and the mea-sures used to evaluate the efficiency of the prediction methods.
Terminology.Letc∈Cbe an individual item from a set Cobserved during a periodT. We uset ∈ T to describe the age of an item (i.e., duration since the time it was pub-lished) and mark two important moments: indication time ti, representing the time we perform the prediction and reference timetr, the moment of time when we want to predict content popularity. LetNc(ti)be the popularity of cfrom the time it was published untiltiand letNc(tr)be the value that we want to predict, i.e., the popularity at a later timetr. We defineNc(ti,tr)the prediction outcome: the predicted popularity ofcat tr using the information available untilti. Thus, the better the prediction, the closer
Nc(ti,tr)is toNc(tr).
Evaluation. We distinguish two prediction goals: (i) Numerical prediction – predict the exact value of the pop-ularity, (ii) Classification – predict the popularity range that an item is most likely to fall in.
5.1 Numerical prediction
errors. By taking the square root of MSE, one can express the error in the same dimension as the esti-mated value (RMSE – Equation 2). One important lim-itation of squared errors is that they put too much weight on the effect of outliers, and in this case report-ing the absolute errors is a good alternative (MAE – Equation 3).
Absolute errors can be meaningfully interpreted if one knows the range of the actual popularity values. Other-wise, a good way of expressing the prediction performance is through relative errors such as the Mean Relative Error (MRE – Equation 4) and Mean Relative Squared Error (MRSE – Equation 5). Relative measures are also useful to compare the efficiency of prediction algorithm across studies, as in most cases the popularity values have widely different ranges (e.g., the number of views on YouTube is several orders of magnitude greater than the number of comments on a news web site). Special attention should be paid when using these error measures for zero-inflated variables as the relative error is undefined when the actual value is zero.
Another way of expressing the prediction error is through the Relative Squared Error (RSE – Equation 6), Root Relative Squared Error (RRSE – Equation 7), and Relative Absolute Error (RAE – Equation 8). The error in this case is expressed relative to the performance of a sim-ple predictor, the average of the actual values (computed on the training data set).
The quality of a numerical prediction can also be reported using the correlation coefficient or the coeffi-cient of determination (R2). Compared to the previous measures, which show how the estimated values diverge from the actual ones, these evaluation criteria can only express the degree of linear association between the two variables (predicted and actual values).
MSE= 1
|C|
c∈C
Nc(ti,tr)−Nc(tr)
2
· (1)
RMSE=
1 |C|
c∈C
Nc(ti,tr)−Nc(tr)
2
· (2)
MAE= 1
|C|
c∈C
Nc(ti,tr)−Nc(tr)· (3)
MRE= 1
|C|
c∈C
Nc(ti,tr)−Nc(tr) Nc(tr)
· (4)
MRSE= 1
|C|
c∈C
Nc(ti,tr)−Nc(tr) Nc(tr)
2
· (5)
RSE=
c∈CNc(ti,tr)−Nc(tr)
2
c∈CNc(tr−N(tr)
2 · (6)
RRSE=
c∈CNc(ti,tr)−Nc(tr)
2
c∈CNc(tr−N(tr)2
· (7)
RAE=
c∈CNc(ti,tr)−Nc(tr)
c∈C(Nc(tr−N(tr)
· (8)
5.2 Classification
This prediction problem can also be addressed as a clas-sification task, where, assuming that the popularity range is known, one can split this interval inknon-overlapping popularity ranges. Thus, given thekpossible outcomes the prediction goal is to correctly predict the popularity class of a web content.
Various metrics are available to evaluate the qual-ity of a classification method [68,69]. Accuracy, one of the most reported metric, is used to express the pro-portion of correctly classified instances. This measure is nevertheless inappropriate when dealing with highly imbalanced classes, which can often be the case when referring to web content popularity, characterized by a heavy-tail nature. For example, a possible experiment could be to learn a classifier that predicts which videos will get more that 106 views on YouTube - a “small” class (1%) according to a recent study [70]. A simple rule, that decides that all videos receive less than 106 views, will correctly predict 99% of the cases. Thus, a good level of accuracy is obtained without even learn-ing any prediction rule on how to detect the popular items.
To measure the performance of the classifier on a “small” class, a good alternative is to useprecision,recall, or F-score (the harmonic mean between precision and recall). ButF-scoremeasures the performance of a clas-sifier for only one class. To report the aggregate perfor-mance over multiple classes, a good solution is to use the macro-average measure (average F-score over all k classes).
6 A classification of web content popularity prediction methods
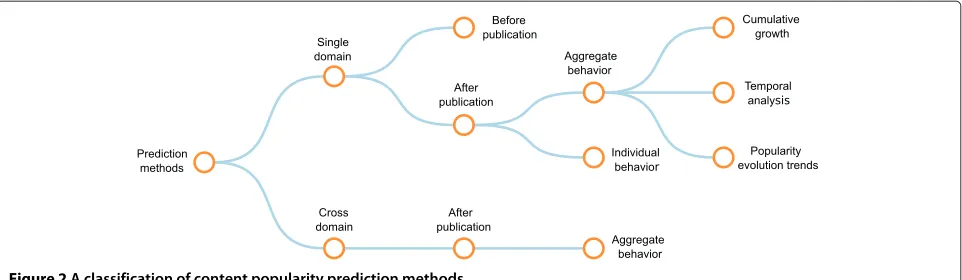
Figure 2A classification of content popularity prediction methods.
and the granularity of information used in the prediction process (Figure 2).
6.1 Single domain
We define a domain as the web site where an individual item resides, regardless if it has been created or shared from an external source (e.g., news article shared on social bookmarking sites). Methods under this category are used to predict content popularity using only the information available on the web site.
6.1.1 Before publication
One of the most challenging objectives is to predict the popularity before the publication of a web content, relying only on content metadata or the online social connections of the publisher.
6.1.2 After publication
The alternative is to include in the prediction model data about the attention that one item receives after its publication.
Aggregate behavior.A common approach is to deduce
future content popularity using the aggregate users’ attention after the publication of a web content. This solution can further be separated in three main categories:
• Study thecumulative growth of attention, i.e., the amount of attention that one item receives from the moment it was published until the prediction moment.
• Perform atemporal analysis of how content popularity evolves over time until the prediction moment.
• Use clustering methods to find web items with similarpopularity evolution trends.
Individual behavior.Instead of treating each user’s action equally, one may further refine the prediction model by taking into account individual user behavior.
6.2 Cross domain
Explaining popularity from the perspective of single domain is limited due to the complex users’ interactions across different platforms. Methods under this class draw conclusions by extracting and transferring information across web sites.
7 A survey on popularity prediction methods Several popularity prediction methods have been pro-posed in the last decade, from simple linear regression functions to complex frameworks that cross-correlate information from different web sites. We describe these methods following the classification proposed in Section 6 and present their performance on predicting the popular-ity of different types of web content. A summary of these methods is also presented in Table 1.
7.1 Single domain
In the vast majority of cases, prediction methods rely entirely on the information available on the web site where content has been published.
7.1.1 Before publication
Predicting the popularity of an item before its publication is particularly useful for web content characterized by a short lifespan. News articles, which are time-sensitive by nature, fall under this category and have been analyzed in two studies [71,72].
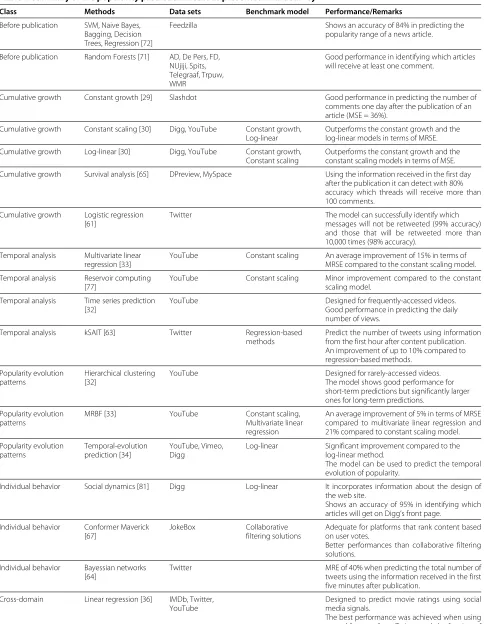
Table 1 Summary of the popularity prediction methods presented in the survey
Class Methods Data sets Benchmark model Performance/Remarks
Before publication SVM, Naive Bayes, Bagging, Decision Trees, Regression [72]
Feedzilla Shows an accuracy of 84% in predicting the popularity range of a news article.
Before publication Random Forests [71] AD, De Pers, FD, NUjiji, Spits, Telegraaf, Trpuw, WMR
Good performance in identifying which articles will receive at least one comment.
Cumulative growth Constant growth [29] Slashdot Good performance in predicting the number of comments one day after the publication of an article (MSE = 36%).
Cumulative growth Constant scaling [30] Digg, YouTube Constant growth, Log-linear
Outperforms the constant growth and the log-linear models in terms of MRSE.
Cumulative growth Log-linear [30] Digg, YouTube Constant growth, Constant scaling
Outperforms the constant growth and the constant scaling models in terms of MSE.
Cumulative growth Survival analysis [65] DPreview, MySpace Using the information received in the first day after the publication it can detect with 80% accuracy which threads will receive more than 100 comments.
Cumulative growth Logistic regression [61]
Twitter The model can successfully identify which messages will not be retweeted (99% accuracy) and those that will be retweeted more than 10,000 times (98% accuracy).
Temporal analysis Multivariate linear regression [33]
YouTube Constant scaling An average improvement of 15% in terms of MRSE compared to the constant scaling model.
Temporal analysis Reservoir computing [77]
YouTube Constant scaling Minor improvement compared to the constant scaling model.
Temporal analysis Time series prediction [32]
YouTube Designed for frequently-accessed videos. Good performance in predicting the daily number of views.
Temporal analysis kSAIT [63] Twitter Regression-based methods
Predict the number of tweets using information from the first hour after content publication. An improvement of up to 10% compared to regression-based methods.
Popularity evolution patterns
Hierarchical clustering [32]
YouTube Designed for rarely-accessed videos. The model shows good performance for short-term predictions but significantly larger ones for long-term predictions.
Popularity evolution patterns
MRBF [33] YouTube Constant scaling, Multivariate linear regression
An average improvement of 5% in terms of MRSE compared to multivariate linear regression and 21% compared to constant scaling model.
Popularity evolution patterns
Temporal-evolution prediction [34]
YouTube, Vimeo, Digg
Log-linear Significant improvement compared to the log-linear method.
The model can be used to predict the temporal evolution of popularity.
Individual behavior Social dynamics [81] Digg Log-linear It incorporates information about the design of the web site.
Shows an accuracy of 95% in identifying which articles will get on Digg’s front page.
Individual behavior Conformer Maverick [67]
JokeBox Collaborative filtering solutions
Adequate for platforms that rank content based on user votes.
Better performances than collaborative filtering solutions.
Individual behavior Bayessian networks [64]
Twitter MRE of 40% when predicting the total number of tweets using the information received in the first five minutes after publication.
Cross-domain Linear regression [36] IMDb, Twitter, YouTube
Designed to predict movie ratings using social media signals.
Table 1 Summary of the popularity prediction methods presented in the survey(Continued)
Cross-domain Linear regression [14] Al Jazeera Results show that a model based on social media reactions in the first ten minutes has the same performance as one based on the number of views received in the first three hours.
Cross-domain Social transfer [35] YouTube, Twitter SVM basic Shows a 70% accuracy in identifying which videos will receive sudden bursts of popularity (60% improvement over a model that uses only the information available on YouTube).
when trying to predict if the volume of comments will be high or low.
Bandari et al., using the number of tweets as an indicator of news popularity, formulate the prediction task both as a numerical and a classification problem [72]. The authors show that predicting the exact popularity of news articles is prone to large errors (R2 = 0.34), but that predicting ranges of popularity is more effective, with an accuracy of 84% when identifying articles that would receive a small, medium, or large number of tweets.
7.1.2 After publication
Aggregate behavior The methods under this category
have been used to predict web content popularity based on the aggregate users’ attention received early after con-tent publication.
Cumulative growth. One of the first solutions, used to predict the popularity of Slashdot stories, is proposed by Kaltenbrunner et al. [29]. The model, which we will refer to asgrowth profile(we adopt the terminology used in [30]), assumes that, depending on the time of the pub-lication, news stories follow a constant growth that can be described by the following function:
Nc(ti,tr)= Nc(ti) P(ti,tr)
, (9)
whereP(ti,tr)is a rescaling parameter and represents the average growth of a story fromtitotr
P(ti,tr)= 1 |C|
c∈C Nc(ti) Nc(tr)·
(10)
The effectiveness of this method was tested on a large corpus of Slashdot stories and shows a reasonable per-formance in predicting the popularity of stories using the aggregate users’ reactions in the first day after news publication (average MRE of 36%).
Describing future popularity as a linear relationship of the popularity at earlier stages is also proposed by Szabo and Huberman under the constant scaling model [30]:
Nc(ti,tr)=α2(ti,tr)Nc(ti)· (11)
Parameter α is computed in such a way that the model minimizes MRSE and is described by the following expression:
α(ti,tr)=
c∈C NNcc((ttir))
c∈C
Nc(ti) Nc(tr)
2· (12)
Szabo and Huberman also observe a positive correlation between the popularity of an item early after its pub-lication and its popularity at a later stage and propose a logarithmically transformed linear regression model (log-linear) expressed as
Nc(ti,tr)=exp
lnNc(ti)+β0(ti,tr)+ σ
2 0(ti,tr)
2
·
(13)
For the coefficients of Equation 13,β0is computed on
the training set using maximum likelihood parameter esti-mation on the regression function lnNc(tr) = β0(ti,tr)+ lnNc(ti) and σ02 is the estimate of the variance of the residuals on a logarithmic scale.
This method shows good predictive performance on several data sets: Digg stories [30], YouTube videos [30], articles published on a French news platform [73], and Dutch online news articles [51]. For example, Tsagkias et al. observe that, by using the number of comments received in the first ten hours after the publication of news articles, one can attain good performances in pre-dicting the final number of comments (average MRSE of 20%) [51].
can also be used for popularity prediction tasks. The solution proposed by Lee et al. is to consider as event the time when a web content will reach a popularity value above a certain threshold. The performance of this method was tested on threads from two online discus-sion forums, DPreview and MySpace, with popularity expressed as the number of comments per thread. Using different statistics related to the users’ comment arrival rate the authors show that, by observing user activity in the first day after publication, the method can detect with 80% accuracy the threads that will receive more than 100 comments.
Regression-based methods have been frequently used for this prediction task. Tatar et al. use a simple linear regression based on the early number of comments to pre-dict the final number of comments for news articles [74]. The authors observe that there is no significant improve-ment when using specialized prediction models as a func-tion of the category and the publicafunc-tion hour of an article. Marujo et al. study the problem of predicting the num-ber of clicks that news stories will receive during one hour. Various prediction methods have been tested (mul-tiple linear regression, regression-based trees, bagging, and additive regression) using different features extracted from the news web platform. The authors show that by combining different regression algorithms one can obtain fairly good results (MRE=12%) in predicting the number of clicks received by news articles during one hour. Cho et al. use a linear model on a logarithmic scale to predict popularity ranges for political blog posts [75]. The authors show that, by looking at the number of page views in the first 30 minutes, one can classify articles in three classes of popularity with 86% accuracy. A different approach is pro-posed by Tatar et al. who study the performance of three popularity prediction methods (simple linear regression, linear-log, and constant scaling) to order news articles based on their future number of comments [50]. Using a data set of news articles and comments, the authors show that, out of the three methods, a simple linear regression is the most adequate for this prediction task, suggesting that a smaller least squares error does not imply a smaller ranking error.
Predicting the popularity of web content, based on the aggregate user behavior, has also been addressed as a clas-sification problem. Jamali and Rangwala use the number of comments that Digg stories receive in the first ten hours to predict the final Digg score [56]. By training different classification methods the results indicate that it is pos-sible to predict the popularity class of a Digg story with an accuracy of 80%, 64%, and 45% when separating stories in 2, 6, and 14 ranges of popularity. Hong et al. study the problem of predicting the number of retweets for Twitter posts [61]. The authors address this problem as a multi-class multi-classification task, where, for a given tweet the goal
is to predict the range of popularity and not the exact retweet count. Using a logistic regression classification function and various content, topological, and temporal features the authors show that they can successfully pre-dict which messages will not be retweeted (99% accuracy) and those that will be retweeted more than 10,000 times (98% accuracy).
Temporal analysis.For web content that captures users’ attention for longer periods of time (e.g., certain videos that are viewed during several months or even years) it has been observed that the aggregate-based prediction models are prone to large errors [30]. To improve the prediction effectiveness, one solution is to design mod-els that can weight users’ attention differently based on the recency of the information relative to the prediction moment. For this type of evaluation, the aggregate user behavior is sampled in equal-size intervals of durationδ wherexc(i) is the popularity of an itemcduring the ith interval, and Xc(ti) is the vector of popularities for all intervals up toti: Xc(ti) =[xc(1),xc(2),xc(3) . . .,xc(i)]T (Nc(ti) = ij=1xc(tj)).
Pinto et al. rely on this approach to predict the pop-ularity of YouTube videos [33]. Using a sampling rate of one day the authors use amultivariate linear regressionexpressed as
Nc(ti,tr)=(ti,tr)Xc(ti)· (14)
The parameters of the model,(ti,tr)=[θ1,θ2, ..,θi] are
computed to minimize MRSE under the new definition of estimated popularity. Using a collection of YouTube videos this model shows a significant improvement com-pared to theconstant scalingmodel. For instance, predicting the popularity of a video one-month after its publication using data from the first week shows an aver-age improvement of 14% over theconstant scaling model. The main drawback of this algorithm, as men-tioned by the authors, is that in order for the prediction methods to be effective, additional exploration is needed to decide on the optimal history length and the sampling rate.
For videos that are popular over long periods of time (those that receive views during at least half a year), Gursun et al. [32] observe that the daily num-ber of views can be modeled through atime series predictionmodel using Autoregressive Moving Aver-age (ARMA). Thus, the popularity of a video at a given day n,xc(n), can be predicted using the following formula:
xc(n)= p
i=1
αixc(n−i)+n+ q
j=1
θjn−j, (15)
where α1,. . .,αp are the parameters of the
autoregres-sive model, θ1,. . .,θq are the parameters of the moving
average, andn,n−1,. . .are the white noise error terms.
The model shows good performance in predicting the number of daily views based on the viewership received in the previous week (p= q = 7), with an average MRE error of 15%. The main limitation of this method is that it has a very high computational cost as it requires one ARMA model for each video. To improve the scalability of the model the authors use principal component analy-sis (PCA) as follows: 1) use PCA to find the main principal components that can approximate the time series for the entire collection of videos and 2) apply ARMA model-ing to the principal components instead of the individual time series. This solution significantly improves the scal-ability of the model (e.g., it requires 20 ARMA models to make predictions for the entire collection of videos) and shows a minor decrease in the prediction accuracy (MRE=0.12 when using individual ARMA models com-pared to MRE = 0.14 when using principal component analysis).
Kong et al. propose kSAIT (top-k Similar Author-Identical historic Tweets), an algorithm that can predict the popularity of tweets one, two, or three days after pub-lication based on the retweet information received in the first hour [63]. The underlying assumption of this algo-rithm is that, tweets are retweeted in a similar manner depending on the author of the tweet. The prediction algorithm is thus user-specific (there is one prediction function for each user) and uses as predictive features only users’ retweeting behavior as it does not include any infor-mation about content itself or about users’ centrality in the graph of social interactions. Each tweet is described by a set of features (e.g., retweet acceleration, retweet depth) derived from the time-series of the retweets pub-lished in the first hour after publication by the direct and n-level followers, the publication time of the tweet, and information about the users who retweeted the orig-inal tweet. When a new tweet is posted, the algorithm computes the similarity of the tweet and all other tweets published by the same user, selects the top-k most simi-lar tweets, and estimates the popusimi-larity of the target tweet
as an average of the popularity of the top-k most similar tweets.
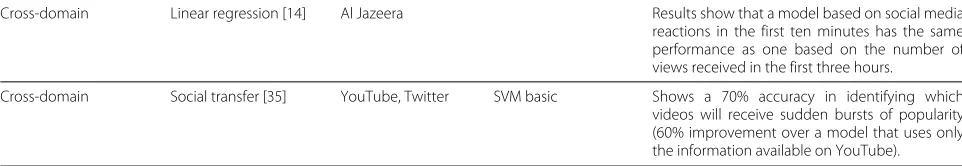
The performance of the algorithm was evaluated on a data set from Tencent Weibo and compared to several regression-based methods. The algorithm shows good prediction performance (an improvement of up to 10% in terms of MAE compared to regression-based methods), but training a personalized function for each user makes it difficult to be implemented in large-scale social networks. Popularity evolution trends. Several studies reveal that the evolution of content popularity over time can accu-rately be described by a small number of temporal pat-terns [31,32,45,78]. Crane and Sornette provide one of the first evidence of this fact while analyzing the popularity evolution of YouTube videos [31]. The authors observe that a Poisson process describes the attention around the majority of videos (90% of the videos) and the remaining ones follow three popularity evolution trends (illustrated in Figure 3). These trends are characterized by a sin-gle popularity peak but different patterns in which the popularity grows and declines. For more accurate pre-dictions it is important to know that content exhibits well-known temporal dynamics, as the prediction func-tion can be adapted to the specific shape of popularity evolution.
One of the first models that exploits the temporal evolu-tion patterns is proposed by Gursun et al. [32]. While ana-lyzing the viewership around YouTube videos the authors observe two overall categories of videos: those that are consistently popular over time and those that are viewed during a small period of time. The second category is characterized by short-time popularity bursts and can be described by a small number of temporal patterns. To reveal these patterns the authors use hierarchical clusteringbased on the time-series of videos popu-larity during 64 days centered on the peak. This strategy reveals that, for videos that are viewed during short peri-ods of time, there are ten common shapes that describe the temporal evolution for most of the videos. Once these shapes are detected the prediction task consists in mapping videos to the clusters that best describe their evolution until the prediction moment (ti) and in using the temporal evolution trends of the clusters to deduce future video popularity. On a sample of YouTube videos, this method shows good performance in making short-term predictions (predict the number of views in the next day) but significantly larger ones in making long-term predictions.
Pinto et al. put forward an improvement to the
multivariate linear regression model by
Figure 3Example of three popularity evolution trends discovered by Crane and Sornette [31] (and similar with some of the trends presented by Figueiredo [45] and Gursun et al. [32]).The figure shows the average number of views over time normalized by the number of views during the peak day.
entire population and could be used to improve the prediction accuracy. More specifically, the predic-tion model, called multivariate radial basis function (MRBF), is described by the following relationship:
Nc(ti,tr)=(ti,tr)Xc(ti)+
c1∈C1
wc1RBFc1(c), (16)
where C1 ∈ C is the representative subset of videos
and wc1 is the weight associated with each item. RBF stands for the Radial Basis Function with Gaussian kernel (chapter 6 [79]) and measures the similarity between the target video and each video inC1. Training MRBF model
involves finding the optimal parametersandwc1to min-imize MRSE, setting the optimal values of RBF kernel, and finding a representative set of videos. The perfor-mance of this model shows an average improvement of 5% overmultivariate linear regressionand 20% compared to theconstant scalingmodel.
Ahmed et al. propose a model that uses a more granular description of the temporal evolution of content popu-larity [34]. Instead of using a set of representative items to describe the entire evolution of content popularity, this model selects representative members during regu-lar intervals of durationδand defines rules to model the transitions among subsequent intervals.
The representative members for each interval are computed using Affinity Propagation clustering algo-rithm [80]. To calculate the similarity between items, the authors derive two features from Xc(ti): one that compares if two items receive the same proportion of users’ attention and another one that measures if the two items experience a similar popularity growth. Once the
clusters of popularity are identified, they are grouped into a probabilistic framework used to describe the evolution of content popularity between clusters over time. Thus, by knowing to which cluster an individual item is most likely to belong at timeti, one can predict its popularity at a future moment of timetr.
The performance of the model was tested on three data sets (YouTube, Vimeo, and Digg) and shows a significant improvement over thelog-linearmodel. For example, when using the observations received in the first 24 hours to predict the popularity four hours ahead, this model shows a MRSE error of 1% for Digg and 3.5% for Vimeo and YouTube; a significant improvement compared to the log-linearmodel that shows a performance of 17% for Digg, 24.2% for Vimeo, and 29.7% for YouTube.
Individual behaviorInstead of treating each user’s reac-tion equally in the predicreac-tion process, models under this category draw conclusions based on individual user behavior.
Social dynamics, the model proposed by Lerman and Hogg, describes the temporal evolution of web con-tent popularity as a stochastic process of user behavior during a browsing session on a social media site [81]. In its original form, the model is designed according to the char-acteristics of the social bookmarking site Digg: stories can be found in three sections of the site (front, upcoming, and friend list pages), users can express their opinions through votes, and stories are arranged in pages or promoted to different sections of the site based on the dynamics of votes.
stories circulate through the site (i.e., they may appear on different sections of the site or change position on the page) depending on the voting results. Individual user behavior is thus linked to the collective behav-ior, which in the end explains how stories receive votes over time. More specifically, the number of votes a story receives depends on its visibility and general inter-est. Visibility is expressed as the probability of finding a story in different sections of the site and interest is linked to the quality of the story estimated by the voting dynamics.
The authors validate the model on a small sample of Digg stories by studying user’ reactions to the publication of stories and by taking into account the online connec-tions created between Digg users. By using this algorithm, the authors reveal that they can predict in 95% of the cases which stories will become popular enough to reach Digg’s front page.
For platforms that allow users to cast positive and neg-ative votes on the content, Yin et al. proposeConformer Maverick, a model used to predict content popular-ity based on users’ voting profiles [67]. The underlying assumption of the model is that, in the voting process, users can have two behaviors: obey the general users’ opinion (the “conformers”) or be against them (the “mav-ericks”). The profile of a user is in-between these two extremes but in general one trait prevails.
The first step is to build user profiles based on the vot-ing history by comparvot-ing individual votes with the overall appreciation of the content, i.e., if the majority of votes is positive or negative. These profiles are later used to decide if an item will become popular by analyzing early user votes. Receiving positive votes from conformers and neg-ative ones from mavericks is then considered as a good indication that an item will be appreciated by the majority. Using data from a joke sharing application the algorithm shows a better performance than a collaborative filtering solution.
Zaman et al. propose a probabilistic model based on Bayesian inference to predict the popularity of Twit-ter messages [64]. The predictive features are content-agnostic and based on retweets time-series and the social connectivity graph of the Twitter users. The model is based on the assumption that Twitter users have sim-ilar actions with regard to the post of a tweet that creates a pattern in the evolution of tweets popular-ity. In particular, the probability of a (re)tweet to be retweeted depends on the number of followers and the distance from the user that originally generated the tweet. Using a small data set of 52 tweets, the method shows a good performance (given the difficulty of the task), with an average MRE error of 40% using the retweeting information received in the first five minutes after the publication.
7.2 Cross domain
The second major category of methods is used to predict web content popularity using information from multiple web domains: extract data from one domain (e.g., social media) and transform it into knowledge to predict web content popularity in another domain (e.g., the site where content was published). Currently, only methods that pre-dict content popularity after publication based on the aggregate behaviorhave been proposed.
Oghina et al. use data from Twitter and YouTube to predict movie ratings on IMDb [36]. By training a lin-ear regression model on several textual features extracted from Twitter and various statistics from YouTube (likes, dislikes, and comments) the authors show that they can accurately predict movie ratings on IMDb. The authors indicate that the best performance is obtained by combining the ratio of likes over dislikes from YouTube activity with the subjective terms (positive and negative unigrams about the movies) extracted from Twitter.
The algorithm proposed by Roy et al., Social Transfer, extracts information from Twitter to detect videos that will experience sudden bursts of popular-ity on YouTube [35]. The model consists of the follow-ing steps: extract popular topics from Twitter, associate these topics to YouTube videos, and compare the pop-ularity of videos on Twitter with their poppop-ularity on YouTube. A disproportionate share of attention on Twit-ter compared to YouTube is then used as strong evi-dence that a video will experience a sudden burst of popularity.
Topics are learned by analyzing Twitter stream, extract-ing topical words, and findextract-ing topics from words with semantic similarity. Each topic has a certain popularity on Twitter based on its prevalence in the Twitter stream and the time it first appeared. The algorithm uses the Social Transfer framework [82] to map videos – using only the textual information from the title and video description – to topics extracted from Twitter. The popularity of a video on Twitter, expressed by the popularity of its topic, is then compared to its popularity on YouTube (represented by number of views) and, if the difference is significant, the video is considered susceptible to receive a sudden burst of attention.
Using data from YouTube and Twitter, and by train-ing a support vector machine classifier, the algorithm shows that it can predict with 70% accuracy which videos will experience a significant increase in popularity on a daily basis. This strategy shows an improvement of almost 60% compared to a model that uses only the information available on YouTube.
page views on a news site [14]. The statistical method used for this task is amultiple linear regressionthat uses as input the following variables: number of Facebook shares, number of tweets and retweets, entropy of tweet vocabulary, and the mean number of followers sharing the articles on Twitter. Using a collection of Al Jazeera news stories, the authors show that a model based on the social media signals received in the first ten minutes after publication achieves the same performance as one based on the number of page views received in the first three hours.
The effectiveness of cross-domain prediction methods indicate that, when information related to a web content is spread across multiple web sites, aggregating information from multiple sources can significantly improve the pre-diction accuracy. In particular, the information extracted from Twitter proved very useful in learning more accu-rate prediction models. The benefit of using social streams as an additional source of information can be explained by the fact that sharing is one of the most popular meth-ods to reach information on the Internet. And, as sharing rarely happens inside the originating web domain, this information provides an additional – and more reac-tive – perspecreac-tive about the actual popularity of a web content.
8 What makes web content popular?
The magic formula of what makes a web content pop-ular is still unknown but some of the ingredients have been discovered. The content of a web item (e.g., the topic, message, or quality) plays a major role in its future success [83], but there are other elements (e.g., dis-semination factors, promotion, or social influence) that have a significant contribution. Identifying the factors that impact content popularity is important in build-ing more accurate prediction models by understandbuild-ing which are the significant variables (i.e., variables that show a causal relationship) that should be used in a model or in finding alternative proxy variables when the orig-inal variable is difficult to measure. In this section we present the factors known to have a strong impact on web content popularity and we indicate in Section 9 which variables have already been used in a prediction model.
Content matters in the amount of attention that a web item will receive. Emotion is one of the most important drivers for online audience. Videos, evoking strong and mostly positive emotions, are more likely to be shared within online communities [84]. Similarly, content that generates high-arousal emotions (e.g., awe, anxiety) dis-seminates faster on the Internet and captures a larger amount of users’ interest [85,86]. The quality of the con-tent [87,88] and its geographic relevance [89,90] are also
positively correlated with content popularity. The topic of the content is also important as content popularity is susceptible to bursts of attention in response to real-world events [91]. On the other hand, there are elements that have a negative impact on content popularity. One of them is the presence of multiple versions of the same con-tent that tends to limit the popularity of each individual copy [28].
There are also several content-agnostic factors that have a strong impact on the popularity growth [92]. Popular Internet services, such as search tools, recommendation systems, and social sharing applications can extent web content visibility and increase its popularity. Taking the example of YouTube, the internal search engine accounts for most of the views, followed by the recommenda-tion systems and the social sharing tools [12,92]. But the outcome of these services also play an important role in how popular a web content will become. For exam-ple, it has been observed that videos acquire a greater number of views if they are recommended in the related list of other popular videos [15,93] and the higher the position of a video in the list the greater the number of views [94]. The recommendation system thus creates a strong linked structure between similar videos, which influence each other in terms of popularity [95]. This information can be extremely valuable to newborn videos that can have a greater chance of becoming popular if they manage to create links – by choosing a relevant title, description, or keyword set – with similar popular videos.
Social sharing acts as an additional catalyst of user attention. Diffusing videos through social networks, blogs, or e-mail services generates peaks of attention during short periods of time [70]. Similarly, the social connec-tions created within a site play an important role in how popular a web content will become. For example, it has been observed that in the early stages after the publica-tion of a web content the greater the social network of the publisher the greater the increase in content popu-larity. Finally, social influence can have a non-negligible consequence on the popularity growth. A study conducted by Salganik et al. reveals that, when users are informed about the collective decisions of other individuals, the popularity of songs are driven by a “rich-get-richer” effect [87].
9 Predictive features
features used in the prediction models and report their predictive performance.
Characteristics of content creators. The online media ecosystem is populated by content creators (indepen-dent producers, professional bloggers, mainstream mass media, or news agencies) with different but relatively sta-ble – and maybe predictasta-ble – audience. Including the identity of the content creator in a prediction model is exploited by Bandari et al. who notice that the pub-lisher of a news article is one of the strongest predic-tor of the number of tweets that a news article will generate [72].
Textual features.Certain words or key phrases that prob-ably refer to hot or controversial topics often produce a significant amount of attention. There have been two efforts to include textual features in a prediction model. Tsagkias et al. extract the top-100 most discriminative terms from various news sources and observe that these terms have a strong performance in predicting which arti-cles will be highly commented [71]. Similarly, Marujo et al. show that popular key-phrases have a strong predic-tive power in predicting the number of views for news articles [96].
Content category. Designing specialized prediction
models depending on the category of the content showed little benefit in predicting the popularity of videos [33] and new articles [72,96]. The only notable exceptions have been signaled for YouTube Music videos [33] and news articles related toTechnologysection [72]. The low predic-tive performance of using this information in a prediction model can be explained by the overlapping scope of cate-gories, with content often belonging to multiple categories at once [28,72].
Named entity identification.Popular entities in the real world (people, locations, or organizations) can often be a catalyst of user attention in the online sphere. Tsagkias et al. observe a strong impact in including popular enti-ties from Netherlands in a prediction model designed to spot news articles that will receive a high number of comments [71].
Sentiment analysis.The specific emotion triggered by a web content is highly correlated with its online popular-ity [86] but extracting the correct sentiment and learning how to use this information for popularity prediction is a difficult task. The subjectivity of the language has shown little predictive power in predicting the volume of tweets for online news stories [72]. However, it has been observed that articles that are written in a more positive or negative voice, associated with strong emotions (e.g., admiration or anger), are good indicators of how viral arti-cles will become [85]. In addition, Oghina et al. observe that subjective terms from the discussions about movies on Twitter can successfully be used as a predictive variable in predicting movie ratings on IMDb [36].
Social media signals. As we saw in Section 7.2, social media conveys valuable information about web content popularity. Castillo et al. show that the attention that news articles generate across social networks (number of Facebook shares, number of tweets and retweets, the language of the Twitter messages) is effective in predict-ing the popularity of articles on a news site [14]. Oghina et al. successfully use information from Twitter and YouTube to predict movie ratings on IMDb. Another example of the predictive power of social media has been reported by Roy et al. who show that the popu-larity of a topic on Twitter provides a good indication that a YouTube video will experience a sudden burst in popularity [35].
Social sharing viewing behavior. Yahoo! Zync is an
application that allows users to share and jointly manipu-late video content in real time. Shamma et al. study how users’ actions during a sharing session can be used to pre-dict the popularity of YouTube videos and observe that these interactions are strong indicators of videos with a high number of views [66].
Real-world features.Content published in online media is strongly related to real-world events but transferring information from the physical to the online world is very challenging. An attempt to employ real-world informa-tion in the predicinforma-tions process has been done by Tsagkias et al. who show that there is an insignificant benefit in using the weather conditions (average temperature in Netherlands) to predict the number of comments for news articles [71].
10 Shaping the future: Applications of web content popularity prediction
In the modern information age accurate popularity predictions can prove valuable to different actors: online users can filter more easily the huge amount of informa-tion; content producers and content providers can better organize their information and build more effective deliv-ery platforms; and advertising networks can design more sophisticated and profitable advertising strategies. How-ever, predicting the popularity of web content, as useful as it seems, has been employed in few real-world appli-cations. We review the current practical uses of these methods and propose new applications that could benefit from this research area.
significantly increase the number of clicks for Yahoo! news articles if, instead of using human editors to select and arrange the articles, one uses automatic selection algo-rithms that measure users’ interest in news articles [97]. In this context, accurate popularity predictions, used to highlight and recommend articles, can improve user expe-rience and boost the site’s traffic. Moreover, by moni-toring and reacting to social media signals, editors can increase the traffic through social media optimization solutions [11]. Currently, to the best of our knowledge, there have been no online evaluations of how the pre-diction methods described in this survey could be used to increase the traffic on a web site. In an offline set-ting Marujo et al. show good performance in predicset-ting the number of clicks that news articles will receive dur-ing one hour [96]. Still in an offline evaluation mode, Tatar et al. explore the efficiency of two popularity pre-diction methods to rank news articles based on the future number of comments and show that the log-linear model could be an effective method for this ranking problem [73]. It is also important to understand how users react to information about the predicted popu-larity. Even if web content shows a mild resilience to self-fulfilling prophecies [98] the prediction outcome can become a strong form of social influence that inflates or dampens the success of a web item. One solution to this problem is to create a feedback loop to listen to users’ reactions and adjust the decisions depending on how the audience is responding to the prediction outcome.
Information about the future amount of interest that web content will generate can also be valuable in online advertising as an alternative to existing contextual ad placement models [99]. The possibility to quickly spot the future popular items on the Internet creates the opportu-nity of additional profits for advertising agencies. Popu-larity prediction methods can also be used in the context of online marketing. For example, suppose that a com-pany initiates a marketing campaign on social media with the goal of reaching a certain number of online users. To measure the success of a campaign one possible strategy is to wait until the interest in web content fades away. A more useful solution would be to monitor and pre-dict in real-time the amount of interest that a certain post will generate and decide more quickly if additional publications would be needed [60].
Faced with an ever increasing traffic demand, content providers and content delivery networks set large-scale caching infrastructures to distribute copies of the web content across multiple locations. Optimal placement of replicas [100] – in terms of location and number of copies under bandwidth and storage constraints – depend on how accurate one can predict the future users’ demand: which content will be popular [70], its geographic
locality of interest [89], and the amount of attention that it will generate.
Cache replacement policies (i.e., decide on which item to evict from a cache when there is no available space) remain an important issue for the performance of a proxy cache. Traditional cache replacement algorithms use the historical information about content requests to decide which item to keep in the cache to maximize a certain performance metric (e.g., hit rate, the amount of saved bandwidth) [101]. Two of the most used replacement policies, even nowadays, are LFU (prioritize the most requested item) and LRU (prioritize the most recently requested item). One way to improve the efficiency of cache replacement algorithms is to actually integrate popularity prediction methods in the cache replacement decision. Famaey et al. propose P-LFU, an adaptation of LFU that determines which content to evict from the cache based on the predicted future demand [102]. Four generic functions (linear, power-law, exponential, and Gaussian) have been used to predict future content demand with the exponential distribution showing the most accurate results. Using a workload trace from a Video-on-Demand service the authors show that popu-larity prediction methods can increase the cache hit-rate with up to 10% compared with LFU cache replacement strategy.
Another domain where popularity prediction can prove valuable is mobile data offloading. Under the increas-ing consumption of mobile data traffic, telecom operators look for new solutions to reduce the traffic from cellu-lar networks. Opportunistic networks have recently been proposed as an appealing solution to offload content with non-real time constrains, where, instead of using the cel-lular network infrastructure, mobile users can retrieve content from collocated peers [103].
mechanism for information spreading and by learning the social structures created by users one can understand the patterns of information diffusion [7,104] which further gives one the ability to predict when a user will be inter-ested in a certain content. This type of approach has been proposed by Malandrino et al. that show that, by predict-ing information cascades, mobile users’ requests can be treated in advance which can lead to a reduction of up to 50% of the cellular data traffic during periods of high data traffic loads [105].
Major Web search engines such as Google, Yahoo!, and Bing are always looking for new ranking factors to improve the relevancy of their search results. Over the years, search algorithms have become extremely sophis-ticated including hundreds of ranking factors based on the content of a web page or its importance in the Web graph. But even these complex algorithms may sometimes fail to retrieve the relevant information. For example, when searching for relevant information in the Blogosphere, Gonçalves et al. observe that commercial search engines (UOL, Yahoo!, and Google) failed to cor-rectly retrieve an important percent of the relevant blogs on the first page of the results [106]. In the same study the authors show that the results of the query can signif-icantly improve by including the popularity of the blog in the search algorithm. A search engine that includes the collective users’ opinion about web content in its algorithm – if one has access to the different popu-larity statistics – is probably the future evolution of search engines [107,108]. Predicting web content popular-ity could fit well in this context as the outcome of a search query could prioritize future popular web content over expired one.
11 Summary and outlook
In this article we reviewed the current state-of-the-art on web content popularity prediction methods. We pre-sented the different prediction methods, reported their performance, and suggested several applications that can benefit from these findings.
Even if research on predicting the popularity of web content has been an active area in the latest years there are many avenues that wait to be explored. We suggest some possible directions for the future work.
Predicting long-term popularity evolution. Most of the previous studies address the problem of predicting the exact amount of attention that a web content will receive up to a future moment in time. While this is useful for timely detections of popular items, a greater impact would come from a long-term evolution forecast [34,45] (i.e., to predict how content popularity evolves over time). Know-ing this can reveal how content progresses through the different stages of popularity: initial growth, peak period,
decline, and even popularity rebounds. This information can help online advertisers or content delivery networks in making more profitable decisions, focusing on a content during its popularity peak and wasting fewer resources on expired items.
Building richer models. In addition to early popularity measures, several studies analyzed the predictive power of various features. We believe that this direction has not been fully explored and further work is needed in finding more powerful predictive features. For example, except for Bandari et al. that use the identity of the pub-lisher in the prediction model [72], to our knowledge no other work has studied the predictive power of a con-tent publisher. Yet news columnists and video publishers attract a significant and maybe predictable audience on their own.
The topic of the web content plays an important role in its future popularity. The daily agenda of discus-sions on the Internet and mainstream media is centered on major topics with limited and different life cycles. Thus, capturing trending topics and learning how to include them in prediction models can lead to a major breakthrough in the prediction accuracy. Research in this field has made important advances in the recent years. Leskovec et al. show that the attention that online users pay to certain topics can accurately be described by six time-series shapes [109]. Similarly, Nikolov et al. propose an algorithm that can accurately predict the trending topics on Twitter earlier (with an aver-age of 1.43 hours) than the internal algorithm used by Twitter [110].
For web content characterized by a very short lifecycle it has been observed that timely predictions present a real challenge. For example, news articles quickly become pop-ular and "die-out" within hours. One way to improve the predictability of news would be to extract recurrent events over time, observe the level of interest that they gener-ate, and predict when these future events will take place. Predicting global events in various fields (e.g., economy, seismology, society), as challenging as it may seem, is nev-ertheless plausible. Radinsky et al. propose two algorithms for this prediction task: PROFET, an algorithm that pre-dicts the terms used in the future news stories based on the historical web query patterns [111]; and Pandit, a sys-tem that can predict future events given an existing news event [112].
![Figure 3 Example of three popularity evolution trends discovered by Crane and Sornette [31] (and similar with some of the trendspresented by Figueiredo [45] and Gursun et al](https://thumb-us.123doks.com/thumbv2/123dok_us/860375.1583576/11.595.59.539.86.240/figure-example-popularity-evolution-discovered-sornette-trendspresented-figueiredo.webp)