Breakdown in Complex Networks
Liang Zhao
1, Kwangho Park
2, Ying-Cheng Lai
2& Thiago Henrique Cupertino
11Institute of Mathematics and Computer Science University of São Paulo
Av. Trabalhador São-Carlense, 400 Phone: +55 (16) 33739713
FAX: +55 (16) 33739751
P.O.Box: 668, Zip 13560-970 - São Carlos - SP - BRAZIL [email protected] and [email protected]
2Department of Electrical Engineering Arizona State University Tempe, Arizona 85287, USA
Abstract
The possibility that a complex network can be brought down by attack on asingleor very few nodes through the process of cascading failures is of significant concern. In this paper, we investigate cascading failures in complex networks and uncover a phase-transition phenomenon in terms of the key parameter characterizing the node capac-ity. For parameter value below the phase-transition point, cascading failures can cause the network to disintegrate almost entirely. Then we show how to design networks of finite capacity that are safe against cascading breakdown. Our theory yields estimates for the maximally achievable network integrity via controlled removal of a small set of low-degree nodes.
Keywords: complex networks, scale-free networks, power grids, computer networks, degree distribution, cas-cading breakdown.
1. INTRODUCTION
Complex networks arise in natural systems and they are also an essential part of modern society. Many real complex networks, such as the World Wide Web (WWW), the Internet, and some electrical power grids, were found to be heterogeneous with power-law degree distribution [1, 2, 3, 4, 5, 6, 7] which means that the prob-ability for a subset of nodes to possess a large number of links is not exponentially small, in contrast to random
net-works. Because of the ubiquity of scale-free networks in natural and man-made systems, the security of these net-works, i.e., how failures or attacks affect the integrity and operation of the networks, has been of great interest.
a consequence, a large fraction of the network can be shut-down.
There have been many studies on cascading failures in engineering networks (for a brief review, see Sect. 3). In Ref. [8], a simple mechanism was proposed to incor-porate the dynamics of load in complex networks. The model, which is referred toML model, generates results that are consistent with the above intuition on cascading failures. For instance, it was demonstrated that random networks are robust against cascading breakdown but they can be easily triggered by intentional attacks in scale-free networks. The existing results are, however, largely de-scriptive and qualitative. The purpose of this work is to address theoretically and numerically the fundamen-tal mechanism of cascading breakdown. In this work, we study cascading failures in complex networks with focus on scale-free networks by using the ML model. Our find-ing is that cascadfind-ing breakdown in scale-free networks can be understood in terms of a phase transition. In par-ticular, letαbe the tolerance parameter characterizing the capacity of nodes in the network. Cascading breakdown due to attack on a single node is possible only when α
is below a critical value αc. By making use of the
de-gree distribution of scale-free networks and the concept of betweenness [9] to characterize the load distribution, we are able to derive a theoretical formula for estimating the phase-transition pointαc, which is verified by
numer-ical experiments. In terms of practnumer-ical utility, our result enables a possible implementation of predicting and pre-venting mechanism for cascading breakdown in scale-free networks.
The rest of this paper is organized as follows. In Sect. 2, a brief review on complex network models is given. In Sect. 3, we discuss cascading failure in engineering and computer networks. Sect. 4 is devoted to analyze cascad-ing failure in complex networks with focus on scale-free networks. Sect. 5 is devoted to describe and analyze the protection mechanism for scale-free networks against cas-cading breakdown. Finally, Sect. 6 concludes the paper.
2. COMPLEX NETWORK MODELS
In recent years, many complex network models have been discovered or developed. Here, we briefly review some some classical models, such as Random Graphs, Small-World Networks and Scale-Free Networks, and some newly developed models, such asLayered Networks andCo-evolution Networks.
The systematic study of random graphs was initiated by Erdös and Rényi [10]. The term random graph refers to the disordered nature of the arrangement of links between different nodes. In their article, Erdös and Rényi proposed a model to generate random graphs withNnodes andK
links, that we will henceforth call Erdos and Renyi (ER) Random Graphs. The model for ER random graphs con-sists in connecting each couple of nodes with a proba-bility 0 < p < 1. ER random graphs are one of the best studied among graph models, although they do not reproduce most of the properties of real networks. The great discovery of Erdös and Rényi was that many impor-tant properties of random graphs appear quite suddenly. That is, at a given probability either almost every graph has some property Q or, conversely, almost no graph has it. For many such properties there is a critical probabil-ity pc(N). Ifp(N) grows more slowly than pc(N)as N → ∞, then almost every graph with connection prob-ability p(N)fails to haveQ. Ifp(N)grows somewhat faster thanpc(N), then almost every graph has the
prop-ertyQ, i.e.,
lim
N→∞PN,p(Q) =
0 if pp(N)
c(N) →0
1 if pp(N)
c(N)→ ∞
A few important special cases are:
1. The critical probability of having a tree of orderkif
pc(N) =cN−k−k1;
2. The critical probability of having a cycle of orderk
ifpc(N) =cN−1;
3. The critical probability of having a complete sub-graph of orderkifpc(N) =cN−k−21.
Since all the nodes in a random graph are statistically equivalent, each of them has the same distribution, and the probability that a node chosen uniformly at random has degreekhas the same form asP(ki =k). For large N, and fixed average degreek, the degree distribution is well approximated by a Poisson distribution:
P(k) =e−kk k
k!
For this reason, ER graphs are sometimes called Poisson random graphs. Figure 1 shows the degree distribution of an ER graph. The network is generated by the method shown in [11].
Real networks are rarely pure random networks. The study of several dynamical processes over real networks has pointed out the existence of shortcuts, i.e. bridging links that connect different areas of the networks, thus speeding up the communication among distant nodes, which is called Small-World effect. The small-world property in real networks is often associated with the pres-ence of clustering, denoted by high values of the cluster-ing coefficientin a networkG, defined by
C= 3×number of triangles in G
number of connected triples of vertices in G
some classical models, such as
0 5 10 15 20 25 0
0.05 0.1 0.15 0.2
k
P(k)
Figure 1. Degree distribution of a random network. The number of nodesN= 20000and average degreek= 10.
10−4 10−3 10−2 10−1 100
0 0.2 0.4 0.6 0.8 1
p
L
C
Figure 2. The average length of shortest pathsLand clustering coefficientCin relation top. The number of nodesN= 20000and
average degreek= 4.
For this reason, Watts and Strogatz, in their seminal pa-per [11], have proposed to define small-world networks as those networks having both a small value of average shortest path length L, like random graphs, and a high clustering coefficientC, like regular lattices. Clustering, also known as transitivity, is a typical property of acquain-tance networks, where two individuals with a common friend are likely to know each other. Figure 2 shows the the average length of shortest pathsLand clustering coef-ficientCby randomly changing a fractionpof links start-ing with a regular network. We see that the small-world effect occurs when pis small, for example, p = 0.01. Here, the networks are again generated by the model pre-sented in [11].
Until a few years ago, network study are focalized on homogeneous networks. Homogeneity means that almost all nodes are topologically equivalent, like in regular lat-tices or in random graphs. In contrast with all the ex-pectancies, when the scientists approached the study of
100 101 102 103
10−5 10−4 10−3 10−2 10−1 100
k
P(k)
Figure 3. Degree distribution of a scale-free network. The number of nodesN= 20000and average degreek= 4.
real networks from the available databases, it was found that most of the real networks were found to be hetero-geneous with power-law degree distribution [1]: P(k)∼ k−γ, wherekis the number of links of a randomly cho-sen node in the network andγis the scaling exponent (see Fig. 3). The scale-free network is generated by using the standard Barabási-Albert model [1]. This power-law dis-tribution means that the probability for a subset of nodes to possess a large number of links is not exponentially small, in contrast to random networks. Mathematically, the power-law distribution means that statistical moments of the degree variable are generally not defined, hence the name ofScale-Free Networks. Examples range from the Internet, WWW, protein-protein interaction networks, some power grids, telecommunication networks, traffic flow to social networks [2, 3, 4, 5, 6, 7])
In the study of scientific collaboration networks, New-man [9] found that the degree distribution of such net-works do not follow a power-law form perfectly. How-ever, the data are well fitted by a power-law form with an exponential cutoff:
P(k)∼k−τe−κk
whereτandκare constants. This form is commonly seen in physical systems, and implies an underlying degree dis-tribution which follows a power-law, but with some im-posed constraint that places a limit on the maximum value ofk. This kind of networks is calledScale-Free with Ex-ponential Cutoff.
Many complex networks are only a part of larger sys-tems, where a number of coexisting topologies interact and depend on each other. In Ref. [12], the authors stud-ied the load distribution in three transportation systems, where the lower layer is the physical infrastructure and the upper layer represents the traffic flows, which is called Layered Complex Networks. The layered view allow us to capture different features of the same system. For in-average length of shortest paths L and the clustering coefL
Until a few years ago, network study was focalized on
flow in social networks
posed constraints that place a limit on the maximum value of k. This kind of networks is called Scale-Free with
with Exponential Cutoff.k. Scale-Free
stance, the topologies of the Internet at the IP layer, of the World Wide Web (WWW), or of the networks formed by peer to peer (P2P) applications. Each WWW or P2P link virtually connects two IP nodes. These two IP nodes are usually distant in the underlying IP topology, and the vir-tual connection is realized as a path found by IP routers. In other words, the graph formed by an application is mapped on the underlying IP network.
In Ref. [13], the authors introduced a co-evolution networks, calledTARL Model(for topics, aging, and re-cursive linking) that simultaneously grows coauthor and paper citation networks. The statistical and dynamic properties of the networks generated by this model are validated against a 20-year data set of articles published in PNAS. Systematic deviations from a power law distri-bution of citations to papers are well fit by a model that incorporates a partitioning of authors and papers into top-ics, a bias for authors to cite recent papers, and a tendency for authors to cite papers cited by papers that they have read.
3. CASCADING FAILURE IN ENGINEER
-ING AND COMPUTER NETWORKSCascading failures can occur in many physical sys-tems. In a power transmission grid, for instance, each node (a generator) deals with a load of power. Removal of nodes in general can cause redistribution of loads over all the network, which can trigger a cascade of overloading failures. The recent massive power blackout caused by a series of seemingly unrelated events on August 14, 2003 in the northeastern United States and Canada seemed to have the characteristics of cascading breakdown.
Many studies have been performed on cascading fail-ure in power transmission systems. Some recent results are briefly reviewed here. DeMarco studied cascading failure due to dynamic transients in bistable systems rep-resented by nonlinear differential equations [14]. Carreras et. al. [15] represented cascading failure in a power sys-tem model using the DC load flow approximation and standard linear programming optimization of the gener-ation dispatch. The model shows critical point behavior as load is increased and can show power tails similar to those observed in blackout data. Rios et. al. [16] pro-posed a method based on Monte Carlo simulation can be enhanced to take into account time-dependent phenom-ena such a cascade tripping of elements due to overloads, malfunction of the protection system, and potential power system instabilities. In [17], the authors proposed risk in-dices for power systems, referred to online risk-based se-curity assessment, which provide the ability to compute online probabilistic risk associated with conditions up to several hours in the future, as well as monitoring
over-load and cascading overover-load of networks. In [18], the authors studied a 15-year time series in the North Amer-ican power transmission grid. They calculated long time correlations and probability distribution functions for sev-eral measurements of blackout size which shows the sand-pile phenomenon, known as Self-Organized Criticality (SOC). Dobson et. al. [19] proposed an analytically tractable model of loading-dependent cascading failure that captures some of the salient features of large black-outs of electric power transmission systems. A critical loading is revealed at which there is a power-law region in the distribution of number of components failed and a sharp increase in the gradient of the mean number of components failed.
Another example of cascading failure is the Internet, where the load represents data packets a node (router) is requested to transmit and overloading corresponds to gestion [20]. The rerouting of data packets from a con-gested router to another may spread the congestion to a large fraction of the network. With the possibility of cas-cading failures, a realistic concern is attacks on complex networks. In particular, for a scale-free network, major-ity of the nodes deal with small amount of load, so the probability for a node with a large amount of load to fail randomly is small. This, of course, will not be the case of intentional attacks that usually target one or a few of the most heavily linked nodes. The work by Albert et al. [21] demonstrated that scale-free networks possess the robust-yet-fragile property, in the sense that they are robust against random failures of nodes but fragile to in-tentional attacks. Cohen et. al. [22, 23] studied inter-net breakdown by random failure and intentional attack. In their works, a scale-free network can become disinte-grated under attacks on a small but still appreciable set of nodes that include a substantial fraction of links in the network. Attack on a single or very few nodes will in general not bring down the network. This result was ac-tually obtained based purely on the scale-free architecture of the network. In other words, dynamics in the network, i.e., how information or load is distributed in the network, was not taken into account.
According to Dobson et. al. [19], cascading process in power grids consists of the following essential com-ponents: components that fail when their load exceeds a threshold, an initial disturbance loading of the system, and the additional loading of components by the failure of other components. In the ML model [8], the load dynamic is represented by betweenness of the node (total number of shortest paths passing through the node). In fact, sev-eral papers have used betweenness as a measure for the vertex load in dynamical communications systems (see, for example, [25]). When an attack or random failure oc-curs, some nodes are removed from the network. This effect can cause redistribution of loads over all the net-bution of citations to papers are well fitted by a model
that incorporates a partitioning of authors and papers into topics, a bias for authors to cite recent papers, and a ten-dency for authors to cite papers cited by papers that they have read.
eral measurements of blackout size which show the
sand-based on Monte Carlo simulation and taking into account time-dependent phenomena such a cascade tripping of elements due to overloads,
work and it is possible that for some nodes, the new load exceeds their designed capacities. These nodes will then fail, causing further redistributions of load, and so on. As a consequence, a large fraction of the network can be shut-down, a cascade of overloading failures. One can see that the ML model captures the essential components of cas-cading process. Moreover, it takes into account the net-work architecture by means of betweenness, which allow us to study cascading failure in different network topol-ogy (such as scale-free networks) and by different origins (attack or random failure). This is an important feature since many real networks, including the Internet, WWW and some power grids are scale-free networks.
4. CASCADING FAILURE IN THE
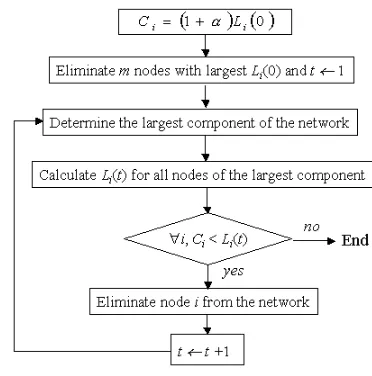
ML
MODELIn the ML model [8, 26, 27, 28], the load (or between-ness) at a nodeiis defined as the total number of shortest paths passing through this node. The capacity of a node is the maximum load that the node can handle. In man-made networks, the capacity is severely limited by cost. Thus, it is natural to assume that the capacityCiof node iis proportional to its initial loadLi(0),
Ci= (1 +α)Li(0) =λLi(0), (1)
where the constantα≥0(orλ≥1) is the tolerance pa-rameter,iis the node index, and(0)represents the process is at time0(before attack).
Specifically, the cascading process can be described by the algorithm shown by Fig. 4. When all nodes are on, the network operates in a free flow state insofar asα≥0. But, the removal of nodes in general changes the distribu-tion of shortest paths. The load at a particular node can then change. If it increases and becomes larger than the capacity, the node fails. Any failure leads to a new dis-tribution of load and, as a result, subsequent failures can occur. The failures can stop without affecting too much the connectivity of the network but they can also propa-gate and shutdown a considerable fraction of the whole network.
Cascading failures can be conveniently quantified by the relative size of the largest connected component
G= N
N, (2)
whereN andN are the numbers of nodes in the largest component before and after the cascade, respectively. Thus, we have0 ≤G≤1. The integrity of the network is maintained ifG≈1, while breakdown (cascading fail-ure) occurs ifG≈0. IfGis far from both 0 and 1, the phenomenon is referred to partial failure.
To gain a qualitative view of cascading failure, we first provide some computer simulation results. We generate
Figure 4. Algorithmic description of cascading process in the ML model.
scale-free networks by using the standard Barabási-Albert model [1]. The shortest paths and the loadLi are
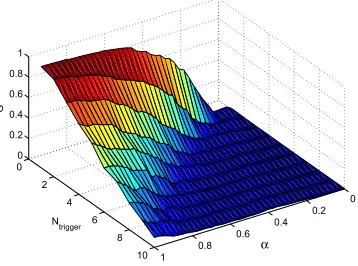
com-puted by using the algorithm developed by Newman [29]. Figure 5 showsGversus bothαandNtrigger for
scale-free networks under attack, whereNtriggerrepresents the
number of nodes that an attack targets. Here the removed nodes are those with the highest numbers of links. Note that the number of targeted nodes, while more than one, is still far small compared with the total number of nodes in the network. Practically, this means that, even if the net-work is designed to have a high tolerance by stipulating high capacities for its nodes, cascading failures triggered by attack on a very small subset of nodes are capable of bringing down the entire network. Partial failures can be observed too in the figure. Figure 6 showsGversus both
αandNtriggerfor random networks under attack. Due to
the less of hubs (nodes with large number of links), ran-dom networks can be disintegrated only whenαis small or (and)Ntrigger is large. Thus, cascading process
un-der attack can bring much more serious consequence for scale-free networks than for random networks.
Figure 7 shows the random failure case for scale-free networks. Random failure means that m randomly se-lected nodes are removed from the network at the be-ginning of cascading process. In a scale-free network, a small portion of nodes has high degree, while a large por-tion of nodes has low degree. Thus, with high probability, a randomly selected node is low degree, usually having a low value of betweenness. Intuitively, there will be lit-tle effect on the network because the amount of load that needs to be redistributed is small. This point is confirmed by the simulation result shown by Fig. 7 whereG ∼ 1
even ifαis small andNtriggeris large.
0 0.2 0.4 0.6 0.8 1 0
2
4
6
8
10 0
0.2 0.4 0.6 0.8 1
α
Ntrigger
G
Figure 5. For a scale-free network ofN= 2000nodes under attack targeting multiple nodes,GversusαandNtrigger, the number of
targeted nodes. For each parameter value,Gis averaged over30 realizations.
0 0.2
0.4 0.6
0.8 1
0 2 4 6 8
100
0.2 0.4 0.6 0.8 1
α
Ntrigger
G
Figure 6. For a random network ofN= 2000nodes under attack targeting multiple nodes,GversusαandNtrigger. For each
parameter value,Gis averaged over30realizations.
0
0.2 0.4
0.6 0.8
1
0 10 20 30
0 0.2 0.4 0.6 0.8 1
α N
trigger
G
Figure 7. For a scale-free network ofN= 2000nodes under random failure,GversusαandNtrigger. For each parameter value,Gis
averaged over20realizations.
and the situation where cascading failures are caused by attack on the node with the largest number of links and the failures lead to immediate breakdown of the network. That is,Gbecomes close to zero after one redistribution of the load. For a node in the network, its load is a func-tion of the degree variablek. For scale-free networks, we have [26],
L(k)∼kη, (3)
whereη >0is a scaling exponent. To proceed, we write the degree distribution asP(k) =ak−γand the load dis-tribution asL(k) =bkη, whereaandbare positive con-stants. Let kmax be the largest degree in the network.
Before the attack, we have kmax
1
P(k)dk=N and (4)
kmax
1 P(k)L(k)dk=S,
whereSis the total load of the network. These two equa-tions give
a = (1−γ)N
[k1max−γ −1] and (5)
b = βS
a(1−kmax)−β,
whereβ ≡ γ−η −1. After the removal of the high-est degree node (it is only the first step of the whole cascading process), the degree and load distributions be-come P(k) = ak−γ andL(k) = bkη, respectively. Since only a small fraction of nodes are removed from the network, we expect the changes in the algebraic scal-ing exponents of these distributions to be negligible. We thus writeP(k)≈ ak−γ andL(k) ≈bkη, where the proportional constantsa andb can be calculated in the same way as foraandb. We obtaina = (1−γ)(N − 1)/[kmax1−γ −1]andb =βS/a(1−kmax)−β, whereS
is the total load of the network after the attack. For nodes withk links, the difference in load before and after the attack can be written asΔL(k) ≈ (b−b)kη = (bb − 1)L(k). Given the capacityC(k), the maximum load in-crease that the nodes can handle isC(k)−L(k) =αL(k). The nodes still function ifα > (bb −1)but they fail if
α < (bb −1). The critical valueαc of the tolerance pa-rameter is then
αc = b
b −1 (6)
≈
1−kmax−β
−1 +
kmax kmax
−β
×
S S
where the final result is obtained by using the fact
(kmax1−γ −1)/(kmax1−γ −1) ≈ 1. This is so be-cause bothkmax1−γ andkmax1−γapproach zero when
N → ∞ and γ > 1. In the limit N → ∞, we have
kmax−β ∼ 0, kmax/kmax ∼ constant, andS/S → 1,
soαc ≈0, indicating that an infinite scale-free network
cannot be brought down by a single attack ifα >0. On the other hand, for finite size network, sincek−maxβ >0,
we have αc > 0, suggesting that breakdown can occur
for α < αc. The practical usage of Eq. (6) is that it
provides a way to monitor the state of (finite) network to assess the risk of cascading breakdown. In particular, the critical valueαccan be computed in time and comparison
with the pre-designed tolerance parameter valueαcan be made. Ifαcshows a tendency of increase and approaches α, early warning can be issued to signal an immediate danger of network breakdown.
We now provide numerical support for the theoretical prediction Eq. (6). Figure 8(a) shows cascading failures when a single node with different degree is removed from the network. We see that, when a node with small de-gree is removed, theGvalue remains close to one except when αis close to zero. However, when the node with the largest degree (in this casek= 81) is removed, nearly total breakdown of the network, as represented by values of Gclose to zero, occurs when α < 0.1. The phase-transition pointαcis thus about0.1. With numerical
val-ues of kmax = 81, kmax = 60,S ≈ 1.86×10⁷ and S ≈ 1.91×10⁷, theoretically predicted value ofαc in
Eq. (6) givesαc ≈0.1, which is consistent with
numer-ics. This phase transition phenomenon seems to be robust for different sizes of network, as shown in Fig. 8(b), G
versus αfor N = 1000, N = 2000 andN = 5000, respectively.
5. PROTECTING
SCALE-FREE NET-WORKS FROM CASCADING FAILUREIn this section, we study quantitatively a mechanism of protection against cascading breakdown proposed in [27]. The method consists in removing a small set of nodes that contribute to the loads in the network but they themselves otherwise process little load. Removal of these nodes and all links connected to them will not af-fect the functioning of the network but will help enhance the load tolerance for each remaining node, thereby help-ing prevent the spread of the failure or cascadhelp-ing.
For a scale-free network, its load distribution obeys algebraic scaling with the degree variablek[26]:L(k) = bkη, whereηandbare positive constants. After removing a small fraction of low-degree nodes, the average con-nectivity of the network changes little. Moreover, the degree distribution remains to be algebraic with
approx-0 0.2 0.4 0.6 0.8 1
0 0.5 1
α
G kremoved = 81
k
removed = 55
k
removed = 40
k
removed = 10
k
removed = 3
0 0.2 0.4 0.6 0.8 1
0 0.5 1
α
G N = 1000
N = 2000 N = 5000 (a)
(b)
αc
Figure 8. Cascading failure in scale-free network in relation to the tolerance parameterα. (a) Removal of the nodes with different number of links forN= 2000. In the case of the removal of the node with the highest degree, the phase-transition point isαc≈0.1, meaning that for
α < αc, the networks disintegrate almost entirely under intentional attack on a single node. (b) Phase transitions for networks of different
sizes. The resulting data points were averaged over30realizations.
imately the same scaling exponent, which can be seen, as follows. On average, the load reduction due to the re-moval of a low-degree node is proportional to its origi-nal load. LetL(k1)andL(k2)be the average loads on nodes of degree k1 and k2, respectively. After the re-moval, the average loads areL(k1) =L(k1)−c1L(k1)
andL(k2) = L(k2)−c2L(k2), respectively, wherek1
and k2 are the new degrees. Since c1 ≈ c2, we have
L(k1)/L(k2)≈L(k1)/L(k2). Thus, the algebraic scal-ing exponent after the removal assumes approximately the same value as in the original network: η ≈ η, the net-work remains scale-free, and the load distribution can be written asL(k) =bkη ≈bkη. This property has been confirmed by our numerical simulations (to be shown be-low).
We can now determine the relation between the load distributions before and after removingρpercent of low-degree nodes. For convenience, all nodes in the net-work are labeled by integers from1 toN, while the re-moved nodes are labeled by (1−ρ)N + 1toN. The total load before the removal can be written as S =
(1−ρ)N
i=1 Li+Ni=N(1−ρ)+1Li ≡ S0+S1, where S0 is the sum of loads of the remaining nodes before the removal and S1 is the total load of the removed nodes. Because the removed nodes have relatively low degrees, we haveS0 S1 and, hence,S ≈S0 =Ni=1(1−ρ)Li. After the removal, the total load of the network isS =
N(1−ρ)
i=1 Li ≈ iN=1(1−ρ)σLi, where 0 < σ < 1 is a shifting constant. Since S = N(N −1)D ≈ N2D,
S =N(1−ρ)[N(1−ρ)−1]D ≈(1−ρ)2N2Dand
D ≈ D, whereD andD are the diameters of the net-works before and after the removal, respectively, we have
0 1 2 3 4 6 8 log 10k log 10 L(k)
0 1 2 3 4 6 8 log 10k log 10 L(k)
0 1 2 3 4 6 8 log 10k log 10 L(k)
0 1 2 3 4 6 8 log 10k log 10 L(k)
0 1 2 3 4 6 8 log 10k log 10 L(k)
0 1 2 3 4 6 8 log 10k log 10 L(k)
0% 1% 5%
10% 20% collapsed
(a) (b) (c)
(d) (e) (f)
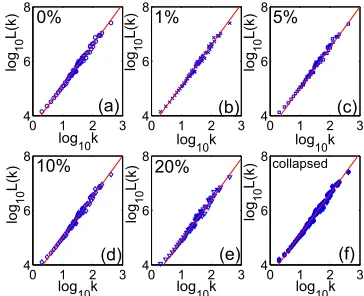
Figure 9. (a) Algebraic scaling of the load distributionL(k)for a scale-free network ofN= 10000nodes,γ= 3, andk= 4. (b-e)
Load distributions after removing1%,5%,10%, and20%of the lowest-degree nodes. (f) Rescaled plots of all curves in (a-e). The
algebraic scaling exponent isη≈1.5.
between the loads of nodeibefore and after the removal isΔLi=Li−Li ≈2ρLi, which is independent of the
parameterλ. Since, initially, the load tolerance of nodei
is(λ−1)Liand the process of removal results in
equiv-alently an extra amount of load tolerance2ρLi, the node
will not fail unless the load increment due to an attack ex-ceeds(λ−1 + 2ρ)Li. Controlled removal ofρpercent
of low-degree nodes is thus equivalent to increasing the parameterλtoλ+ 2ρin the original network:
λ≈λ+ 2ρ. (7)
We now present numerical support for our theoretical result Eq. (7). Again, we generate scale-free networks with degree exponent γ = 3 and average connectivity k = 4by using the standard Barabási-Albert model. Figure 9(a) shows the algebraic scaling of the load distri-bution of the network without any removal of nodes. Ap-proximately the same scaling behavior is observed when some small fractions of nodes with the lowest degrees are removed, as shown in Figs. 9(b-e) forρ= 1%,5%,10%, and20%, respectively. That the intentional removal of a small set of nodes does not change the algebraic load dis-tribution can be seen more clearly in Fig. 9(f), where all plots in Figs. 9(a-e), rescaled by some proper constants, apparently collapse into a single curve. In particular, the algebraic scaling exponentη remains approximately the same, regardless of the value ofρ.
Figure 10(a) showsG(λ, ρ)versusλfor different val-ues of ρ, where an attack on the node with the largest degree is assumed. In all cases, there exists a critical ca-pacityλc below which the network breaks down entirely
as a result of the attack. This value becomes smaller asρ
is increased from zero (curves shifts toward the left), in-dicating that for some fixed valueλ > λc, the network
is more robust against cascading breakdown due to the
0.4 0.6 0.8 1 1.2 1.4 1.6
0 0.5 1 λ G 0% removed 5% removed 10% removed 15% removed 20% removed
0.8 1 1.2 1.4 1.6 1.8
0 0.5 1
λ+2ρ
G/(1− ρ ) 0% removed 5% removed 10% removed 15% removed 20% removed (a) (b)
Figure 10. For a scale-free network withN= 3000, (a)G(λ, ρ) versusλfor five different values ofρand (b) properly rescaled plots
that exhibit a universal relation.
attack. This clearly illustrates the protective role played by selectively removing a small set of low-degree nodes. Figure 10(b) shows that the relation between the rescaled quantitiesG(λ, ρ)/(1−ρ)andλ+ 2ρis independent of the value ofρ, as predicted.
6. CONCLUSIONS
We investigated cascading failures triggered by at-tacks on a single or a few nodes in scale-free networks and focused on the fundamental and practically important question of whether such failures can lead to disintegra-tion of the network. Our finding is a phase-transidisintegra-tion like phenomenon in terms of the network tolerance parameter characterizing the node capacity, where the two distinct phases correspond to the situations where the network un-der attack remains largely integrated or disintegrated as a result of cascading failures.
By analyzing the dynamics of load redistribution re-sulted from selectively removing a small set of low-degree nodes, we obtained a criterion which allows the lower bound of the capacity parameter for cascade-free scale-free networks and the optimal fraction of intention-ally removed nodes to be determined.
The model we study here not only captures the es-sential components of cascading process, but also in-corporates network topology by means of betweenness. Thus, the understanding of the model certainly has pos-itive meaning for engineering and computer network de-sign and protection.
Acknowledgements
F49620-01-1-0317, by FAPESP under Grant No. 02/10707-0 and 05/55212-6 and by CNPq.
REFERENCES
[1] A.-L. Barabási e R. Albert, Emergence of scaling in random networks,Science, 286:509-512, 1999.
[2] R. Albert e A.-L. Barabási, Statistical mechanics of complex networks, Rev. Mod. Phys., 74:47-97, 2002.
[3] Newman, M. E. J., The structure and function of complex networks, SIAM Review, 45(2):167-256, 2003.
[4] R. Albert, H. Jeong, and A.-L. Barabási, Diame-ter of the World-Wide Web, Nature, 401:130-131, 1999.
[5] G. Siganos, M. Faloutsos, P. Faloutsos, and C. Faloutsos, Power Laws and the AS-Level Internet Topology, IEEE/ACM Trans. Networking, 11:514-524, 2003.
[6] X. F., Wang and G.-R. Chen, Complex Networks: Small-World, Scale-Free and Beyond,IEEE Circuit and System Magzine, First Quarter:6-20, 2003.
[7] K. Sun, Complex networks theory: A new method of research in power grid, 2005 IEEE/PES Transmis-sion and Distribution Conference and Exhibition: Asia and Pacific, pages 1-6, 2005.
[8] A. E. Motter and Y.-C. Lai, Cascade-based attacks on complex networks, Phys. Rev. E, 66:065102(1-4), 2002.
[9] M. E. J. Newman, The structure of scientific col-laboration networks, Proc. Natl. Acad. Sci. U.S.A., 98:404-409, 2001.
[10] P. Erdös e A. Rényi, On the strength of connected-ness of a random graph,Acta Math. Acad. Sci. Hun-gar., 12:261-267, 1961.
[11] D. J. Watts e S. H. Strogatz, Collective dynamics of "small-world" networks, Nature, 393:440-442, 1998.
[12] M. Kurant and P. Thiran, Layered complex net-works,Phys. Rev. Letts., 96:138701(1-4), 2006.
[13] K. Bömer, J. T. Maru and R. L. Goldstone, The si-multaneous evolution of author and paper networks, Proc. Natl. Acad. Sci. U.S.A., 101:5266-5273, 2004.
[14] C. L. DeMarco, A phase transition model for cas-cading network failure,IEEE Control Systems Mag-azine, 21:40-51, 2001.
[15] B. A. Carreras, V. E., Lynch, I. Dobson, and D. E. Newman, Critical points and transitions in an elec-tric power transmission model for cascading failure blackouts,Chaos, 12:985-994, 2002.
[16] M. A. Rios, D. S. Kirschen, D. Jayaweera, D. P. Nedic, and R. N. Allan, Value of Security: Model-ing Time-Dependent Phenomena and Weather Con-ditions, IEEE Trans. Power Systems, 17:543-548, 2002.
[17] M. Ni, J. D. McCalley, V. Vittal, and T. Tayyib, On-line Risk-Based Security Assessment,IEEE Trans. Power Systems, 18:258-265, 2003.
[18] B. A. Carreras, D. E. Newman, I. Dobson, and A. B. Poole, Evidence for Self-Organized Criticality in a Time Series of Electric Power System Blackouts, IEEE Trans. Circuit and Systems - I, 51:1733 - 1740, 2004.
[19] I. Dobson, B. A. Carreras, D. E. Newman, A loading-dependent model of probabilistic cascading failure,Probability in the Engineering and Informa-tional Sciences, 19:15-32, 2005.
[20] A. Arenas, A. Díaz-Guilera, e R. Guimerà, Com-munication in networks with hierarchical branching, Phys. Rev. Letts., 86(14), pp. 3196-3199, 2001.
[21] R. Albert, H. Jeong and A.-L. Barabási, Error and at-tack tolerance of complex networks ",Nature (Lon-don) 406:378-382, 2000.
[22] R. Cohen, K. Erez, D. b-Avraham, and S. Havlin, Resilience of the Internet to Random Breakdowns, Phys. Rev. Letts., 85:4626-4628, 2000.
[23] R. Cohen, K. Erez, D. b-Avraham, and S. Havlin, Breakdown of the Internet under Intentional Attack, Phys. Rev. Letts., 86:3682-3685, 2001.
[24] D. J., Watts, A simple model of global cascades on random networks,Proc. Natl. Acad. Sci. U.S.A., 99:5766-5771, 2002.
[25] P. Holme, Congestion and centrality in traffic flow on complex networks, Advances in Complex Sys-tems, 6:163-176, 2003.
[27] A. E. Motter, Cascade Control and Defense in Com-plex Networks, Phys. Rev. Letts., 93:098701(1-4), 2004.
[28] L. Zhao, K.-H. Park, e Y.-C. Lai, Tolerance of scale-free networks against attack-induced cas-cades,Phys. Rev. E, 72:025104(1-4), 2005.