Misallocation and manufacturing TFP
in Ecuador: formal, semi‑formal and informal
firms
Rafaela Bastidas
1,2*and Nicolás Acosta
1,3*1 Introduction
Latin American countries have shown slow economic growth and low productivity in recent decades. In this context, it is important to study productivity to implement poli-cies to boost growth and to improve economic conditions (Busso et al. 2013).
Latin America and the Caribbean (LAC) countries stagnated in per capita income compared to the USA in the last 50 years (Pagés 2010). The low economic performance can be explained to a large extent by the slow growth of productivity in the region according to multiple studies (Crespi et al. 2014; Daude and Fernández-Arias 2010; Pagés 2010).
GDP per capita growth between 1960 and 2011 was sustained by the accumulation of factors, not by the growth of aggregate TFP (Grazzi and Pietrobelli 2016). In fact, while US aggregate TFP grew by 1.2%, the TFP of the region remained stagnant in such period. The productivity of LAC compared to that of the USA decreased from 73% in 1960 to 51% in 2013. This generated a productivity gap between LAC and the USA (Grazzi and Pietrobelli 2016).
Abstract
Resource misallocation can lower the aggregate total factor productivity (TFP). We use micro-data on manufacturing establishments from the Instituto Ecuatoriano de Estadística y Censos to quantify the differences in productivity and diagnose the effi-ciency in the allocation of resources between formal and informal firms in the Ecuado-rian in the manufacturing sector. We use the model proposed by Hsieh and Klenow (Q J Econ 124(4):1403–1448, 2009) to find informal firms have lower physical productivity than formal firms. We also found formal firms have a restricted growth due to capital and output distortions. These results indicate the existence of an inefficient allocation of resources between firms. By reallocating resources to equalize marginal productivity in the manufacturing sector, we calculate TFP gains of 80% in 2002 and 69% in 2015.
Keywords: Total factor productivity, Informality, Distortions, Reallocation of resources, Production factors, Ecuador
JEL Classification: O47, D24
Open Access
© The Author(s) 2019. This article is distributed under the terms of the Creative Commons Attribution 4.0 International License (http://creat iveco mmons .org/licen ses/by/4.0/), which permits unrestricted use, distribution, and reproduction in any medium, provided you give appropriate credit to the original author(s) and the source, provide a link to the Creative Commons license, and indicate if changes were made.
RESEARCH
*Correspondence: rafabastidasr@hotmail.com; hnacosta@puce.edu.ec
1 Pontificia Universidad
Católica del Ecuador, Quito, Ecuador
Conventional investigations such as Howitt (2000) and Klenow and Rodríguez-Clare (2005) argue that increases in productivity are generally obtained by improvements in the production processes, machinery and/or products due to the firms’ investments in human capital and in research and development (R & D). Slow growth of TFP was con-sidered to be caused by barriers that prevent the diffusion and implementation of new technologies.
However, recent studies by Banerjee and Duflo (2005), Restuccia and Rogerson (2008) and Hsieh and Klenow (2009) argue that the slow growth of TFP may also be a conse-quence of policies and market failures. These determine the existence of the firms and the allocation of resources among them. When the allocation of resources is inefficient, the aggregate TFP is affected because productive firms are smaller than they would be in an economy with adequate allocation of resources.
Developing countries are characterized by large differences in productivity between formal and informal firms, which indicates the existence of inefficiencies in the alloca-tion of resources (Busso et al. 2013). The misallocation of resources arises when the most productive firms have insufficient resources to increase their production, while the less productive firms continue to use a certain amount of resources instead of reducing their use of capital and labor, and eventually stop operating (Busso et al. 2013). Therefore, the correction of inefficiencies between formal and informal businesses is a determining fac-tor to increase the productivity of an economy and, at the same time, boost its growth.
In this paper, we use micro-data on manufacturing establishments for the Ecuadorian manufacturing sector from 2002 to 2015 to determine whether there are differences in productivity between firms, and an inefficient allocation of resources between them. We use the model proposed by Hsieh and Klenow (2009) to calculate the differences in productivity and the potential gains of the reallocation of resources in the presence of distortions. We find informal firms have lower physical productivity than formal firms, and formal firms have a restricted growth due to the distortions1 they face. These results indicate the existence of an inefficient allocation of resources among firms. By reallo-cating resources to equalize marginal productivity in the manufacturing sector, gains of 80% in 2002 and 69% in 2015 would be obtained.
2 Theoretical framework 2.1 Informality and productivity
Economic development involves structural changes which require the movement of resources from traditional economic units to modern units. We study the allocation of resources among formal and informal firms in the Ecuadorian case. The growth con-sequence of this allocation of resources depends on the magnitude of the informal economy as a source of growth, and whether the formal and informal sectors of the Ecuadorian economy are complementary or segmented economic units.
Some authors (Hart 1973; Sethuraman 1976; among others) consider the informal sector to be marginal and disconnected from the formal sector, while other authors (Moser 1978; Castells and Portes 1989; among others) argue that the informal sector
1 This could be explained by an asymmetry in the regulation according to the status of formality of the firms, which
in developing countries is necessary and would disappear once these countries have reached adequate levels of economic growth or modern industrial development (Chen 2005). Other authors argue that industrial development could follow a different pat-tern in developing countries (including the expansion of informal economic activities) than in developed countries (Chen 2005). Based on this debate, we have identified three schools of thought: the dualists, the structuralists and the legalists.
The dualist school of thought emerged in the nineteen seventies under the presenta-tion by the ILO in 1972. This school of thought considers the informal sector as a tradi-tional sector, and as an unproductive economic unit with low levels of technology and lack of access to credit and skills, of entrepreneurship, low and irregular incomes, and small and undetermined workplaces (Chen 2005). It considers the informal and formal sectors of the economy to be separated and unrelated. It also considers the informal sec-tor to be made up of marginal activities (Hart 1973; ILO 1972; Sethuraman 1976; Tok-man 1978). According to dualists, the existence of informal activities is due to the lack of insufficient job opportunities to absorb the surplus labor because of the slow rate of economic growth and/or a rapid rate of population growth (Chen 2005). The dualists argue that, due to their size, informal firms are unable to achieve economies of scale. This element, together with technological, innovation and credit factors, restrict their productivity in comparison with large and formal firms.
The structuralist school of thought has two main representatives: Caroline Moser and Alejandro Portes. They argue formal firms can be a source of inefficiency in the alloca-tion of resources because they have to face higher costs than informal firms. In con-trast to the dualists, the structuralists argue that the formal and informal sectors are two integrated and interdependent economic units (Moser 1978; Castells and Portes 1989). According to this school of thought, the informal economy can improve economic results, especially considering informal firms are labor intensive. Thus, the informal sec-tor is a source of employment opportunities, a theory that sounds appropriate for the labor-intensive production structure of developing countries (Potts 2008). In this sense, due to their flexibility, firms in the informal sector can be more productive than large firms in the formal sector.
The legalistic school of thought, with Hernando de Soto as its main representative, argues that the informal sector is made up of entrepreneurs who choose to operate infor-mally to avoid the costs, time and effort involved in the formalization of the firms (from De Soto 1989). This school of thought considers that the existence of informal firms is conditional on governmental procedures and regulations. So, expensive and excessive procedures will induce firms to operate informally (Chen 2005).
On the other hand, the informal economy at firm level has been less studied than at an individual level despite being linked concepts. Some authors (Busso et al. 2012a) take into consideration the employees to establish the definition of informality at firm level. Busso et al. (2012a) argue that the informality of a firm can be measured by the ratio of social security taxes to the remunerations of all employees. Informal firms do not make any contribution to social security, while semi-formal firms (also called irregular) are those that do not pay the total contribution to social security.
It is important to study semi-formal firms because they share characteristics with both formal and informal firms. Because of this particularity, there are usually more semi-formal firms than insemi-formal firms in developing countries. This is mainly because firms try to minimize costs (taxes and social security contributions) without avoiding them completely (like informal firms do).
Multiple studies have used the semi-formal definition to classify firms in their stud-ies. Busso et al. (2012b) use a penalty function as an increasing function of the rate of informality, defined as the unpaid fraction of the tax bill to classify firms as informal, semi-formal and formal. Levy and López-Calva (2016) classify firms into formal, infor-mal and semi-forinfor-mal firms to study the misallocation of resources in Mexico regarding the returns to education. Kenyon (2007) studies the reasons behind the informality and semi-formality status of firms and determines that semi-formal firms employ regulatory evasion as a source of competitive advantage.
The World Bank (n.d.) developed an informality indicator for firms in Ecuador accord-ing to the definition of informality by the employment approach. The classification of the firms is based on the level of contribution to the Instituto Ecuatoriano de Seguri-dad Social (IESS), which is 11.15% of the nominal salary established by law (World Bank n.d.). Formal firms are those that make the full contribution to the IESS according to what is established by law. Completely informal firms are those that do not make any contribution to the IESS. Semi-formal or irregular firms are those that contribute to the IESS less than that established by law.
The existing literature has identified three main sources of aggregate growth of TFP. The first source is technology, which covers the technological development of firms, innovation, and capacity for technological absorption. The second source is the move-ment of factors from low-productivity sectors such as agriculture to higher-productivity sectors such as manufacturing (Nguyen and Yilmaz 2016). The third source is through the improvement in the allocation of resources between industries, which happens when the resources of low-productivity firms move toward high-productivity firms.
is why a potential source of growth is the correction of productivity inefficiencies, espe-cially for developing economies that are those that face greater inefficiencies. The study of the movement of resources between formal and informal firms will allow us to eval-uate whether there is a misallocation of resources in the Ecuadorian´s manufacturing sector.
2.2 Hsieh and Klenow model
The literature has studied the existence of a lower TFP due to the misallocation of resources between firms. These studies have found that gains in TFP can be obtained in the absence of distortions. Studies have also found that there is a greater degree of misallocation in developing countries. This can be explained mainly because of the lower degree of reallocation of factors between productive units and because of distortions generated by public institutions and policies in developing countries (Vasconcelos 2017).
In this context, Hsieh and Klenow (2009) find that if the manufacturing sectors of China and India were reallocated to equalize marginal products to the extent observed in the US manufacturing sector, the TFP gains would be 30% to 50% and 40% to 60%, respectively.
As mentioned before, Busso et al. (2012b) find that the dispersion of TFPQ is greater in Latin America than in the USA and greater than in China. Their results show that countries from Latin America have a higher dispersion in TFPR than in the USA, which suggests Latin America presents a substantial degree of misallocation. They find that the gains from the efficient allocation of resources within four-digit industries would be around 45% to 127%. These results suggest the potential gains of reallocation are larger than in the USA.
Busso et al. (2012b) find that improving the allocation of resources across firms could increase total factor productivity by 52.7% to 57.6% in Ecuador. Arellano (2009) also finds the existence of potential gains from the reallocation of resources, indicating that aggregate gains from reallocation of inputs in Ecuador’s manufacturing sector range from 12 to 93% of aggregate value added.
3 Informality in Latin America and Ecuador
Informality is a characteristic that underdeveloped and developing countries present and can cause further economic retardation, taking into consideration that the misallocation of resources has a negative impact on productivity. Loayza et al. (2009) find that there is a large heterogeneity in the extent of informality in Latin America. However, informal-ity rates are higher than in the USA, and some countries of the region are among the countries with the higher informality rate in the world. They find that the typical coun-try in Latin America produces about 40% of GDP and employs 70% of the labor force informally.
institutions. Ulyssea (2010) explains that a common feature of most Latin Ameri-can countries is the restrictive labor market institutions and strict regulation of entry. In consequence, operating formally can be extremely costly for a firm and reduce the incentives for firms to operate formally; that is why Latin American countries face high informality rates.
Enste and Schneider (2003) find that the informal sector represents more than a third of the global output of developing countries and around 10 to 20% of global output in developed countries. The ILO 2002 find similar results: 51% of non-agricultural employ-ment in Latin America is informal, 48% in North Africa, 65% in Asia and 72% in Sub-Saharan Africa. Benjamin and Mbaye (2014) explain that the urban informal sector tends to absorb the rural workforce and that the informal sector has a strong female presence (60% of female workers in the developing world are in the informal sector).
Informal employment, which refers primarily to employment in enterprises that lack registration and social security coverage for their employees (OECD 2009), is high in Latin America. Gasparini and Tornarolli (2009) identify that the informal labor work-force is characterized by being unskilled and operating in low-productivity jobs, in mar-ginal, small-scale and usually in family-based activities.
Informality is also a characteristic present at firm level in Latin American countries. Maloney (2004) explain that small-scale, semi-legal, often low-productivity, frequently family-based enterprises employ between 30 and 70% of the urban workforce in the region. He argues that small firms face higher costs, are likely to be informal and have high failure rates.
In Ecuador, 67% of firms indicate to face competition with informal firms which is higher than in Latin America (63%) and higher than in upper middle-income countries (51%) according to the World Bank (2017). These figures show that informal firms have an unfair advantage over formal firms in the country because they can avoid costs form complying with regulations. Also, 88% of Ecuadorian firms affirm being registered when starting operations, which is slightly higher than in the region (87%) and lower than in upper middle-income countries (91%).
Having this background, we characterize the Ecuadorian informal firms for the manu-facturing sector in the period analyzed. We find that 20% of the firms in the Amazon are informal, 27% in the Andes, and 32% in the Coastline. We also find that from the main subsectors of manufacturing, the leather manufacturing subsector has the highest rate of informality (40%), followed by print and reproduction of recordings subsector (35%). On the other hand, we find that 32% of the small firms, 25% of medium A firms, 24% of medium B firms and 24% of large firms are informal.
4 Empirical method
Hsieh and Klenow (2009) propose a model of monopolistic competition with heteroge-neous firms facing distortions in the prices they observe. The misallocation of resources is caused by the distortions that produce differences in the marginal productivity of cap-ital and labor, affecting the aggregate factor productivity (Hsieh and Klenow 2009). In the model, Y is a final good of a set of goods Ys produced by a representative firm in a perfectly competitive market, with constant returns to scale (
where the output of each sector Ys is produced by combining Ms differentiated goods, produced by the individual firms using a CES technology. It is assumed that the elasticity of substitution is same for all industries:
In the model, the production function for each differentiated product is given by a Cobb–Douglas production function, consisting of productivity (A), and inputs of capital (K) and work (L):
where s is sector, i is firm, αs is the capital share2, and labor share is 1 − αs . The
indi-vidual return of a firm is expressed as follows:
where w refers to wages and R denotes the cost of capital. Two types of distortions affect the decisions of firms: output distortions ( τYsi ) and capital distortions ( τKsi ). The for-mer by affecting production affects both capital and labor. These include high transport costs, bribes, operating costs of firms, costs of government restrictions due to the firms’ size, among others. On the other hand, capital distortions increase the cost of capital. These include credit restrictions, credit conditions which differ between firms (credit history, evasion patterns), among others.
In the presence of distortions, the marginal productivity of labor and capital is deter-mined as:
There are two types of productivity: physical productivity ( TFPQ) measured by Asi ,
and revenue productivity ( TFPR ) measured by PsiYsi . In the absence of distortions, more resources would be allocated to firms with greater physical productivity. That is, in the (1)
Y =
S
s=1 Ysθs
(2)
Ys= Ms
i=1
Y
σ−1 σ si
σ −1 σ
(3)
Ysi=AsiKsiαsL 1−αs si
(4)
πsi=(1−τYsi)PsiYsi−wLsi−(1+τKsi)RKsi
(5)
1+τKsi=
αs
1−αs
wLsi
RKsi
(6)
1−τYsi= σ σ−1
RKsi αsPsiYsi
(7)
MRPKsi=
R(1+τKsi) 1−τYsi
(8) MRPLsi=
w 1−τYsi
absence of distortions, TFPR should be same among all firms in the same industry or sec-tor. Deviations from this benchmark determine the magnitude of the distortions, which are measured through the dispersion of TFPR. TFPR is determined as:
TFPR can be expressed as the geometric mean of the marginal productivity of labor and capital:
A high TFPR means firms face barriers that increase products marginal of capital and work of the plant, making the plant smaller than optimal. Similarly, the aggregate TFPQ should be high in the absence of distortions, which would imply a reallocation of resources from the least productive firms to the most productive firms. However, with the presence of inefficiencies in the allocation of resources, there will be some dispersion in the distribution of the firms’ physical productivities. TFPQ is determined as:
To assess productivity gaps, the efficient level of TFP is calculated to compare it with the actual level of TFP. If the marginal products of capital and labor of all the firms in a given sec-tor are equalized, the TFP of the industry (also called the TFPQ* because it is the geometric average of Asi ) would be:
For each industry, the TFP ratio is calculated with its efficient level, and it is added for all industries using the Cobb–Douglas method:
This expression allows estimating counterfactual productivity gains in the absence of dis-tortions, where:
(9)
TFPRsi
∧
=PsiAsi= PsiYsi
Kαs
si L
1−αs
si
(10)
TFPRsi∝(MRPKsi)αs(MRPLsi)1−αs ∝
(1+τKsi)1−αs (1−τYsi)
(11) TFPQsi =∧ Asi=
Ysi Ksiαs(Lsi)1−αs
(12) ¯
As=TFPQ∗=
Ms
i=1
Aσsi−1
σ1−1
(13) Y Yefficient = S
s=1
Ms
i=1
Asi ¯ As TFPRs TFPRsi
σ−1 θs (σ−1)
(14) TFPRsi=
σ 1−σ
MRPK
si
αs
αsMRPL
si
1−αs
1−αs = σ
1−σ R
αs
αs w
1−αs
1−αs(1+τ
Ksi)αs
(1−τYsi)
(15)
TFPRs= σ
1−σ
�MRPK
s αs
�αs�MRPL
s
1−αs
�1−αs
= σ
1−σ
R
�
αs�Ms
i=1 1−τYsi
1+τKsi
PsiYsi
PsYs
�
αs�
w
(1−αs)�Ms
i=1(1−τYsi) PsiYsi
PsYs
The gains from reallocation of factors are given by:
5 Data
The micro-data used on Ecuadorian manufacturing establishments range from 2002 to 2015.3 We use the data from the “Encuestas de Manufactura y Minería” (Manufactur-ing and Min(Manufactur-ing Surveys4), conducted by the Instituto Nacional de Estadística y Censos (INEC). These data cover a representative sample of firms with 10 or more employees each year, and the collection unit is the firm. The variables used are International Stand-ard Industrial Classification of All Economic Activities (three-digit ISIC), labor compen-sations, gross production by the establishment and capital stock. Specifically, employees’ compensations consist of wages, salaries and benefits (made up of other remunerations, bonuses, profit sharing, family allowance, employer’s contribution to social security and contribution to the reserve fund). The stock of capital refers to the historical value of fixed assets and their corresponding accumulated revaluation value.
We use the US capital and labor shares as a benchmark because their economy is considered to be comparatively undistorted. To obtain the US labor share,5 we use the NBER-CES Manufacturing Industry database presented by the National Bureau of Eco-nomic Research (NBER) and the Center for EcoEco-nomic Studies (CES). Labor share is used as an annual average. For the years 2012–2015 where data are not available, we calculate the average growth6 of labor, share is calculated and we project the values.
Once the productivity (both physical and revenue) of the firms has been calculated, we trim the 1% tails of plant productivity and distortions to make the results robust to outliers.
5.1 Parameters
To calculate the effects of resource misallocation will establish our key parameters. The capital rental price (R) is set at 10% (without considering the possible distortions), 5% real interest rate and 5% depreciation rate, according to the model proposed by Hsieh and Klenow (2009). The true cost of capital is (1+τKsi)R , where τKsi are the capital
distortions. In case these differ from 0, the cost of capital would be different from the 10% established. However, we must consider efficiency gains due to the reallocation of resources do not depend on R. Therefore, incorrect values for R only affect the average capital distortions, but not the reallocation gains. Because our hypothetical reforms col-lapse τKsi to their average in each industry, potential efficiency gains do not depend on R.
If R has been incorrectly established, it would only affect the average capital distortions (16)
Y
efficient
Y
−1
3 The methodology of the “Encuesta Exhaustiva” of 2011 differs from the methodology of the Manufacturing and
Min-ing Surveys, which is why we decided to exclude this year. The omission of 2011 does not reduce precision to our study, because it is not an atypical year for the Ecuadorian economy.
4 We exclude the mining firms.
but not the liberalization experiment. The elasticity of substitution is established at
σ =3 , according to the model proposed by Hsieh and Klenow (2009).7
In the NBER and CES databases, labor compensations omit the additional benefits and social security contributions made by the employer. According to the Income and National Products Accounts, the labor share presented in the database is 2/3 of the total labor share, which includes other forms of compensation apart from the employees’ sal-ary. So, we multiply the labor share of the NBER and CES databases by 3/2 to obtain the elasticity of the labor that will be used for the calculations. The capital share is estab-lished as 1 minus the US labor share.
5.2 Model assumptions
• The aggregate labor and capital shares in each industry are not affected by the mag-nitude of the misallocation when the average marginal revenue products remain con-stant. This property is due to the Cobb–Douglas aggregator (unit elastic demand8).
• We consider an aggregate stock of fixed capital.9
• We assume that the number of firms in each industry is not affected by the scope of the inefficient allocation of resources.10
6 Results 6.1 Informality
6.1.1 Characterization of informal manufacturing firms
Informality is the non-compliance of a particular regulation. We measure the level of evasion by measuring the firm’s social security’s contribution to the IESS.
The level of informality is calculated as follows:
The employers’ contribution to social security is 11.15% of the nominal salary required by law, according to IESS. So, the percentage of contribution to social security is set at 11.15%.11
Formal firms contribute to the IESS the full amount required by law. Completely infor-mal firms do not contribute in any way to the IESS. Irregular firms contribute to the IESS in a lesser extent than required by law. So that the level of informality will be 1 if (17)
Level of informality=1−(contribution to IESS/(remunerations
×percentage of contribution to social security
11 To check that the level of contribution to the IESS is 11.15%, we calculated the ratio of contribution (IESS) to the
remunerations, and then the mode was obtained for each year.
8 Hsieh and Klenow (2009) argue that an industry that is 1% more efficient has a 1% lower price index and a 1% higher
demand, which can be accommodated without adding or eliminating inputs.
9 The capital rental rate increases as the aggregate TFP increases so that capital would be expected to respond to the
TFP variation. If the capital is endogenized, a Euler consumption equation could be used to specify the long-term rental rate (R). The output elasticity with respect to aggregate TFP would be 1/1−S
s=1∝sθs
(Hsieh and Klenow 2009).
10 Hsieh and Klenow (2009) show that the number of firms would not be affected by the degree of misallocation in an
endogenous input model in which entry costs take the form of a fixed amount of labor.
the firm is completely casual, 0 if the firm is formal, and between 0 and 1 if the firm is semi-formal, according to the level of evasion contribution to the IESS.12
Using this methodology, we find that most of the firms are formal, as observed in Table 8 in “Appendix.” Of the total sample, 71% of firms are formal, while 24% are semi-formal firms and 5% are completely insemi-formal firms. In addition, smaller firms have a lower percentage of formality than larger firms,13 as indicated in Table 9 in “Appendix.”
6.2 Productivity, distortions and potential earnings
We begin by presenting the dispersion of physical productivity, which allows us to quantify the heterogeneity of productivity among firms. Subsequently, we present the dispersion of the revenue productivity which allows us to identify the existence of an inefficient allocation of resources between firms, and to prove the presence of distor-tions. The dispersion of capital and output distortions affecting the productive pro-cess of the firms are quantified below. Finally, we calculate the potential gains of an efficient allocation of resources among firms of the Ecuadorian manufacturing sector.
6.2.1 Total physical factor productivity (TFPQ)
Log ( AsiM 1
σ−1
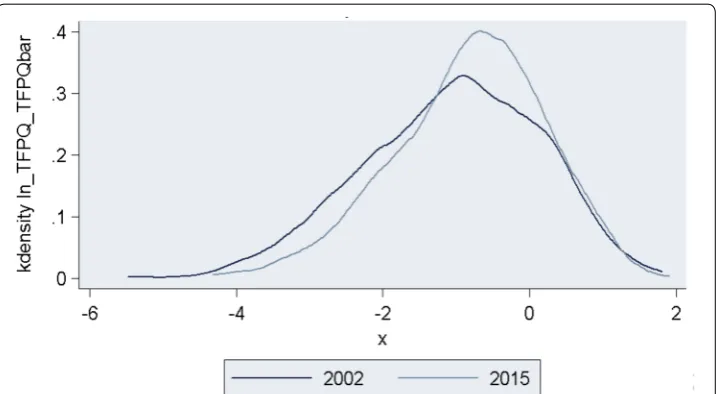
s /A¯s ), which will be called log ( TFPQsi/TFPQs ), will allow us to evaluate the dispersion of the TFPQ. That is the differences in physical productivity between firms. Figure 1 shows the log distribution curves ( TFPQsi/TFPQs ) for 2002 and for 2015. In our calculations, industries are defined at a three-digit ISIC disaggregation
Fig. 1 Distribution curves of TFPQ for 2002 and 2015 Source: Author’s calculations using the INEC Manufacturing Surveys
12 The sum of the number of semi-formal firms and completely informal firms will be equal to the number of informal
firms.
13 The size was established according to resolution 1260 of the Andean Community of Nations (CAN) of August 21,
to compare firms that produce similar goods. The variance of the productivity of the year 2002 is greater than that of the year 2015 (1.4 vs. 1.1), which indicates that there is greater dispersion of physical productivity in 2002 than in 2015.
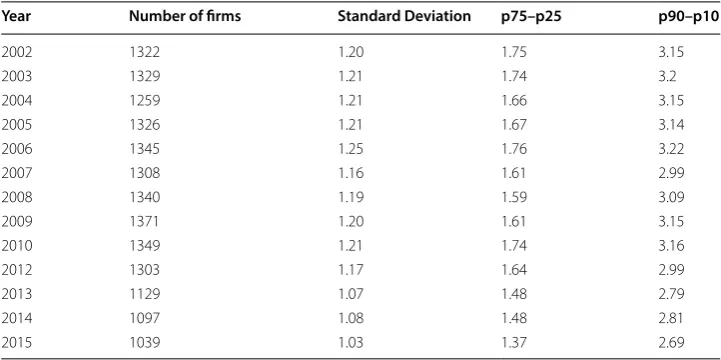
Table 1 shows the dispersion statistics of the TFPQ for years. We can observe the dispersion in all the years studied, which indicates that certain firms produce much more than others, with the same quantity of inputs. These differences in productivity may be due to extreme variations between processes and technologies used by firms to produce and compete within the manufacturing sector. These differences may be also related to the differences in human capital or the managerial ability of business leaders.
The standard deviation of 1.20 presented in 2002 and of 1.03 in 2015 shows an inef-ficient allocation of resources. Likewise, we calculated the difference between the 75th percentile and the 25th percentile to evaluate the physical productivity behav-ior of the firms. We found this difference was 1.75 in 2002 and 1.37 in 2015. The difference between the 90th percentile and the 10th percentile of 3.15–2.69 for the year 2002 and the year 2015, respectively, is evidence of the inefficient allocation of resources in the manufacturing sector. This result shows the differences in physical productivity among Ecuadorian manufacturing firms since it indicates that firms in the 90th percentile of productivity are approximately 300 times more productive than firms in the 10th percentile.
6.2.2 Revenue productivity (TFPR)
Revenue productivity is the product of physical productivity and a firm’s output price. In the absence of distortions, the aggregate TFPR should be equal between firms in each industry because (assuming monopolistic competition) less productive firms should produce less and charge higher prices. Without distortions, more capital and labor are allocated to firms with greater physical productivity, and fewer resources are allocated to
Table 1 TFPQ dispersion statistics, by year Source: Author’s calculations using the INEC Manufacturing Surveys
Year Number of firms Standard Deviation p75–p25 p90–p10
2002 1322 1.20 1.75 3.15
2003 1329 1.21 1.74 3.2
2004 1259 1.21 1.66 3.15
2005 1326 1.21 1.67 3.14
2006 1345 1.25 1.76 3.22
2007 1308 1.16 1.61 2.99
2008 1340 1.19 1.59 3.09
2009 1371 1.20 1.61 3.15
2010 1349 1.21 1.74 3.16
2012 1303 1.17 1.64 2.99
2013 1129 1.07 1.48 2.79
2014 1097 1.08 1.48 2.81
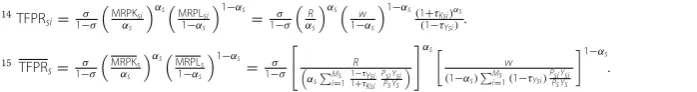
firms with lower physical productivity. The TFPR can be expressed as an average of the marginal revenue products of capital and labor.14
The TFPR at the industry level is TFPRs and can be expressed as a geometric
aver-age of the industry’s marginal revenue products of capital and labor.15 Misallocation of resources between firms can be calculated as the dispersion of their distribution among firms. Thus, in the absence of distortions, TFPRsi/TFPRs is equal to one, implying that productive resources are allocated in more quantity to more productive firms and to a lesser extent to less productive firms.16
If the TFPR is not equal between firms, it could be a sign of poor allocation of resources. The deviation of TFPR of a firm, from the average of the industry, would indicate the existence of distortions (Hsieh and Klenow 2009). This can be repre-sented as TFPRsi/TFPRs. When the ratio is different from one, meaning the firm faces high distortions (like taxes) and that if the distortions are removed, the firm would increase its production. That is, high dispersion levels imply potential productivity gains that can be achieved by reallocating factors between firms. Log ( TFPRsi/TFPRs. will be used as a measure of inefficiency in allocating resources.
Figure 2 shows the dispersion of productivity in the manufacturing sector for the years 2002 and 2015. In our calculations, industries are defined at a three-digit dis-aggregation level according to the International Standard Industrial Classification of All Economic Activities (ISIC), in order to compare firms that produce similar goods. Figure 2 shows the log distribution curves ( TFPRsi/TFPRs. ) for the year 2002 and for the year 2015. The variance of the productivity of the year 2002 is greater than that of Fig. 2 TPFR distribution curves for 2002 and 2015 Source: Author’s calculations using the INEC Manufacturing Surveys
14 TFPRsi=1−σσ
MRPKsi
αs αs
MRPLsi
1−αs 1−αs
=1σ
−σ
R
αs αs
w
1−αs 1−αs
(1+τKsi)αs
(1−τYsi).
15 TFPRs=1−σσ MRPK
s αs
αsMRPL s 1−αs
1−αs
=1−σ
σ
R
αsMsi=1
1−τYsi
1+τKsi Psi Ysi Ps Ys
αs
w
(1−αs)Msi=1(1−τYsi)Psi YsiPs Ys 1−αs
.
16 Reassignment of capital and labor continues to the point where the prices are reduced for firms with higher
2015 (0.7 versus 0.2), which indicates that there is greater dispersion of revenue pro-ductivity in 2002 than in 2015.
In the absence of distortions, there should be no differences in productivity between firms, so the dispersion would be 0. Greater dispersion indicates greater distortions. Table 2 provides the dispersion of annual productivity of the sector, which shows the inefficiency in the allocation of capital and labor.
The standard deviation of 0.84 and 0.71 in 2002 and 2015, respectively, shows an inefficient allocation of resources in the manufacturing sector. The difference between the 75th percentile and the 25th percentile was 1.06 in 2002 and 0.84 in 2015. The difference between the 90th percentile and the 10th percentile was 2.16 and 1.79 in 2002 and 2015, respectively. This implies that a dollar of work and capital assigned to firms in the 90th percentile is worth approximately twice as much as the same dollar assigned to firms in the 10th percentile.
6.2.3 Distortions
There are two types of distortions that affect the decisions of firms: output distortions ( τYsi ) and capital distortions ( τKsi ), according to Hsieh and Klenow (2009). The for-mer affects production, thus also affecting both capital and labor. These include high transport costs, bribes and operating costs of firms, costs of government restrictions due to the size of firms, among others. On the other hand, capital distortions mean an increase in the cost of capital. These include credit restrictions, credit conditions which differ between firms (credit history, evasion patterns), among others.
As mentioned above, a greater dispersion in productivity indicates the presence of distortions and inefficiency in the allocation of resources between firms. In order to verify this in the Ecuadorian manufacturing sector, we calculate the dispersion of the firms’ distortions.
We find that there is a dispersion of productivity among firms, which indicates the existence of distortions that affect the level of inefficiency in the allocation of
Table 2 TPFR dispersion statistics, by year Source: Author’s calculations using the INEC Manufacturing Surveys
Year Number of firms Standard deviation p75–p25 p90–p10
2002 1322 0.84 1.06 2.16
2003 1329 0.83 1.05 2.11
2004 1259 0.85 1.06 2.18
2005 1326 0.82 1.05 2.03
2006 1345 0.81 1.03 2.01
2007 1308 0.8 0.98 1.91
2008 1340 0.79 0.99 2.02
2009 1371 0.78 0.96 1.96
2010 1349 0.78 0.94 1.93
2012 1303 0.75 0.92 1.86
2013 1129 0.75 0.9 1.8
2014 1097 0.73 0.85 1.83
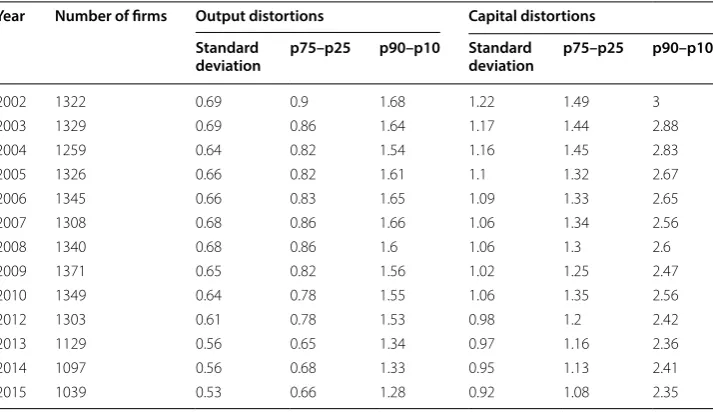
resources between firms. In Table 3, we can observe dispersion statistics of the capital and output distortions that affect TFPR. The existence of distortions coincides with the dispersion of productivity between firms.
Output distortions present a standard deviation of 0.69 in 2002 and 0.53 in 2015. On the other hand, capital distortions have a standard deviation of 1.22 in 2002 and 0.92 in 2015. The dispersion of output and capital distortions denotes the inefficiency in the allocation of resources in the manufacturing sector which affect the firms´ production.
The difference between the 75th percentile and the 25th percentile for output dis-tortions was 0.90 in 2002 and 0.66 in 2015. The difference between the 90th percentile and the percentile 10 was 1.68 and 1.28 for 2002 and 2015, respectively.
In the case of capital distortions, the difference between the 75th percentile and the 25th percentile was 1.49 in 2002 and 1.08 in 2015. The difference between the 90th percentile and the 10th percentile was 3.00 in 2002 and 2.35 in 2015.
Both capital and output distortions show that resources are not allocated efficiently between firms. This indicates that with the reallocation of capital and labor factors, pro-ductivity gains would be obtained.
6.2.4 TFP gains
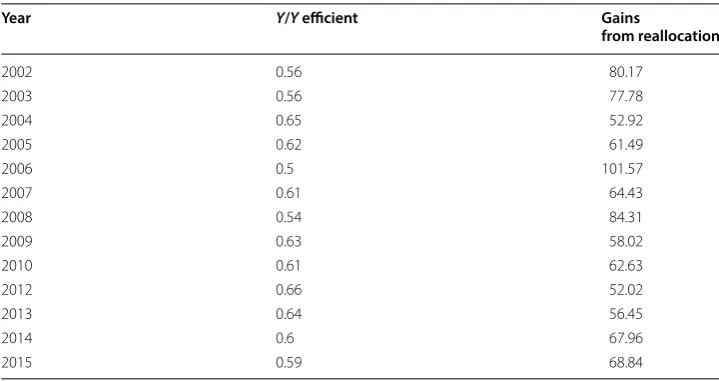
TFP gains for the manufacturing sector would be obtained by the efficient allocation of capital and labor. We calculated that the productivity gains might have been around 80% in 2002 and 69% in 2015,17 as shown in Table 4. So, by equalizing marginal prod-ucts between manufacturing firms by the reassignment of factors, the productivity of the manufacturing sector would have been 69% higher in 2015. It makes sense that the
Table 3 Dispersion statistics of output and capital distortions, by year Source: Author’s calculations using the INEC Manufacturing Surveys
Year Number of firms Output distortions Capital distortions Standard
deviation p75–p25 p90–p10 Standard deviation p75–p25 p90–p10
2002 1322 0.69 0.9 1.68 1.22 1.49 3
2003 1329 0.69 0.86 1.64 1.17 1.44 2.88
2004 1259 0.64 0.82 1.54 1.16 1.45 2.83
2005 1326 0.66 0.82 1.61 1.1 1.32 2.67
2006 1345 0.66 0.83 1.65 1.09 1.33 2.65
2007 1308 0.68 0.86 1.66 1.06 1.34 2.56
2008 1340 0.68 0.86 1.6 1.06 1.3 2.6
2009 1371 0.65 0.82 1.56 1.02 1.25 2.47
2010 1349 0.64 0.78 1.55 1.06 1.35 2.56
2012 1303 0.61 0.78 1.53 0.98 1.2 2.42
2013 1129 0.56 0.65 1.34 0.97 1.16 2.36
2014 1097 0.56 0.68 1.33 0.95 1.13 2.41
2015 1039 0.53 0.66 1.28 0.92 1.08 2.35
17 These gains are from the 3-digit reallocation of resources within the industries. The gains could potentially be greater
gains from efficient allocation of factors are lower in 2015 compared to the year 2002, taking into consideration that the capital and output distortions were lower in 2015 than in 2002.
In this section, we have studied physical productivity, revenue productivity and distor-tions on manufacturing firms in Ecuador, in order to assess the existence of an inefficient allocation of resources. The dispersion of TFPQ between firms has shown the difference in physical productivity between firms in the manufacturing sector, while the dispersion of TFPR has evidenced the misallocation of factors between firms, showing the existence of distortions that affect the production process of the firms.
We have evidenced the existence of output and capital distortions, which prevent an efficient allocation of capital and labor. By eliminating the output and capital distortions, and equalizing the revenue productivity, we have been able to quantify the gains from the efficient allocation of resources within the manufacturing sector. This was done for the 3-digit industries, using the model proposed by Hsieh and Klenow (2009). We found that productivity gains would have been around 80% in 2002 and 69% in 2015. On the other hand, it is important to evaluate how the status of the informality of the firms is related to its productivity.
6.3 Productivity and informality
In this section, we study the relationship between productivity and informality. As previ-ously mentioned, the main element of the study associated with informality is the pro-ductivity differential between firms according to their formality status. Multiple studies have indicated that firms that operate informally are less productive than firms that operate formally. Based on that, we used ordinary least squares (OLS) to compute the effect of informality on productivity.
Table 4 Gains from the reallocation of resources, per year Source: Author’s calculations using the Manufacturing Surveys of the INEC
Year Y/Y efficient Gains
from reallocation
2002 0.56 80.17
2003 0.56 77.78
2004 0.65 52.92
2005 0.62 61.49
2006 0.5 101.57
2007 0.61 64.43
2008 0.54 84.31
2009 0.63 58.02
2010 0.61 62.63
2012 0.66 52.02
2013 0.64 56.45
2014 0.6 67.96
6.3.1 Physical productivity and informality
Multiple studies (Taymaz 2009; Dabla-Norris et al. 2005; among others) have found that informal firms have lower physical productivity than formal firms. We used log ( TFPQsi/TFPQs ) as the dependent variable, and formality status, informality level and fixed effects as independent variables.
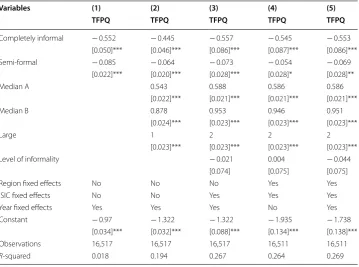
Table 5 shows informal firms have lower physical productivity than formal firms. The results are basically the same among the regressions that present different fixed effects. In column (5), the regression includes size, region, ISIC, and year fixed effects. We find completely informal firms are on average 42% less productive than formal firms and semi-formal firms are on average 7% less productive than formal firms.18,19 This coin-cides with the level of informality which is negatively correlated with the physical pro-ductivity of the firms.20
6.3.2 Revenue productivity and informality
Previously we found that there is a high dispersion of the TFPR, which denotes an ineffi-cient allocation of resources among firms. It is important to remember that a high TFPR
Table 5 Log regression ( TFPQsi/TFPQs) on formality situation Source: Author’s
calculations using the INEC Manufacturing Surveys
Robust standard errors in brackets ***p < 0.01, **p < 0.05, *p < 0.1
Variables (1) (2) (3) (4) (5)
TFPQ TFPQ TFPQ TFPQ TFPQ
Completely informal − 0.552 − 0.445 − 0.557 − 0.545 − 0.553
[0.050]*** [0.046]*** [0.086]*** [0.087]*** [0.086]***
Semi-formal − 0.085 − 0.064 − 0.073 − 0.054 − 0.069
[0.022]*** [0.020]*** [0.028]*** [0.028]* [0.028]**
Median A 0.543 0.588 0.586 0.586
[0.022]*** [0.021]*** [0.021]*** [0.021]***
Median B 0.878 0.953 0.946 0.951
[0.024]*** [0.023]*** [0.023]*** [0.023]***
Large 1 2 2 2
[0.023]*** [0.023]*** [0.023]*** [0.023]***
Level of informality − 0.021 0.004 − 0.044
[0.074] [0.075] [0.075]
Region fixed effects No No No Yes Yes
ISIC fixed effects No No Yes Yes Yes
Year fixed effects Yes Yes Yes No Yes
Constant − 0.97 − 1.322 − 1.322 − 1.935 − 1.738
[0.034]*** [0.032]*** [0.088]*** [0.134]*** [0.138]***
Observations 16,517 16,517 16,517 16,511 16,511
R-squared 0.018 0.194 0.267 0.264 0.269
18 We use a log-level model to evaluate the percentage change of the dependent variable against a change in the
inde-pendent variable. The deinde-pendent variables without transformation had a bias to the right, while variables transformed to logarithm follow a normal curve.
19 We calculate the effect in Y of the change of a unit in X as 100∗
indicates a high factor cost due to the presence of distortions. According to Ma (2010), there are two main elements that explain a high TFPR: a) the presence of distortions altering the marginal revenue products of capital and/or labor, b) the presence of distor-tion increasing the optimal price of the products produced by the firms.
In the absence of distortions, more resources should be allocated to firms with greater physical productivity. This should be done up to the point when revenue productivity is equal between firms in the same industry. Therefore, firms that have a high TFPR face more distortions and use fewer inputs than they should use in the absence of distortions, while firms with low TFPR face fewer distortions (in many cases, they are subsidized) and use more inputs than they should.
In order to find the relationship between the presence of distortions in the firms, and the formality situation of the same, we apply an OLS regression. We use ( TFPQsi/TFPQs ) as the dependent variable, and formality situation, level of informality and fixed effects as independent variables.
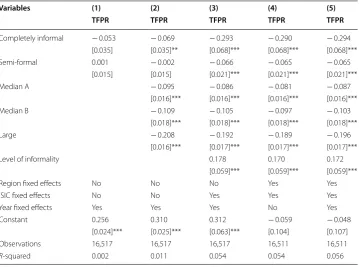
Table 6 shows formal firms face greater distortions than informal firms. The results are basically same among the regressions that present different fixed effects. In column (5), the regression includes size, region, ISIC and year fixed effects. Following the heuristic inter-pretation of the TFPR differences presented above, the results indicate that a dollar of capital and labor allocated to formal firms is worth approximately 30% more than for com-pletely informal firms, and 7% more than for semi-formal firms.
Having a lower TFPR than the industry average indicates that firms face fewer distor-tions and use more inputs than they should, and Table 6 shows semi-formal and completely
Table 6 Log regression ( TFPRsi/TFPRs) on formality situation Source: Author’s calculations
using the INEC Manufacturing Surveys
Standard robust errors in brackets ***p < 0.01, **p < 0.05, *p < 0.1
Variables (1) (2) (3) (4) (5)
TFPR TFPR TFPR TFPR TFPR
Completely informal − 0.053 − 0.069 − 0.293 − 0.290 − 0.294
[0.035] [0.035]** [0.068]*** [0.068]*** [0.068]***
Semi-formal 0.001 − 0.002 − 0.066 − 0.065 − 0.065
[0.015] [0.015] [0.021]*** [0.021]*** [0.021]***
Median A − 0.095 − 0.086 − 0.081 − 0.087
[0.016]*** [0.016]*** [0.016]*** [0.016]***
Median B − 0.109 − 0.105 − 0.097 − 0.103
[0.018]*** [0.018]*** [0.018]*** [0.018]***
Large − 0.208 − 0.192 − 0.189 − 0.196
[0.016]*** [0.017]*** [0.017]*** [0.017]***
Level of informality 0.178 0.170 0.172
[0.059]*** [0.059]*** [0.059]***
Region fixed effects No No No Yes Yes
ISIC fixed effects No No Yes Yes Yes
Year fixed effects Yes Yes Yes No Yes
Constant 0.256 0.310 0.312 − 0.059 − 0.048
[0.024]*** [0.025]*** [0.063]*** [0.104] [0.107]
Observations 16,517 16,517 16,517 16,511 16,511
informal firms face fewer distortions than formal firms. The World Bank (n.d.) argues three main reasons why revenue productivity differs between formal and informal enterprises. First, there is an asymmetry in the regulation according to the situation of formality of the firm. Second, these regulations represent taxes for formal firms and subsidies for informal firms. Third, compliance with these regulations is imperfect, which generates ease of eva-sion by some firms (World Bank n.d.).
7 Discussion: misallocation and policies
These results indicate formal firms are more productive than informal firms in the Ecua-dorian manufacturing sector. Formal firms also face greater distortions than informal firms. Differences in basic conditions in which firms exist are access to credits and finan-cial markets, taxes and obligations, sofinan-cial policy and labor obligations. These differences result in distinct productivity levels between firms. These elements generate distortions that prevent an efficient allocation of resources between firms.
One of the most obvious causes of resource misallocation is the difference in acces-sibility to credit and financial markets. The difficulty to access loans prevents productive firms from expanding, prevents less productive firms to access technological improve-ments and/or the necessary investimprove-ments that would allow them to increase their pro-ductivity (Pagés 2010). This usually happens with small or informal firms, which have difficulty accessing the financial market because they do not have a credit history or the necessary guarantees to obtain a loan (Pagés 2010).
The difficulty to access financial markets reduces the incentives of informal firms to comply with regulations (related to taxes or to labor obligations) (Eslava et al. 2010). This allows certain informal firms with lower productivity to survive because they face lower costs compared to their formal counterparts (Eslava et al. 2010). In this sense, the expan-sion of credit and access to financial markets would represent a contribution to the for-malization of firms (Pagés 2010).
On the other hand, the expansion of credit is beneficial only if it is correctly formu-lated and directed (Arizala et al. 2009). However, a higher credit supply does not neces-sarily have a positive impact on productivity (Pagés 2010). Inefficiency in the allocation of capital and labor can be accentuated if the loans are directed toward firms with low levels of productivity (loans that may have been made by national development banks or subsidies to public credit) (Pagés 2010) For this reason, it is essential for loans to be channeled toward more productive firms or with a high productive potential (Pagés 2010). The distinction is complicated but crucial to correct the inefficient allocation of resources between firms (Arizala et al. 2009).
The second suspect in resource misallocation is the tax regime. One of the ways in which the structure of tax systems affects productivity is through the tax distinction between firms and industries (Pagés 2010). Certain industries and firms enjoy greater tax deductions or they evade tax payment, causing them to grow in greater quantity independently of their productivity, and that the allocation of productive resources is distorted (Pagés 2010).
for firms (Chong and Pagés 2010). According to Pagés (2010), simplified tax regimes rep-resent discrimination due to the firm’s size, greater ease of evading tax obligations, lesser control across companies and limited information to control the payment of taxes All these elements would represent an advantage to unproductive and/or informal firms.
A tax regime in which the most productive firms face higher taxes avoids the efficient allocation of resources between firms. High taxes and inefficient control induce firms to evade their tax obligations (Chong and Pagés 2010). So, certain firms survive despite their low productivity, and the growth of high-productivity firms is restricted (Chong and Pagés 2010). It works in the same way for formal and informal firms. Formal firms face greater costs (taxes), while informal firms evade these costs.
The existence of incorrectly structured tax regimes affects the productivity of firms because it promotes the survival of unproductive firms and obstructs the growth of large and small firms. It also promotes inequality and segmentation between firms in terms of tributary obligations (Chong and Pagés 2010). Tax regimes differentiated by size, industry or based on other firms’ characteristics generate distortions in the allocation of resources. These taxes also represent an additional burden for the public administration and, in turn, reduce the tax revenue (Chong and Pagés 2010). A properly structured tax regime is necessary to reduce evasion and to generate incentives for the payment of taxes. Simplification, unification and compliance with tax provisions could generate productivity gains (Pagés 2010).
Poor enforcement and incomplete coverage of social security systems is another tax downfall. The coverage of social security for employees and other labor obligations (fam-ily allowance, contribution to the reserve fund, among others) in some cases represents constraints due to the high cost it represents for employers and in many cases, also for the employees given the little use they give to this type of programs (Pagés 2010).
Some firms choose to evade the payment of social security for their employees and other labor obligations to evade the costs it represents (Kapteyn et al. 2005). This is gen-erally related to the size and formality of the firms. Small firms and informal firms have greater incentives to evade these obligations and to incur in lower labor costs (Pagés 2010). This behavior affects the correct allocation of resources because it represents a cost for the most productive firms and a subsidy for the least productive ones (Pagés 2010).
Once we have studied the three possible drivers of misallocation, it is important to determine which of those is the main resource of misallocation in Ecuador´s manufac-turing sector. Busso et al. (2013) suggest that the relationship between misallocation and firm size is useful to identify the source of misallocation. If small firms face growth con-straints, this would imply misallocation of resources is due to limited access to credit and financial market failures. In this case, the average returns to an additional unit of capital or labor would be higher in small firms than in larger ones.
To study the relationship between marginal products of factors and firm size, we used log ( TFPRsi/TFPRs ) on firms’ size dummies. We established the firm’s size based on the personnel employed, and the intervals were defined based on resolution 1260 of the CAN. The control group is small firms (10–49 employees).
Table 7 shows the relationship between TFPR and the size of the firms, which indicates the returns of an extra unit of capital and labor decrease with the firm’s size. Following the heuristic interpretation of the TFPR differences presented above, the results indicate that a dollar of capital and labor allocated to small firms is worth 8.7% more than for medium-sized A firms, 10% more than for medium-medium-sized B firms and 19% more than for large firms. The results show that the returns to an extra unit of capital and labor tend to decline with firm’s size, which indicates that smaller firms tend to have size constraints, while larger firms appear to be subsidized. This could imply small firms have greater difficulties in accessing financing for not having a credit history or the necessary guarantees to obtain credit. Also, it could mean small firms have difficulties in compensating for the lack of credit, with eva-sion of taxes and labor regulations. The results indicate that in the Ecuadorian manufactur-ing sector, credit market constraints seem to be the most likely source of misallocation.
The literature identifies two underlying factors that cause the misallocation of resources: policy distortions and market imperfections. Policy distortions can prevent an efficient allo-cation of resources at levy plant-level taxes or subsidies to output or the use of production factors such as capital and labor. Idiosyncratic distortions can be generated by multiple poli-cies which create heterogeneity in the benefits or costs faced by individual producers.
In this context, Restuccia and Rogerson (2017) identify that misallocation may be related to policy distortions that reflect statutory provisions such as tax code and regulations. These include labor, land and market regulations, as well as differentiated regulations which are applied according to the firms’ characteristics. They also identify discretionary provisions as a source of misallocation. These regulations formulated by public or private institutions favor or penalize specific firms through tax breaks, subsidies, financial credit with interest rates, selective enforcement of the law, preferential market access, between others.
Table 7 Log regression ( TFPRsi/TFPRs ) on size Source: Author’s calculations using the INEC
Manufacturing Surveys
Robust errors standard in brackets ***p < 0.01, **p < 0.05, *p < 0.1
Variables (1)
TFPR
Median A − 0.087
[0.016]***
Median B − 0.100
[0.018]***
Large − 0.198
[0.016]***
Constant 0.263
[0.009]***
Observations 16,517
On the other hand, market imperfections such as market frictions, monopoly power and enforcement of property rights can cause misallocation. The literature (see, among others, Buera and Shin 2013, and Caselli and Gennaioli 2013) has widely related misallocation of resources to a specific market imperfection: financial frictions in the capital market. Wu (2018) argues that financial frictions may reduce total factor productivity through two chan-nels: preventing entry of productive firms and misallocating capital among the existing firms. According to Busso et al. (2012b), if distortions are due to financial market failures, then many small firms would have difficulty growing because of the lack of credit or dif-ficulty of access. If this is the case, then on average returns to additional factors would be higher in small firms than in larger ones. On the contrary, if misallocation is due to une-qual enforcement of taxes, social security contributions or labor regulations, then the returns of additional capital and labor would be expected to be lower in smaller firms mainly because non-compliant firms are usually small and use regulatory evasion as a subsidy to expand (Busso et al. 2012b).
We found that the returns to an extra unit of capital and labor tend to decline with the firm’s size. Following Busso et al. (2012b), this implies that financial market failures seem a more likely source of distortions in Ecuador’s manufacturing sector. This implies that small firms are having trouble in accessing credit which would allow them to expand. The lack of credit history or insufficient guarantees prevents firms from acquiring credit, even if those firms are highly productive. This is especially true for small Ecuadorian manufacturing firms, which struggle to access credit because of their lack of signaling.
Although we have assessed financial market failures as one of the main causes of mis-allocation in the manufacturing sector by taking into consideration the returns of addi-tional factors according to the firms, it is important to take into consideration that the causes of misallocation are a broad theme that keeps being studied by researchers. In fact, there are two main approaches that the literature has followed in its attempt to find the main causes of misallocation: the direct approach and the indirect approach. Restuc-cia and Rogerson (2013) recognize there is still much work to be done, some of which faces serious challenges in assessing the potential role for misallocation and the specific channels through which misallocation occurs.
Studies that focus on specific causes of misallocation have not been done yet for Ecua-dor. In this sense, it is important to take into consideration that even though in this paper we made a first approach of the subject, a lot of researches are still necessary to assess the causes of misallocation in the country.
8 Conclusion
We used the method proposed by Hsieh and Klenow (2009) to establish the relationship between informality and productivity between formal and informal firms of the Ecua-dorian manufacturing sector. Informality was calculated according to the fulfillment of social security obligations.
Thus, a dollar of labor and capital assigned to firms in the 90th percentile is worth approximately twice as much as the same dollar assigned to firms in the 10th percentile.
In order to verify the existence of distortions in the manufacturing sector, we calcu-lated the dispersion of capital and output distortions that affect the firms´ productive processes. The existence of both distortions showed resources are not allocated effi-ciently. This indicates it is possible to obtain productivity gains for manufacturing firms.
Based on these results, we calculated the potential productivity gains in the absence of distortions, in a situation of efficient resource allocation. We used the model of Hsieh and Klenow (2009) to quantify the gains from the efficient allocation of resources within the manufacturing sector for the 3-digit ISIC industries. We found that productivity gains might have been around 80% in 2002 and 69% in 2015.
We analyzed the relationship between productivity and informality, considering the main element of study associated with informality as the differential of productivity between firms according to their situation of formality. We found that completely infor-mal firms are on average 42% less productive than forinfor-mal firms and that semi-forinfor-mal firms are on average 7% less productive than formal firms. In addition, the results indi-cate that a dollar of capital and labor alloindi-cated to formal firms is worth 30% more than for completely informal firms and 7% more than for semi-formal firms.
These results suggest that informality represents a high loss for productivity as well as a social problem. The existence of an inefficient allocation of resources in the Ecuadorian manufacturing sector indicates productivity gains can be obtained through the realloca-tion of resources.
Abbreviations
TFP: total factor productivity; INEC: Instituto Nacional de Estadística y Censos; LAC: Latin America and the Caribbean; IESS: Instituto Ecuatoriano de Seguridad Social; CES: constant elasticity of substitution; TFPQ: physical productivity; TFPR: revenue productivity; NBER: National Bureau of Economic Research; CES: Center for Economic Studies; ISIC: International Standard Industrial Classification of All Economic Activities; OLS: ordinary least squares; CAN: Comunidad Andina de Naciones.
Authors’ contributions
Authors RB and NA established the topic and methodology to use in the investigation. RB processed the data, used the methodology to find the results and wrote the manuscript. Both authors revised the conclusions and the final results. Both authors read and approved the final manuscript.
Author details
1 Pontificia Universidad Católica del Ecuador, Quito, Ecuador. 2 Université Grenoble Alpes, Grenoble, France. 3
George-town University, Washington, DC, USA.
Acknowledgements
Rafaela Bastidas thanks Sebastián Bastidas and Esteban Ferro for their help.
Competing interests
The authors declare that they have no competing interests.
Availability of data and materials
The datasets generated and/or analyzed during the current study are available in the Instituto Nacional de Estadística y Censos (INEC) repository, http://www.ecuad orenc ifras .gob.ec/manuf actur a-y-miner ia/.
Funding Not applicable.
Appendix
Busso et al. (2013) suggest evaluating the relationship between productivity and the firm’s size. To achieve this, we used an OLS regression of log ( TFPRsi/TFPRs ) on size dummies. We established the firms’ size based on the number of employees, and the intervals were defined based on resolution 1260 of the CAN. The control group is made up of small firms (10–49 employees).
Table 10 shows the relationship between productivity and firm size, which shows large firms (more than 200 employees) are more productive than smaller firms, clas-sified by the number of employees. Mid-sized firms A (50–99 employees) are on
Table 8 Number of firms by formality situation Source: Author’s calculations using the INEC Manufacturing Surveys
Status of formality Frequency Percentage
Formal 12,126 70%
Completely informal 914 5%
Semi-formal 4296 25%
Total 17,336 100%
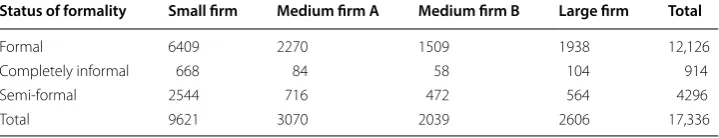
Table 9 Number of firms by the status of formality and size Source: Author’s calculations using the INEC Manufacturing Surveys
Status of formality Small firm Medium firm A Medium firm B Large firm Total
Formal 6409 2270 1509 1938 12,126
Completely informal 668 84 58 104 914
Semi-formal 2544 716 472 564 4296
Total 9621 3070 2039 2606 17,336
Table 10 Log regression ( TFPQsi/TFPQs on size Source: Author’s calculations using the
INEC Manufacturing Surveys
Standard robust errors in brackets ***p < 0.01, **p < 0.05, *p < 0.1
Variables (1)
TFPQ
Median A 0.56
[0.022]***
Median B 0.89
[0.024]***
Large 1
[0.022]***
Constant − 1
[0.012]***
Observations 16,517
average 75% more productive than small firms, medium B firms (100–199 employ-ees) are on average 144% more productive than small firms, and large firms are 284% more productive than small firms. That is, large firms are approximately 300% more productive than small firms.
Robustness check
In order to check the model’s robustness, we changed certain parameters used in the model. We take into account two different scenarios: a greater elasticity of substitution ( σ= 5) and a participation of capital and labor of the Ecuadorian manufacturing sector
( αs= 0.15 and 1-αs= 0.85, respectively).21 We also used the initial parameters as
bench-marks to contrast the results.
Table 11 shows the dispersion of firms’ physical productivity decreases when we assume intermediate inputs approach perfect substitutes. When the resources of the Ecuadorian manufacturing sector’s participation are taken into consideration in place of the shares of the US manufacturing sector, results remain very similar in relation to the benchmark’s results.
In Table 12, we can observe that the change in the elasticity of substitution does not affect in greater quantity the results of the dispersion of TFPR of the benchmark. We can also verify that there is a change in the results obtained through the use of local partici-pation. However, there are no greater changes in the results, which indicate the results are resistant to changes in the assumptions of the model.
In Table 13, we see changes in the elasticity of substitution and shares do not affect the dispersion results in the output’s distortions a lot, compared to the benchmark. This indicates the robustness of the results against changes in the parameters of the model.
Table 11 TFPQ dispersion statistics, by years Source: Author’s calculations using the INEC Manufacturing Surveys
Year Benchmark Sigma = 5 Local shares
Number of firms p90–p10 Number of firms p90–p10 Number of firms p90–p10
2002 1322 3.15 1319 2.47 1319 3.14
2003 1329 3.2 1326 2.46 1326 3.17
2004 1259 3.15 1263 2.41 1255 3.02
2005 1326 3.14 1326 2.38 1329 3.07
2006 1345 3.22 1346 2.40 1347 3.22
2007 1308 2.99 1317 2.27 1303 3.02
2008 1340 3.09 1331 2.22 1334 3.10
2009 1371 3.15 1370 2.42 1375 2.98
2010 1349 3.16 1347 2.38 1346 2.99
2012 1303 2.99 1307 2.28 1305 3.01
2013 1129 2.79 1127 2.16 1125 2.73
2014 1097 2.81 1098 2.12 1108 2.77
2015 1039 2.69 1040 2.11 1045 2.67
21 These values of capital and labor participation of the Ecuadorian manufacturing sector have been taken as a reference
In Table 14, we can see the change in the elasticity of substitution and sharehold-ings do not affect in greater quantity the results of the dispersion of the capital distor-tions compared to the benchmark. This indicates the robustness of the results, with the changes in the parameters of the model.
Table 15 shows the results obtained from potential gains from the efficient allocation of resources, both for the benchmark and for the change of parameters used in the cal-culation. We can see the potential gains from the efficient allocation of resources were greater by altering the elasticity of substitution and less by altering the shares. These
Table 12 TPFR dispersion statistics, by years Source: Author’s calculations using the INEC Manufacturing Surveys
Year Benchmark Sigma = 5 Local shares
Number of firms p90–p10 Number of firms p90–p10 Number of firms p90–p10
2002 1322 2.16 1319 2.20 1319 1.50
2003 1329 2.11 1326 2.09 1326 1.51
2004 1259 2.18 1263 2.18 1255 1.44
2005 1326 2.03 1326 2.07 1329 1.50
2006 1345 2.01 1346 2.01 1347 1.54
2007 1308 1.91 1317 1.91 1303 1.53
2008 1340 2.02 1331 2.04 1334 1.51
2009 1371 1.96 1370 1.96 1375 1.46
2010 1349 1.93 1347 1.92 1346 1.37
2012 1303 1.86 1307 1.86 1305 1.43
2013 1129 1.80 1127 1.80 1125 1.25
2014 1097 1.83 1098 1.83 1108 1.29
2015 1039 1.79 1040 1.79 1045 1.23
Table 13 Dispersion statistics of output distortions, per year Source: Author’s calculations using the INEC Manufacturing Surveys
Year Benchmark Sigma = 5 Local shares
Number of firms p90–p10 Number of firms p90–p10 Number of firms p90–p10
2002 1322 1.68 1319 1.68 1319 1.60
2003 1329 1.64 1326 1.64 1326 1.61
2004 1259 1.54 1263 1.57 1255 1.52
2005 1326 1.61 1326 1.66 1329 1.59
2006 1345 1.65 1346 1.65 1347 1.61
2007 1308 1.66 1317 1.67 1303 1.63
2008 1340 1.6 1331 1.64 1334 1.56
2009 1371 1.56 1370 1.56 1375 1.53
2010 1349 1.55 1347 1.55 1346 1.49
2012 1303 1.53 1307 1.55 1305 1.53
2013 1129 1.34 1127 1.35 1125 1.33
2014 1097 1.33 1098 1.34 1108 1.33