TURBULENT FLUID FLOW VISUALISATION
IN AN AXI-SYMMETRIC CIRCULAR DUCT
WITH MULTIPLE SIDE MASS INJECTION
PRITAM DAS
Research Scholar & Corresponding Author
Department of Mechanical Engineering, Jadavpur University Kolkata- 700 032, West Bengal, India
Email: [email protected] DEBAJIT SAHA Post Graduate Student
Department of Mechanical Engineering, Jadavpur University Kolkata- 700 032, West Bengal, India
Email: [email protected] SNEHAMOY MAJUMDER
Associate Professor
Department of Mechanical Engineering, Jadavpur University Kolkata- 700 032, West Bengal, India
Email: [email protected] Abstract:
The analysis of the turbulent fluid flow through a circular duct with multiple side mass injection have been carried out using modified
model, considering streamline curvature effects by modifying the model constants. The flow pattern of the main bulk fluid at various locations of the duct due to the multiple side mass injection has been investigated. The formation of recirculatory flow has been visualized keeping the angles of the side injection sites as 90° and 15° respectively. Two cases of side injection velocities have been considered and results presented. The principle observation from the analysis is that the number of injection sites is an important parameter influencing the flow pattern of the main duct fluid and the location and angle of the multiple injection sites has a big role to get an optimum mixing of the cross turbulent flows. The effect of the side mass injection is very much prominent in the upstream side of the flow whereas the effect gradually reduces towards downstream.Keywords: Multiple side mass injection, streamline curvature, flow pattern, recirculatory flow.
1. Introduction
The phenomena of side injection flow injected normally or at an angle into a main turbulent bulk flow occur in various industrial processes. These include for example the effluent operations where streams are mixed for the dilution and reduction of pollutant formations. For design consideration in the dilution zone of a gas turbine combustor, mixing of air entering through the liner holes with high temperature combustion gasses leaving the primary zone is very much required to provide a more uniform temperature pattern and rapid quenching for chemical reaction. Generally the objective is to rapidly obtain a homogeneous mixture of the injectant and mainstream. The degree and rate of the mixing process is especially important in combustion applications since burning efficiency and exhaust composition directly depend on mass transfer and reaction kinetics. Several experimental, numerical and theoretical works have been done by many researchers where the parameters studied include the side injection angle, the penetration and mixing characteristics of cross turbulent flows.
Yang and Shyu (1998). The numerical result showed that the maximum pressure on the impinging surface move downstream while the inclination angle increased. Turbulent flow fields resulting from an oblique jet injecting from a rectangular side inlet duct into a rectangular main duct with an aspect ratio 3.75 without a forced crossflow were presented by Tong-Miin Liou et al. (1999). The main objectives were to study the effects of the side-jet angle (θ) and side-jet flow rate (Qs). The results showed that with increasing injection angle the size of the recirculation zone increases.
Woodfield et al. (2000) presented a study on numerical computation on recirculation flow structures in co-axial confined laminar jets. Their work showed that the formation of the recirculation zone is greatly influenced by Reynolds number and ‘Craya-Curtet (Ct)’ number under laminar flow conditions. The Craya-Curtet number is an important parameter for characterizing the re-circulation zones that are often associated with mixing of jets. The mixing process of turbulent streams within a pipeline due to single and multiple transverse jets was analyzed by Giorges et al. (2001). The numerical results suggested that multiple jets ensure better mixing in addition to decreasing power requirements with an increasing number of jets. Chemical mixing in an open channel with multiple circular turbulent jets were investigated by Moawad et al. (2001).The experiments were carried out by varying the ratio of velocity of jets to that of cross flow, number of side injection ports and the distance between the injection ports. It was concluded that by using multiple jets, one can achieve better mixing in a shorter distance from the jet injection point than using a single jet.
A row of jets discharging normally into a confined cylindrical cross flow was numerically investigated using the control-volume-based finite difference method by Tao et al. (2002). Parameter variations studied include nozzle diameter, number of nozzles, duct radius, jet and mainstream volume-flow, temperature ratio, and dynamic pressure ratio. The values for penetration depth and nozzle spacing were described for optimum mixing. The two dimensional impinging circular twin jet flow with no cross flow was studied numerically and experimentally by Abdel-Fattah (2007). He concluded that the sub atmospheric region occurs at the impinging plate and it increases strongly by increasing Reynolds number and decreases as the jet angle decreases. To study the mixing and emissions in the RQL combustor scheme to minimize the formation of NOX in gas turbine combustor Holderman and Chang (2008) investigated the mixing of multiple jets with a confined subsonic cross flow. The experimental results showed that the number of orifices had a significant effect on mixing and the NOX emission.
The behavior of single and multiple horizontal gas jet injections into a rectangular bubbling fluidized bed were studied by Li et al. (2009) with three dimensional numerical simulations. It has been shown that the secondary gas injection strongly affected the upper part above the injection level. The interference effects of side jets with supersonic cross flow for a lateral jet controlled missile were simulated numerically by Ashwin and Chakraborty (2010). From detailed flow field analysis it was observed that the generation of pitching moment took place due to low pressure region behind the jet nozzle and the normal force and pitching moment was seen to vary linearly with the jet pressure ratio.
The present study is aimed at visualizing the flow pattern of the main turbulent fluid at various location of the circular duct due to multiple side mass injection. The angle of side injection of the primary injection site has been taken as 90° and the angle of the secondary injection site has been taken as an acute angle of 15°. The side injection velocity have been considered as -0.5 m/s and -1.0 m/s respectively. Standard
k
model together with modification due to streamline curvature has been employed to resolve the re-circulating flow regions accurately. The flow has been considered to be incompressible, turbulent, non-reacting and axi-symmetric. The control volume formulation with power law scheme of S.V.Patankar [9] with SIMPLER algorithm has been adopted. The momentum and the k-ε equations have been solved with the aid of wall function. It has been observed that the onset of recirculation as well as the pattern of the recirculation bubble strongly depends on the side injection.2. Geometrical Description
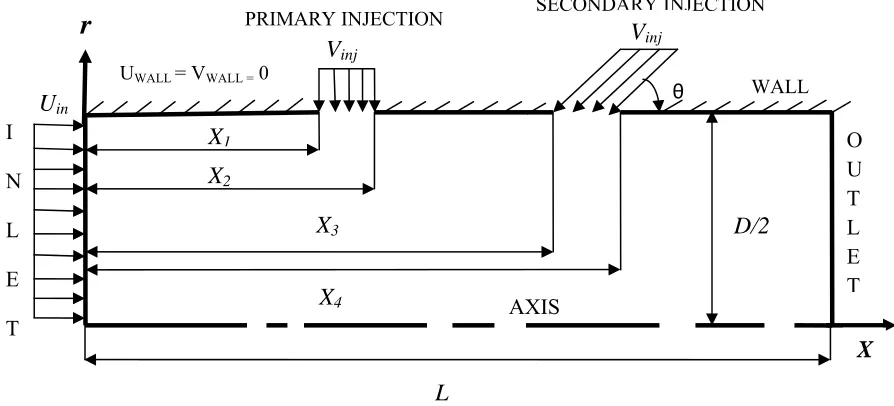
Figure 1 shows the essential features of the cylindrical axi-symmetric turbulent fluid flow, which has been considered in the present study with entries in the duct from both radial and axial directions. Here, the number of side injection site has been taken as 2. The cylindrical coordinate rx has been considered. The inlet velocity is
shown as Uin and the radially inward velocity of side injection as Vinj. The velocity of side injection of both the
injection site has been taken same. The axial extent of the first side injection site is from
1 X to
2
X while the axial
extent of the second one is from X3 to X4.
The diameter of the duct is considered as D= 0.1534 m. Air density, =1.235 kg/m3.
Molecular viscosity of air, l=1.85310-5kg/m.s.
Reynolds number, Re = (Umean D)/l. where Umean is the mass-averaged axial inlet velocity.
Fig. 1. Schematic diagram of the axi-symmetric circular duct with main turbulent flow and multiple side injection
3. Mathematical Modeling
The mass and momentum conservation equations in axi-symmetric cylindrical co-ordinate system for the turbulent mean flow with eddy viscosity model is given as follows:
3.1.Governing equations
3.1.1. Continuity equation:
0 ) ( 1 ) ( r v r r x u (1)
3.1.2. Momentum Equations: Axial component (x-component):
x v eff r r r x u eff x r u eff r r r x u eff x x p x u u r u v 1 1 (2)Radial component (r-component):
AXIS SECONDARY INJECTION PRIMARY INJECTION
U
inV
injV
inj θX
2X
1X
4 I N L E TX
3 WALL UWALL = VWALL = 02 2 1 1 r v eff r v eff r r r r u eff x r v eff r r r x v eff x r p x v u r v v (3)
Where,
u
andv
the mean velocity components alongx
andr
directions respectively. The effective viscosity is,t l eff
(4)
Where,
land
tare molecular or laminar viscosity and eddy or turbulent viscosity respectively. The eddy viscosity is given by,
2/
C
t
Where, Cis an empirical coefficient.
It is evident that modifications to the eddy viscosity are necessary to include the streamline curvature effect. In the present study the modification is taken from the concept given by Rodi et al. (1981) and Majumder et al. (2008).
3.2. െ ࢿ Equation
The k
equations are given by, 3.2.1. ݇ െ Equation
G r k k t l r r r x k k t l x r k v x ku 1 (5)
Where,
G
is the production term and given by:
2 2 2 2 2 x v r u r v x u r v t G The production term represents the transfer of kinetic energy from the mean flow to the turbulent motion through the interaction between the turbulent fluctuations and the mean flow velocity gradients.
3.2.2. ߝ െEquation
k C k G C r t l r r r x t l x r v x u 2 2 1 1
(6)Here, C1,C2,kand are the empirical turbulence constants, and some typical values of these constants in
the standard
model are recommended by Launder and Spalding which are given below- 1
C = 1.44 C2 = 1.92
k
= 1.0 = 1.3
The standard wall function has been adopted from Launder et al. (1974) for the solution of the k equations for the problem investigated here.
4. Results and Discussions
for both of the cases the injection velocity has been increased to visualize the flow pattern at various locations in the circular duct. A number of flooded contours plots of stream lines showing the effects of the primary and secondary mass injection have been presented and described. The changes of the flow pattern at various locations due to the increase of side injection velocity have been visualized from the colored flooded contour and vector diagram. The change of the size of recirculation can clearly visualize from the given diagrams.
The inlet main velocity is taken as 0.5 m/s and the side injection velocity has been varied from 0.5 m/s to -1 m/s. The primary and secondary injection site has been placed at a distance of 0.9 m and -1.8 m from the inlet respectively. The primary injection site is located between 0.9 m to 1.4 m while the secondary site is located between 1.8 m to 2.3 m respectively. The primary side mass injected normally into the main bulk fluid whereas the angle of the secondary side injection site is 15°. The total length of the circular duct has been divided into five sections to analyze the flow pattern in the individual portion. The effects of multiple side mass injection in the individual section have been described in the following paragraphs.
4.1. X= 0 m to X= 0.175 m
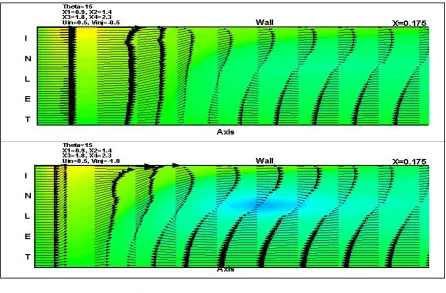
In this section the flow visualization have been concentrated from the inlet to axial distance X = 0.175 m. In the fig. 2 flooded contours of stream line have been presented for injection velocity of 0.5 m/s and 1.0 m/s respectively.. The contour is plotted within the region of X=0 to 0.175 m. The figure depicts that a recirculation is generated for both of the cases of Vinj=-0.5 to -1.0 m/s keeping the inlet velocity constant at 0.5 m / s. However, if
the side injection velocity is increased from -0.5 m/s to -1 m/s the recirculation zone is shifted towards the inlet. For both of the cases the recirculation zone is present, however for the case of Vinj= -1 m/s the flow in a form of
recirculation bubble affects more upstream region than the case of Vinj= -0.5 m/s.
Fig. 2. Effect of side injection within the flow field from inlet to X= 0.175m
At an injection velocity of Vinj = -1.0 m/s the recirculation started very early in the upstream than the case
of Vinj = -0.5 m/s. This can be evident from the table 1 that the value of non-dimensionalised axial distance of
Table 1. Non dimensional axial distance of recirculation started corresponding to Side injection velocity
inj
V
D
X
RS0.5 m/s
0.5215
1.0 m/s
0.2933
4.2. X= 0.085 m to X = 1.0625 m
In the fig. 3, contours of streamline along with the vector plotting corresponding to the region of X = 0.085 to 1.0625 m, for the same flow conditions as that of the figure 1 has been shown. It is observed that there are recirculation zone generated due to the bending of the side injection flow towards the upstream side. Actually the side mass injected, gets penetrated up to a certain depth and then it recirculates entraining the upstream flow. This is very much possible physically as a partial low pressure zone is generated while the side injection mass is penetrated through a finite depth. This causes the recirculation bubble in this region. However the recirculation generated for the case of Vinj = -1 m/s is much larger indication the low pressure zone of large space.
4.3. X= 1.07 m to X= 1.8 m
Fig.4. Effect of side injection within the flow field from X= 0.085 m to X= 0.10625 m
In the fig. 4, streamline contour corresponding to X = 1.07 to 1.8 m has been shown for Vinj= 0.5 m/s and
4.4. X= 1.4 m to X= 3.0 m
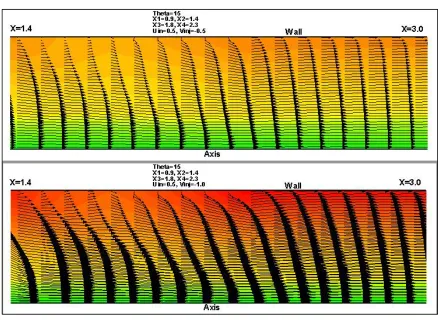
Fig.5. Effect of side injection within the flow field from X= 1.4 m to X= 3.0 m
Figure 5, shows the fluid pattern within the flow field from X= 1.4 m to X= 3.0 m. In this region the effect of the secondary mass injection is very much prominent. The secondary side mass injection can be divided into two components. The horizontal component is VinjCos and the vertical component is VinjSin. The effect of the
secondary mass on the main bulk fluid is not as vital as that of the primary mass injection. A recirculation of negligible strength generated and with the increase of the side injection velocity the size of the recirculation generated. The effect of mass injection gradually decreases towards the downstream. With the increase of the injection velocity the recirculation increases in this region.
4.5. X= 3.0 m to X = 9.0 m
Fig.6. Effect of side injection within the flow field from X= 3.0 m to X= 9.0 m
Nomenclature
D [Diameter of the cylindrical duct, m]
[Angle of side injection, degree] L [Length of the cylindrical duct, m]C
t [Craya- Curtet number]R [Radius of the cylindrical duct, m]
M [Mach number] X [Axial co-ordinate along the duct]
in
U [Inlet flow velocity, m/s]
RS
X
[Distance of onset of recirculation, m]r
[Radial co-ordinate across the duct]inj
V [Side injection velocity, m/s]
k
[Turbulent kinetic energy, m2/s2]l
[Laminar viscosity, kg/m-s]
[Turbulent dissipation rate, m2/s3]t
[Eddy viscosity, kg/m-s] [Density of air, kg/m3]
eff
[Effective viscosity, kg/m-s]
u
[Time mean velocity along x-axis, m/s] C [Empirical constant]v
[Time mean velocity along y-axis, m/s] G [Production term]
[Viscosity of the air, kg/m-s]c
R [Radius of curvature of the streamline]
[Stream function, m2/s]mean
U [Mass-averaged mean axial velocity, m/s]
Re
[Reynolds Number,
vD
] SUBSCRIPTS
1
K , K2[Constants] in [Inlet] inj [Injection]
References
[1] Abdel-Fattah, A. (2007): Numerical and experimental study of turbulent impinging twin- jet flow, J. Experimental thermal and fluid science, 31, pp. 1061-1072.
[2] Ashwin, G. and Chakraborty D. (2010): Numerical simulation of transverse side jet interaction with supersonic free stream. Aerospace Science and Technology, 14, pp. 295-301.
[3] Bain D. B. and Smith C. E. (1992): CFD mixing analysis of jets injected from straight and slanted slots into confined cross flow in rectangular ducts, NASA, AIAA-92-3087.
[4] Giorges, A. T. G., Forney, L. J. and Wang X. (2001): Numerical study of multi jet mixing. Trans IChemE, 79(A), pp. 515-522. [5] Holderman, J. D. and Chang, C. T. (2008): Mixing of multiple jets with a confined subsonic cross flow Part III.
[6] Li, T., Pougatch, K., Salcudean, M. and Grecov, D. (2009): Numerical simulation of single and multiple gas jets in bubbling fluidized bed. Chemical Engineering Science, 64, pp. 4884-4898.
[7] Moawad, A. K., Rajaratnam, N., Stanley, S. J. (2001): Mixing with multiple circular turbulent jets. Journal of Hydraulic Research, 39(2), pp. 163-168.
[8] Patankar, S. V., 1981. Numerical heat transfer and fluid flow,McGraw Hill, New York.
[9] Tao, Y., Adler, W. and Specht, E. (2002): Numerical analysis of multiple jets discharging into a confined cylindrical crossflow, Proceedings of the Institution of Mechanical Engineers, Part E: Journal of Process Mechanical Engineering, 216(3), pp. 173-180.
[10] Tong-Miin L., Chin-Chun L., Shih-Hui C. and Hsin-Ming L. (1999): Study on Side-Jet Injection Near a Duct Entry With various Injection angles. J. Fluid Engineering, 121, pp. 580-587.
[11] Woodfield, P.L., Nakabe, Kand Suzuki, K. (2000): Numerical computation on recirculation flow structures in co-axial confined laminar jets, JSCFD, 14, pp. 95-101.