Assessing pollinators’ use of floral resource
subsidies in agri-environment schemes:
An illustration using
Phacelia tanacetifolia
and honeybees
Rowan Sprague1, Ste´phane Boyer1,2, Georgia M. Stevenson3and Steve D. Wratten1
1Bio-Protection Research Centre, Lincoln University, Christchurch, New Zealand
2Environmental and Animal Sciences, Unitec Institute of Technology, Auckland, New Zealand 3Department of Ecology, Lincoln University, Christchurch, New Zealand
ABSTRACT
Background:Honeybees (Apis melliferaL.) are frequently used in agriculture for pollination services because of their abundance, generalist floral preferences, ease of management and hive transport. However, their populations are declining in many countries. Agri-Environment Schemes (AES) are being implemented in agricultural systems to combat the decline in populations of pollinators and other insects. Despite AES being increasingly embedded in policy and budgets, scientific
assessments of many of these schemes still are lacking, and only a few studies have examined the extent to which insect pollinators use the floral enhancements that are part of AES and on which floral components they feed (i.e., pollen and/or nectar). Methods:In the present work, we used a combination of observations on honeybee foraging for nectar/pollen from the Californian annual plantPhacelia tanacetifoliain the field, collection of pollen pellets from hives, and pollen identification, to assess the value of adding phacelia to an agro-ecosystem to benefit honeybees.
Results:It was found that phacelia pollen was almost never taken by honeybees. The work here demonstrates that honeybees may not use the floral enhancements added to a landscape as expected and points to the need for more careful assessments of what resources are used by honeybees in AES and understanding the role, if any, which AES play in enhancing pollinator fitness.
Discussion:We recommend using the methodology in this paper to explore the efficacy of AES before particular flowering species are adopted more widely to give a more complete illustration of the actual efficacy of AES.
Subjects Agricultural Science, Biodiversity, Ecology, Science Policy
Keywords Apis mellifera, Honeybee foraging behaviour, Agroecosystems, Pollen preference, Floral enhancements, Pollinator health strategies
INTRODUCTION
As many as 70% of crop species worldwide benefit directly or indirectly from pollination by animals (Klein et al., 2007), with insects contributing the most to this ecosystem service (ES). Of these pollinators, honeybees (Apis melliferaL.) are used most frequently in agriculture for pollination services because of their abundance, generalist floral
Submitted27 June 2016 Accepted12 October 2016 Published15 November 2016
Corresponding author
Rowan Sprague,
rowan.sprague@lincolnuni.ac.nz
Academic editor
Giovanni Benelli
Additional Information and Declarations can be found on page 11
DOI10.7717/peerj.2677
Copyright
2016 Sprague et al.
Distributed under
preferences, ease of management and transport of hives, and revenue-generating by-products (Tautz, 2008;Aizen & Harder, 2009;Potts et al., 2010a). Although the significance of unmanaged insects in crop pollination has been increasingly recognised (Winfree et al., 2008;Rader et al., 2009;Woodcock et al., 2013), reliance on honeybees has increased in recent decades in response to rising pollination needs and overall population declines of pollinators (Aizen et al., 2008;Breeze et al., 2011).
While demand for this ES is high, honeybee populations are declining in many countries, including the United States, Canada, the UK and Germany (Potts et al., 2010a;
Potts et al., 2010b;van der Zee et al., 2012;vanEngelsdorp et al., 2012). No single cause of this decline has been identified; rather, several factors are involved, notably varroa mites (Varroa destructor) (Sammataro, Gerson & Needham, 2000;Shen et al., 2005), pathogens such as American foulbrood (caused by the bacteriumPaenibacillus spp.) (Genersch, 2010), fungal parasites such asNosema(Potts et al., 2010a;Pettis et al., 2013), loss of biodiversity and associated floral resources in agricultural systems (Kremen et al., 2007;Klein et al., 2007;Potts et al., 2010a), and the use of neonicotinoid pesticides (vanEngelsdorp & Meixner, 2010;Potts et al., 2010a;Goulson, 2013).
Agri-environment schemes (AES) have been developed to mitigate some of these declines in ES, and this paper provides an illustration of how the value of such schemes for pollinators can be better assessed.
What are agri-environment schemes, and how effective are they?
In response to pollinator population declines, the European Commission has
recommended programmes aimed at improving pollinator fitness and efficacy as part of the wider fiscal policy of AES. Originating from the 1980s to protect biodiversity and important cultural areas in England, these schemes attempt to inform landowners and policy makers on methods to manage land sustainably and enhance ES (Natural England, 2012). Included in this policy are methods that claim to benefit pollinators such as bees and butterflies (Natural England, 2013a;Natural England, 2013b). The methods
recommended to improve pollinator fitness and efficacy do not usually involve crops which need to be pollinated by insects, but rather are usually a mix of wildflowers selected because of their high nectar and/or pollen quality planted in the field margins beside crops. AES have evolved over time to incorporate more tractable ways for farmers to become involved and to include more management recommendations to enhance a range of multiple ES; examples include ‘beetle banks’ or habitats for beetles (Thomas, Wratten &
Sotherton, 1992) and buffer strips of wildflowers between croplands (Department for
Environment, Food Rural Affairs & UK Government, 2014). By 2009, about 66% of
elements in its strategy which need to be researched before the government can recommend more effective policies (Vilsack & McCarthy, 2015).
Despite AES being increasingly embedded in policy and budgets, scientific assessments of many of these schemes still are lacking, such as quantifying the type, extent and quality of ES actually delivered (Kleijn & Sutherland, 2003;Kleijn et al., 2006;Whittingham, 2007). Also, few studies have examined the extent to which insect pollinators use the floral enhancements and whether the added resources serve as shelter, nest sites or pollen/nectar resources. In a study by Holland et al. (2015), researchers found that farm management, such as establishing florally-enhanced grass areas, and the amount of uncropped
habitats can positively affect the species richness and abundance of insect populations. An example of an AES approach which specifically targets pollinators is that by Pywell
et al. (2006), who found that bumblebees (Bombusspp.) benefited from wildflower mixes
and mixes of flowers with known high-quality pollen and nectar through increased abundance and species richness. However, this study did not examine how theBombus
spp. used the added floral resources and whether the bumblebees preferred the added flowers. This raises a key issue with studies of insect pollinators through floral
enhancement schemes. These schemes often lack comparisons of how these insects use the added floral resources compared to the other surrounding flowers. For example, there need to be more studies assessing the extent to which pollinators ‘prefer’ particular added flowers, their relative use of pollen and nectar on each plant species visited, diurnal and seasonal use of the resource, the value of the added flowers for other beneficial arthropods, and any associated ecosystem disservices (e.g., weediness potential) if these potential AES are to be adopted (Zhang et al., 2007;Wielgoss et al., 2014). Our study aims to addresses a key part of this issue, that of examining how and to what extent honeybees use the Californian annual plantPhacelia tanacetifolia(Bentham: Borginaceae; tansy leaf).
Farmers and policy makers need to have a clear and straightforward way to assess the values of AES implemented on farms. In the present work, we used a combination of observations on honeybee foraging for nectar/pollen fromPhacelia tanacetifoliaand collection of pollen pellets from nearby hives to assess the value of adding phacelia to an agro-ecosystem to benefit honeybees.
Honeybees as the study organisms
Honeybees were used here not only because of their agricultural importance, but also because of their distinct foraging behaviours. Individuals collect pollen by gathering the grains from the anthers of flowers and they use nectar to keep the grains together. They carry the pollen in pollen baskets (corbiculae) on their hind legs, forming pellets of pollen grains (Tautz, 2008). These bees demonstrate floral constancy, meaning that individual foraging bees will visit only one species of flower on any one day, sometimes even over several days (Free, 1963). As a result of this constancy, there is a 95–99% likelihood that a pellet will comprise pollen from only one species (Tautz, 2008).
honeybee waggle dance patterns to determine where they forage in landscapes containing different types of AES, as well as areas without any such stewardship measures. They found that these insects showed a significant foraging ‘preference’ for Higher Level Stewardship sites, or sites that met more complex requirements to address local needs and provide more than one ES (Couvillon, Schu¨rch & Ratnieks, 2014). However, this study did not explore whether or not this ‘preference’ was correlated with the type and quantity of floral resources available.Balfour et al. (2015)also examined honeybee waggle dance patterns and the surrounding available flowers for pollinators to determine where honeybees were foraging and which habitat and flower types in which they were most abundant. They found that honeybees were mostly found in field margins and hedgerows and that they foraged mainly for agricultural weeds. This study did not examine specifically whether honeybees preferred certain flowers over others and it did not take place where flowers had been added to enhance honeybee fitness or efficacy.Carvell et al.
(2007)found that bumblebee species abundance and diversity increased in response to
field margins with legumes providing pollen and nectar, but they concluded that a more diverse mix of flowers should be planted to offer a range of blooming durations and flower phenology. Few studies have examined the foraging preference of honeybees, or lack thereof, for particular plant species providing floral resources in an agricultural context, and no studies have examined honeybee preference for floral resources in AES
guidelines to test and better inform AES field and crop margin design. We did not study wild bees (native or bumblebees) in this study, as assessments of their preferences and colony fitness would be difficult due to their different life cycles and access to their nests compared to managed honeybee colonies.
Here, we used phacelia as a potential supplementary floral resource because this species is commonly included in florally-enhanced field margins AES (Carreck & Williams, 2002;
Decourtye, Mader & Desneux, 2010). It is a high-quality honey plant (Crane, Walker & Day, 1984) and a wide range of insect species forage on it (Carreck & Williams, 1997). Its pollen is said to have a high protein content (Trees for Bees, 2014) and its nectar and pollen improve the predation rate of insect biological control agents, including hoverflies (Diptera: Syrphidae) (Hickman & Wratten, 1996;Laubertie, Wratten & Hemptinne, 2012). For example,Laubertie, Wratten & Hemptinne (2012)compared how six different flowers (phacelia, buckwheat, coriander, alyssum, mustard, and marigold) commonly used as floral enhancements improved the fitness of hoverflies, and they found that phacelia overall improved fitness the most. For these reasons, we chose to use phacelia as our test flower species.
MATERIALS AND METHODS
Field site
The field site was located on the Canterbury Plains, New Zealand within an agricultural landscape (latitude:-43.63788760, longitude: 172.53225660). A single strip of
queens of similar age of 1–2 years old (determined by the beekeeper) were chosen, as the age of queens affects the pollen demand of the colony and thus the extent of pollen foraging (Tautz, 2008). While the site was modelled after AES guidelines for the UK, recommendations of enhancing agricultural landscapes with wildflowers or known insect-beneficial flowers are similar throughout many countries. Therefore the results from this study should be generalizable to other countries.
Pollen collection
Pollen traps (Dimou & Thrasyvoulou, 2007) were installed on both hives. Pollen pellets were collected every day on which no rain had fallen and which had a maximum air temperature at or above 14C (a total of twelve days between 7 November and 9 December 2014). Honeybees do not leave the hive to forage when the outside air temperature is below 11C or it is raining (Dimou, Thrasyvoulou & Tsirakoglou, 2006). The main entrance of the pollen traps was closed at 11:00 h and opened again at 13:00 h to collect all the pollen which the foraging bees brought back to the hive during this 2-h period. This period was selected because honeybee foraging activity is high during the middle of the day (Garcı´a-Garcı´a, Ortiz & Dapena, 2004) and because this period was likely to include those plant species for which the bees foraged in the morning and the afternoon.
The pollen pellets from each of the hives were collected at the end of the 2-h period and placed in separate 25 mL containers and stored at-20C to eliminate fungal growth. The pollen pellets from one of the hives during one of the 2-h periods was considered to be one sample.
Species identification from pollen samples
The pellets in each sample were weighed together and counted. The purple ones were separated from the others using forceps and placed in individual tubes, as the purple colour is indicative ofP. tanacetifoliapollen and no other known flowers in the area were thought to produce purple pollen. To confirm that the purple pellets collected really did comprise phacelia pollen, DNA barcoding with ITS primers was used to verify the species identity of theP. tanacetifolia pollen pellets.
Observations of honeybees foraging onP. tanacetifolia
The extent of the use ofP. tanacetifoliaby honeybees was examined through the pollen brought back to the hive and through the worker bees’ behaviour in the field.
The numbers of honeybees foraging for nectar and pollen, respectively, were observed visually and counted in a 10 m2area over 5-min periods at 10:00, 12:00, and 15:00 for ten days between mid-December to end of January depending on weather conditions. Bumblebees were also visually counted to see whether other pollinators were also foraging on the phacelia. Twenty flowers ofP. tanacetifoliawere chosen randomly and the quantity of pollen on the anthers was scored; the scoring scale is shown in Table 1. The ages of theP. tanacetifoliaflowers were also scored using the four stages defined by
Since the area ofP. tanacetifoliaflowers blooming changed throughout the experiment because of the sequential drilling, honeybee counts were divided by the area of flowers present on each date.
Data analysis
For the pollen pellet collection experiment, we analysed the count data to determine whether the total number of phacelia pollen pellets collected was significant compared to the total overall number of pellets. For our field observation experiments, to see if the number of honeybees foraging for nectar differed from the number of honeybees foraging for pollen, we used a paired two-tailed t-test. To test whether the number of honeybees foraging for nectar and for pollen varied with the time of day, the maturity of the flowers, and the amount of pollen on the flowers, a mixed effects linear model was used to account for the day on which the observations were taken. The data were bootstrapped to determine the 95% confidence intervals around the data. Likelihood Ratio Tests were used to determine which of these factors (if any) was significant for pollen and nectar foraging bees. We also used a mixed effects linear model to test whether the total number of bees foraging for both nectar and pollen was affected by the time of day, maturity of the flowers, and the amount of pollen on the flowers. We used a Likelihood Ratio Test again to determine whether these factors were significant overall. The R software program was used to explore and analyse the data (R Development Core Team, 2014).
RESULTS
Pollen collection experiment
Only oneP. tanacetifoliapollen pellet was found in a total of 23,431 pellets collected. The results of the DNA barcoding analysis confirmed that the purple pellet was from
P. tanacetifolia. A preliminary DNA barcoding analysis of other pollen pellets showed that the honeybees also collected pollen from clover (Trifolium spp.), dandelion (Taraxacum spp.) and brassicas (Brassica spp.). No statistical tests for significance were run on these data as the number ofP. tanacetifoliapollen pellets was negligible.
Table 1 Scores for amount of pollen onP. tanacetifoliaflowers.In brackets: percentage of the anther covered with pollen.
Amount of pollen Score
No visible pollen (0%) 0
Small amount of visible pollen (25%) 1
Some visible pollen (50%) 2
Large amount of visible pollen (75–100%) 3
Table 2 Score for maturity ofP. tanacetifoliaflowers (fromWilliams, 1997).
Maturity of flowers Score
Just-opened flower (Stage 1: curled filaments and style) 1 Mid-age flower (Stage 2: filaments uncurled and petals at about 60) 2 Mid-age-old flower (Stage 3: petals at about 20–60, styles longer than filaments) 3
Honeybees foraging on P. tanacetifoliain the field
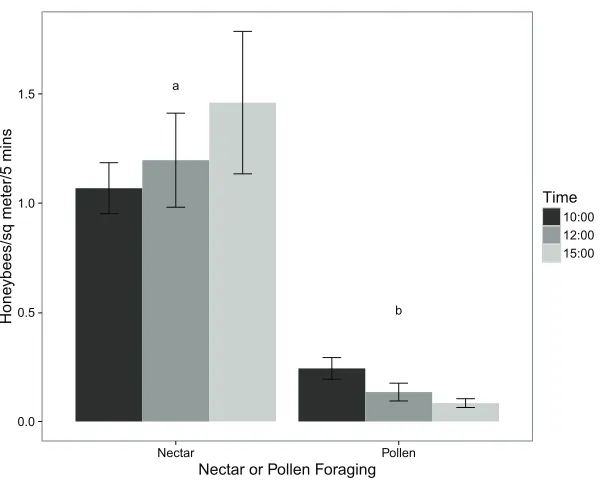
The virtual absence ofP. tanacetifoliapollen collected by honeybees is supported by the observations of their foraging behaviour in the field. Using a two-tailed t-test, the number of honeybees foraging for pollen was significantly lower than the number of those foraging for nectar (p value < 0.001).Figure 1shows the mean number of honeybees foraging for pollen and those foraging for nectar at different times of day. Comparing these results with those from the pollen collection experiment showed that while honeybees may virtually ignore the pollen ofP. tanacetifolia, they readily use the flowers for nectar.
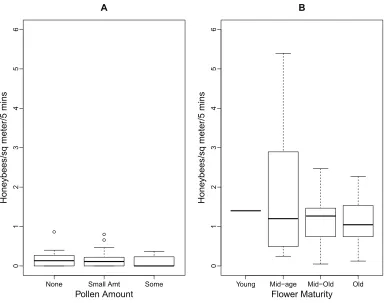
The boxplots inFig. 2 illustrate the relationships between the number of foraging honeybees, pollen amount, and flower maturity. As there were minimal numbers of honeybees foraging for pollen,Fig. 2Adoes not show any significant differences between the pollen amounts on the flowers. The median number of honeybees foraging for pollen and nectar did not differ between the four stages of flower maturity (Fig. 2B).
The results of Likelihood Ratio Test from the linear mixed effects model of number of pollen-foraging bees modelled by time of day showed that time was not significant (test = ANOVA, df = 4, 6,2 = 2.132, p value = 0.344) although there was a decrease in the number of pollen-foraging bees at 12:00 and 15:00. Neither pollen amount nor flower maturity had a significant effect on the number of pollen foragers (test = ANOVA, df = 5,10, 2 = 7.749, p value = 0.171; test = ANOVA, df = 6, 10,2 = 5.648, p value = 0.227 for pollen amount and flower maturity, respectively).
For the linear mixed effects models of nectar-foraging bees, the results of Likelihood Ratio Test for time of day showed that time was not significant (test = ANOVA, df = 5, 10,
2 = 4.984, p value = 0.418) although there was a decrease in the number of
0.0 0.5 1.0 1.5
Nectar Pollen
Nectar or Pollen Foraging
Hone
y
bees/sq meter/5 mins
Time
10:00 12:00 15:00 a
b
nectar-foraging bees at 12:00. Flower maturity did not have a significant effect on the number of nectar foragers (test = ANOVA, df = 6, 10,2 = 4.988, p value = 0.289) and there was not a noticeable trend in the data either. For pollen amount on the flowers, there was a trend with increasing numbers of nectar-foraging bees with higher amounts of pollen; however this trend was not significant (test = ANOVA, df = 5, 10,2 = 1.913, p value = 0.861).
For the linear mixed effects models of the total number of foraging bees (for both pollen and nectar), the results were similar to that of the nectar-foraging models. The results of Likelihood Ratio Test for time of day showed that time was not significant (test = ANOVA, df = 5, 10,2 = 7.141, p value = 0.210) although there was a decrease in the number of foraging bees at 12:00 and 15:00. Flower maturity did not have a
significant effect on the number of total foragers (test = ANOVA, df = 6, 10,2 = 7.004, p value = 0.136). For pollen amount on the flowers, there was again a trend with increasing numbers of foraging bees with higher amounts of pollen; however, this trend was not significant (test = ANOVA, df = 5, 10,2 = 2.862, p value = 0.721).
None Small Amt Some
0123456
A
Pollen Amount
Hone
ybees/sq meter/5 mins
Young Mid−age Mid−Old Old
01
2
3456
B
Flower Maturity
Hone
ybees/sq meter/5 mins
DISCUSSION
AES are being implemented in agricultural systems to combat the decline in
populations of pollinators and other insects, such as butterflies, as well as birds and mammals (Fahrig, 2003;Biesmeijer et al., 2006;Park, 2015;Frenzel, Everaars & Schweiger, 2016). The work here demonstrates that for honeybees, pollen identification at the hive can aid assessments of the extent to which pollen is being used by pollinators.
Combining this method with detailed observations in the field can give a more complete illustration of the actual efficacy of a particular floral resource.
The results here, showing honeybees gather mainly nectar from P. tanacetifolia,are supported by the study byWilliams & Christian (1991)which found that most visits by honeybees to this plant were for nectar rather than pollen (nectar 78/22% pollen), although this study did not studyP. tanacetifoliain an AES context. However,
P. tanacetifoliais used in crop margins in AES because its pollen has a high protein content and that this resource, as well as its nectar, can improve the fitness and longevity of insects (Hickman & Wratten, 1996;Laubertie, Wratten & Hemptinne, 2012). Because this current work has shown that honeybees used nectar almost exclusively, the plant’s benefits to bees may be less than those expected when AES protocols are designed. Although the nectar that the honeybees gathered from theP. tanacetifoliaflowers may have benefited the honeybee colonies, the bees were not receiving the expected benefits of the high-qualityP. tanacetifolia pollen.
This study also examined honeybee foraging behaviour on theP. tanacetifoliain relation to pollen amount and flower maturity. There was no significant relationship between the number of honeybees foraging on the phacelia and the amount of pollen found on the flowers, nor flower maturity for pollen, nectar, and total number of foraging bees. This may be because the number of bees foraging on the phacelia was so low overall that no significant conclusions could be drawn from this aspect. While there was no significant difference between the number of bees foraging and time of day, there did appear to be a trend for more foragers at 10:00 than at 12:00 and 15:00. One explanation for this apparent decrease is that pollen was depleted in the morning and not fully replenished later in the day.
Another explanation for decreasing foraging activity later in the day (and for low rates of foraging onP. tanacetifoliain general, with a maximum foraging density of only 5.4 honeybees per m2) is that this plant was a limited resource. Because honeybees as a colony tend to prefer to forage on the same species of plant when it’s in high densities (Tautz, 2008), theP. tanacetifoliamay not have been a large enough resource to provide a large or consistent enough reward to the honeybee colonies. To test whether this plant can be a limited resource or is of inherently low preference by honeybees, it should be planted as a mass flowering crop, as recommended byWestphal, Steffan-Dewenter &
Tscharntke (2003), to provide enough resource to be a sufficiently abundant resource
found as much as 32% of the pollen that was collected from the hives was from the
P. tanacetifolia strips, which supports the mass flowering idea.
It follows that AES may be of limited efficacy for honeybees because of floral area; most that have been implemented are not appropriately monitored and evaluated to test for effects of floral area planted on the response of insect pollinators (Kleijn & Sutherland, 2003;Kleijn et al., 2006;Whittingham, 2007). For example, both the United States Federal Government’s Pollinator Health Strategy report (Vilsack & McCarthy, 2015) and AES Environmental Stewardship Handbooks (Natural England, 2013a;Natural England, 2013b) lack practical and scientific ways to record and monitor the results of the landscape ‘enhancements’ made. Therefore, we recommend that the approach used in this study be used by researchers and farmers’ advisors to assess AES in more detail to determine how pollinators use them and how much they actually benefit from them. We suggest that the following procedures need to be included in AES assessments:
1) Use standard and repeatable field observations of how pollinators use the added floral enhancement in the field.
2) Identify the pollen that foraging bees bring back to the hive to determine the main plant species on which the bees forage and the extent to which pollen comes from the added floral resources.
Components 1 and 2 above were addressed in this study and were crucial for identifying how the honeybees were using the phacelia. By including observations of honeybees in the field and quantitative data from pollen brought back to the hive, scientists and stakeholders can determine the extent to which the honeybees were using the floral enhancements mainly for pollen or nectar, whether there were any temporal trends, and for which plant species the insects were mainly foraging.
An assessment of ‘fitness’ should also be considered as a component of long-term AES assessments, especially because these schemes have been proposed to enhance pollinator fitness. Such fitness improvements, or proxies for them, are most likely to be expressed in female worker bee numbers, the quantity of honey stored, survival rates in the colony through winter, and the extent to which the colony produces swarms in the spring. Assessments focussing on unmanaged or wild bees such as bumblebees, should make us of fitness indicators suitable for these particular species.
CONCLUSIONS
ACKNOWLEDGEMENTS
The authors would like to thank the Bio-Protection Research Centre for its support through excellent staff and equipment. We would also like to thank the Field Service Centre at Lincoln University, in particular Alan Marshall, Dave Jack, and Dan Dash, for helping cultivate the phacelia at our site. Finally, we would especially like to thank Dan Arthur, the beekeeper and landowner of the experimental site who provided beehives for the experiments and gave us valuable beekeeping and honeybee advice.
ADDITIONAL INFORMATION AND DECLARATIONS
Funding
Fulbright New Zealand and Fulbright US funded Rowan’s US Graduate Award, enabling her to complete this research in NZ. Bio-Protection Research Centre funded Georgia’s summer scholarship. The funders had no role in study design, data collection and analysis, decision to publish, or preparation of the manuscript.
Grant Disclosures
The following grant information was disclosed by the authors: Fulbright New Zealand and Fulbright US.
Bio-Protection Research Centre.
Competing Interests
The authors declare that they have no competing interests.
Author Contributions
Rowan Sprague conceived and designed the experiments, performed the experiments, analyzed the data, wrote the paper, prepared figures and/or tables, reviewed drafts of the paper.
Ste´phane Boyer conceived and designed the experiments, reviewed drafts of the paper.
Georgia M. Stevenson conceived and designed the experiments, performed the experiments, reviewed drafts of the paper.
Steve D. Wratten conceived and designed the experiments, reviewed drafts of the paper.
Field Study Permissions
The following information was supplied relating to field study approvals (i.e., approving body and any reference numbers):
Dan Arthur, the beekeeper and landowner of the experimental site, provided beehives for the experiments.
Data Deposition
Supplemental Information
Supplemental information for this article can be found online athttp://dx.doi.org/ 10.7717/peerj.2677#supplemental-information.
REFERENCES
Aizen MA, Garibaldi LA, Cunningham SA, Klein AM. 2008.Long-term global trends in crop yield and production reveal no current pollination shortage but increasing pollinator dependency.Current Biology18(20):1572–1575DOI 10.1016/j.cub.2008.08.066.
Aizen MA, Harder LD. 2009.The global stock of domesticated honey bees is growing slower than agricultural demand for pollination.Current Biology19(11):915–918
DOI 10.1016/j.cub.2009.03.071.
Balfour NJ, Fensome KA, Samuelson EEW, Ratnieks FLW. 2015.Following the dance: ground survey of flowers and flower-visiting insects in a summer foraging hotspot identified via honey bee waggle dance decoding.Agriculture, Ecosystems & Environment213:265–271
DOI 10.1016/j.agee.2015.08.007.
Biesmeijer JC, Roberts SPM, Reemer M, Ohlemuller R, Edwards M, Peeters T, Schaffers AP, Potts SG, Kleukers R, Thomas CD, Settele J, Kunin WE. 2006.Parallel declines in pollinators and insect-pollinated plants in Britain and the Netherlands.Science313(5785):351–354
DOI 10.1126/science.1127863.
Breeze TD, Bailey AP, Balcombe KG, Potts SG. 2011.Pollination services in the UK: how important are honeybees?Agriculture, Ecosystems and Environment142(3–4):137–143
DOI 10.1016/j.agee.2011.03.020.
Carreck N, Williams IH. 1997.Observations on two commercial flower mixtures as food sources for beneficial insects in the UK.Journal of Agricultural Science128(4):397–403
DOI 10.1017/S0021859697004279.
Carreck N, Williams IH. 2002.Food for insect pollinators on farmland: insect visits to flowers of annual seed mixtures.Journal of Insect Conservation6(1):13–23
DOI 10.1023/A:1015764925536.
Carvell C, Meek WR, Pywell RF, Goulson D, Nowakowski M. 2007.Comparing the efficacy of agri-environment schemes to enhance bumble bee abundance and diversity on arable field margins.Journal of Applied Ecology44(1):29–40DOI 10.1111/j.1365-2664.2006.01249.x. Couvillon MJ, Schu¨rch R, Ratnieks FLW. 2014.Dancing bees communicate a foraging preference
for rural lands in high-level agri-environment schemes.Current Biology24(11):1212–1215
DOI 10.1016/j.cub.2014.03.072.
Crane E, Walker P, Day R. 1984.Directory of Important World Honey Sources. London: International Bee Research Association.
Decourtye A, Mader E, Desneux N. 2010.Landscape enhancement of floral resources for honey bees in agro-ecosystems.Apidologie41(3):264–277DOI 10.1051/apido/2010024.
Department for Environment, Food and Rural Affairs, UK Government. 2014.The national pollinator strategy: for bees and other pollinators in England.Available athttps://www.gov.uk/ government/uploads/system/uploads/attachment_data/file/409431/pb14221-national-pollinators-strategy.pdf/.
Dimou M, Thrasyvoulou A. 2007.A comparison of three methods for assessing the relative abundance of pollen resources collected by honey bee colonies.Journal of Apicultural Research
Dimou M, Thrasyvoulou A, Tsirakoglou V. 2006.Efficient use of pollen traps to determine the pollen flora used by honey bees.Journal of Apicultural Research45(1):42–46
DOI 10.1080/00218839.2006.11101312.
Fahrig L. 2003.Effects of habitat fragmentation on biodiversity.Annual Review of Ecology, Evolution, and Systematics34(1):487–515DOI 10.1146/annurev.ecolsys.34.011802.132419. Free JB. 1963.The flower constancy of honeybees.Journal of Animal Ecology32(1):119–131
DOI 10.2307/2521.
Frenzel M, Everaars J, Schweiger O. 2016.Bird communities in agricultural landscapes: what are the current drivers of temporal trends?Ecological Indicators65:113–121
DOI 10.1016/j.ecolind.2015.11.020.
Garcı´a-Garcı´a MC, Ortiz PL, Dapena MJD. 2004.Variations in the weights of pollen loads collected byApis melliferaL.Grana43(3):183–192DOI 10.1080/00173130410020350. Genersch E. 2010.American Foulbrood in honeybees and its causative agent, Paenibacillus larvae.
Journal of Invertebrate Pathology103:S10–S19DOI 10.1016/j.jip.2009.06.015.
Gillespie MAK, Wratten SD.Negative ecosystem services and pest management. In: Coll M, Wajnberg E, eds.Pest Management within the Environment: Challenges for Agronomists, Ecologists, Economists and Policymakers(in press) Wiley-Blackwell.
Goulson D. 2013.REVIEW: an overview of the environmental risks posed by neonicotinoid insecticides.Journal of Applied Ecology50(4):977–987DOI 10.1111/1365-2664.12111. Henry M, Fro¨chen M, Maillet-Mezeray J, Breyne E, Allier F, Odoux J-F, Decourtye A. 2012.
Spatial autocorrelation in honeybee foraging activity reveals optimal focus scale for predicting agro-environmental scheme efficiency.Ecological Modelling225:103–114
DOI 10.1016/j.ecolmodel.2011.11.015.
Hickman JM, Wratten SD. 1996.Use ofPhacelia tanacetifoliastrips to enhance biological control of aphids by hoverfly larvae in cereal fields.Journal of Economic Entomology89(4):832–840
DOI 10.1093/jee/89.4.832.
Holland JM, Smith BM, Storkey J, Lutman PJW, Aebischer NJ. 2015.Managing habitats on English farmland for insect pollinator conservation.Biological Conservation182:215–222
DOI 10.1016/j.biocon.2014.12.009.
Kleijn D, Baquero RA, Clough Y, Dı´az M, De Esteban J, Ferna´ndez F, Gabriel D, Herzog F, Holzschuh A, Jo¨hl R, Knop E, Kruess A, Marshall EJP, Steffan-Dewenter I, Tscharntke T, Verhulst J, West TM, Yela JL. 2006.Mixed biodiversity benefits of agri-environment schemes in five European countries.Ecology Letters9(3):243–254DOI 10.1111/j.1461-0248.2005.00869.x. Kleijn D, Sutherland WJ. 2003.How effective are European agri-environment schemes in
conserving and promoting biodiversity?Journal of Applied Ecology40(6):947–969
DOI 10.1111/j.1365-2664.2003.00868.x.
Klein A-M, Vaissiere BE, Cane JH, Steffan-Dewenter I, Cunningham SA, Kremen C, Tscharntke T. 2007.Importance of pollinators in changing landscapes for world crops.Proceedings of the Royal Society B: Biological Sciences274(1608):303–313DOI 10.1098/rspb.2006.3721.
Kremen C, Williams NM, Aizen MA, Gemmill-Herren B, LeBuhn G, Minckley R, Packer L, Potts SG, Roulston T, Steffan-Dewenter I, Va´zquez DP, Winfree R, Adams L, Crone EE, Greenleaf SL, Keitt TH, Klein A-M, Regetz J, Ricketts TH. 2007.Pollination and other ecosystem services produced by mobile organisms: a conceptual framework for the effects of land-use change.Ecology Letters10(4):299–314DOI 10.1111/j.1461-0248.2007.01018.x. Laubertie EA, Wratten SD, Hemptinne J-L. 2012.The contribution of potential beneficial
insectary plant species to adult hoverfly (Diptera: Syrphidae) fitness.Biological Control
Natural England. 2009.Agri-environment schemes in England 2009 (NE194). Natural England, Department for Environment, Food & Rural Affairs, UK.Available athttp://publications. naturalengland.org.uk/publication/46002?category=35001.
Natural England. 2012.Evolution of agri-environment schemes in England (NE373). Natural England, Department for Environment, Food & Rural Affairs, UK.Available at
http://publications.naturalengland.org.uk/publication/3567470?category=35001.
Natural England. 2013a.Entry level stewardship: environmental stewardship handbook, fourth edition (NE349). Natural England, Department for Environment, Food & Rural Affairs, UK.
Available athttp://publications.naturalengland.org.uk/publication/2798159?category=35001. Natural England. 2013b.Higher level stewardship: environmental stewardship handbook, fourth
edition (NE350). Natural England, Department for Environment, Food & Rural Affairs, UK.
Available athttp://publications.naturalengland.org.uk/publication/2827091?category=35001. Park KJ. 2015.Mitigating the impacts of agriculture on biodiversity: bats and their potential role
as bioindicators.Mammalian Biology80(3):191–204DOI 10.1016/j.mambio.2014.10.004. Pettis JS, Lichtenberg EM, Andree M, Stitzinger J, Rose R, vanEngelsdorp D. 2013.Crop
pollination exposes honey bees to pesticides which alters their susceptibility to the gut pathogen Nosema ceranae.PLoS ONE8(7):e70182DOI 10.1371/journal.pone.0070182.
Potts SG, Biesmeijer JC, Kremen C, Neumann P, Schweiger O, Kunin WE. 2010a.Global pollinator declines: trends, impacts and drivers.Trends in Ecology & Evolution25(6):345–353
DOI 10.1016/j.tree.2010.01.007.
Potts SG, Roberts SPM, Dean R, Marris G, Brown MA, Jones R, Neumann P, Settele J. 2010b. Declines of managed honey bees and beekeepers in Europe.Journal of Apicultural Research
49(1):15–22DOI 10.3896/IBRA.1.49.1.02.
Pywell RF, Warman EA, Hulmes L, Hulmes S, Nuttall P, Sparks TH, Critchley CNR, Sherwood A. 2006. Effectiveness of new agri-environment schemes in providing foraging resources for bumblebees in intensively farmed landscapes. Biological Conservation
129(2):192–206 DOI 10.1016/j.biocon.2005.10.034.
R Development Core Team. 2014.R: a language and environment for statistical computing. Vienna: R Foundation for Statistical Computing.Available athttps://www.R-project.org/.
Rader R, Howlett BG, Cunningham SA, Westcott DA, Newstrom-Lloyd LE, Walker MK, Teulon DAJ, Edwards W. 2009.Alternative pollinator taxa are equally efficient but not as effective as the honeybee in a mass flowering crop.Journal of Applied Ecology46(5):1080–1087
DOI 10.1111/j.1365-2664.2009.01700.x.
Sammataro D, Gerson U, Needham G. 2000.Parasitic mites of honey bees: life history, implications, and impact.Annual Review of Entomology45(1):519–548
DOI 10.1146/annurev.ento.45.1.519.
Shen M, Yang X, Cox-Foster D, Cui L. 2005.The role of varroa mites in infections of Kashmir bee virus (KBV) and deformed wing virus (DWV) in honey bees.Virology342(1):141–149
DOI 10.1016/j.virol.2005.07.012.
Tautz J. 2008.In: Sandeman DC, ed.The Buzz about Bees: Biology of a Superorganism. Berlin, Heidelberg: Springer.
Thomas MB, Wratten SD, Sotherton NW. 1992.Creation of ‘island’ habitats in farmland to manipulate populations of beneficial arthropods: predator densities and species composition.
Journal of Applied Ecology29(2):524–531DOI 10.2307/2404521.
Available at http://www.treesforbeesnz.org/__data/assets/pdf_file/0003/71328/tfb-results-for-protein-count.pdf(accessed 12 May 2015).
van der Zee R, Pisa L, Andonov S, Brodschneider R, Charrie`re J-D, Chlebo R, Coffey MF, Crailsheim K, Dahle B, Gajda A, Gray A, Drazic MM, Higes M, Kauko L, Kence A, Kence M, Kezic N, Kiprijanovska H, Kralj J, Kristiansen P, Hernandez RM, Mutinelli F, Nguyen BK, Otten C, O¨ zkırım A, Pernal SF, Peterson M, Ramsay G, Santrac V, Soroker V, Topolska G, Uzunov A, Vejsnæs F, Wei S, Wilkins S. 2012.Managed honey bee colony losses in Canada, China, Europe, Israel and Turkey, for the winters of 2008–9 and 2009–10.Journal of Apicultural Research51(1):100–114DOI 10.3896/IBRA.1.51.1.12.
vanEngelsdorp D, Caron D, Hayes J, Underwood R, Henson M, Rennich K, Spleen A, Andree M, Snyder R, Lee K, Roccasecca K, Wilson M, Wilkes J, Lengerich E, Pettis J, The Bee Informed Partnership. 2012.A national survey of managed honey bee 2010–11 winter colony losses in the USA: results from the bee informed partnership.Journal of Apicultural Research51(1):115–124
DOI 10.3896/IBRA.1.51.1.14.
vanEngelsdorp D, Meixner MD. 2010.A historical review of managed honey bee populations in Europe and the United States and the factors that may affect them.Journal of Invertebrate Pathology103:S80–S95DOI 10.1016/j.jip.2009.06.011.
Vilsack T, McCarthy G. 2015.National strategy to promote the health of honey bees other pollinators. Report Issued by the White House the Pollinator Health Task Force on 19 May 2015.
Westphal C, Steffan-Dewenter I, Tscharntke T. 2003.Mass flowering crops enhance pollinator densities at a landscape scale.Ecology Letters6(11):961–965
DOI 10.1046/j.1461-0248.2003.00523.x.
Whittingham MJ. 2007.Will agri-environment schemes deliver substantial biodiversity gain, and if not why not?Journal of Applied Ecology44(1):1–5DOI 10.1111/j.1365-2664.2006.01263.x. Wielgoss A, Tscharntke T, Rumede A, Fiala B, Seidel H, Shahabuddin S, Clough Y. 2014.
Interaction complexity matters: disentangling services and disservices of ant communities driving yield in tropical agroecosystems.Proceedings of the Royal Society B: Biological Sciences
281(1775):20132144DOI 10.1098/rspb.2013.2144.
Williams CS. 1997.Nectar secretion rates, standing crops and flower choice by bees onPhacelia tanacetifolia.Journal of Apicultural Research36(1):23–32
DOI 10.1080/00218839.1997.11100927.
Williams IH, Christian DG. 1991.Observations onPhacelia tanacetifoliaBentham
(Hydrophyllaceae) as a food plant for honey bees and bumble bees.Journal of Apicultural Research30(1):3–12DOI 10.1080/00218839.1991.11101227.
Winfree R, Williams NM, Gaines H, Ascher JS, Kremen C. 2008.Wild bee pollinators provide the majority of crop visitation across land-use gradients in New Jersey and Pennsylvania, USA.
Journal of Applied Ecology45(3):793–802DOI 10.1111/j.1365-2664.2007.01418.x.
Woodcock BA, Edwards M, Redhead J, Meek WR, Nuttall P, Falk S, Nowakowski M, Pywell RF. 2013.Crop flower visitation by honeybees, bumblebees and solitary bees: behavioural differences and diversity responses to landscape.Agriculture, Ecosystems & Environment171:1–8
DOI 10.1016/j.agee.2013.03.005.
Zhang W, Ricketts TH, Kremen C, Carney K, Swinton SM. 2007.Ecosystem services and dis-services to agriculture.Ecological Economics64(2):253–260